
|
시장보고서
상품코드
2100515
광센서 시장 : 시장 점유율 분석, 업계 동향 및 통계, 성장 예측(2026-2031년)Photonic Sensors - Market Share Analysis, Industry Trends & Statistics, Growth Forecasts (2026 - 2031) |
||||||
 Mordor Intelligence
Mordor Intelligence에 의하면, 광센서 시장 규모는 2025년 330억 1,000만 달러로 평가되었고, 2026년에는 366억 8,000만 달러로 확대될 것으로 추정되고, 2026-2031년 CAGR 11.12%로 성장을 지속할 전망이며, 2031년에는 621억 3,000만 달러에 이를 것으로 예측됩니다.
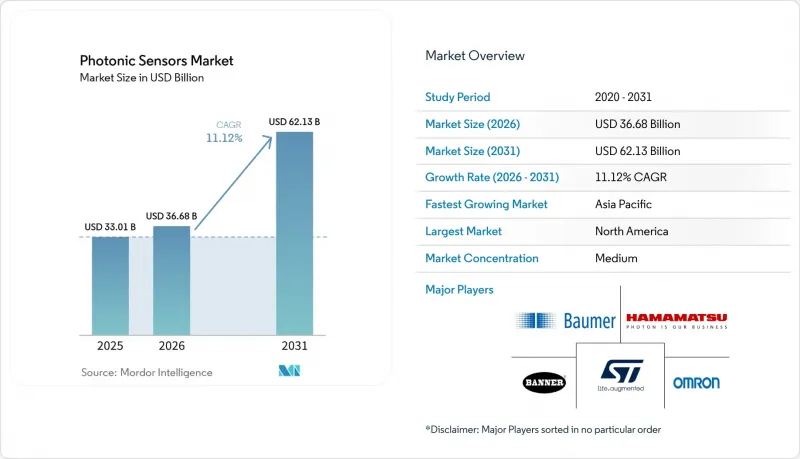
본 보고서는 제품 유형별(광섬유 센서, 이미지 센서, 기타), 최종 사용자 산업별(항공우주 및 방위, 자동차, 산업 자동화, 기타), 용도별(구조 건전성 모니터링, 온도·압력 감지, 기타), 기술별(파이버 브래그 그레이팅, 파브리-페로 간섭법, 기타), 지역별로 분류되어 있습니다. 시장 전망은 금액(달러) 기준으로 제시되어 있습니다.
세계의 광센서 시장 동향 및 인사이트
제조 현장의 자동화 수요 증가
산업 시설에서는 마이크론 수준의 정밀도와 전자기 노이즈에 대한 내성이 필수적인 상황에서 광센서가 도입되고 있습니다. 도막 두께 측정, 용접부 검사, 진동 모니터링 등은 광섬유 센싱이 생산 수율을 향상시키는 대표적인 사례입니다. 예지보전 프로그램에서는 치명적인 고장이 발생하기 전에 베어링의 마모를 감지하는 분산형 포토닉 어레이가 통합되어 있습니다. 자동차 차체 공장에서 로봇 유도를 위해 레이저 변위 센서를 활용하여 사이클 타임을 단축하고 있습니다. 인더스트리 4.0의 도입으로 실시간 분석에 대한 수요가 높아지고 있으며, 광센서의 긴 수명은 초기 투자 비용을 상쇄합니다. 공장의 디지털화가 진행됨에 따라 광센서 시장은 결정론적 데이터가 필요한 제어 루프에 더욱 깊이 통합될 것입니다.
광통신 인프라에 대한 투자 확대
통신 사업자들은 수천 킬로미터에 달하는 네트워크를 따라 온도, 변형, 침입을 모니터링하고 서비스 가동 시간을 확보하기 위해 분산형 광섬유 센싱을 도입하고 있습니다. 데이터센터 운영자는 전자 프로브로는 감지할 수 없는 핫스팟을 파악하기 위해 랙 내에 포토닉 온도 어레이를 통합하고 있습니다. 5G 밀도가 높아짐에 따라 기지국 간 링크 수가 두 배로 증가하면서, 지연 및 전력 드리프트를 보고하는 인라인 광 모니터의 도입이 촉진되고 있습니다. 북미와 유럽의 경기 부양책으로 자금을 지원받는 스마트 그리드 프로그램에는 정전 빈도를 억제하기 위한 광섬유 고장 감지 기술이 포함되어 있습니다. 용량 업그레이드가 진행됨에 따라 내장형 센싱이 표준 기능이 되고 있으며, 광센서 시장은 캐리어급 하드웨어 부문으로 확대되고 있습니다.
높은 초기 도입 비용
종합적인 광센서 시스템의 비용이 5만-20만 달러인 반면, 전자식 센서의 경우 1만-3만 달러에 불과하기 때문에 공장이나 클리닉에서의 투자 회수 기간이 길어지고 있습니다. 중소기업은 제품 수명 주기 전반에 걸친 유지 관리 비용이 낮음에도 불구하고 업그레이드를 미루고 있습니다. 도입에는 전문 설치 업체나 교육이 필요하여 총 소유 비용을 높이고 있습니다. 의료 분야에서는 보험 환급 제도가 기술 발전을 따라가지 못하고 있어, 임상적 이점이 명확하더라도 바이오포토닉 진단 기술의 도입이 제한되고 있습니다. 생산량이 증가하고 통합 설계가 성숙해짐에 따라 단가는 하락하겠지만, 단기적인 예산 제약으로 인해 광센서 시장의 성장 궤도는 억제되고 있습니다.
부문 분석
2025년, 광센서 시장 규모에서 이미지 센서는 37.55%의 점유율을 유지했습니다. 이는 자동차용 카메라, 산업용 라인 스캔 시스템, 머신 비전 도구에서 확장 가능하고 저비용의 광전자 장비가 요구되었기 때문입니다. 한편, LiDAR 플랫폼은 실시간 3D 매핑이 필요한 자율주행, 창고 로봇, 스마트 인프라의 도입으로 인해 12.03%라는 가장 높은 연평균 성장률(CAGR)을 기록하고 있습니다. 솔리드 스테이트 설계 덕분에 단가는 2020년 1만 달러에서 2024년까지 1,000달러 이하로 대폭 하락하여 도입에 있어 큰 장벽이 제거되었습니다. 광섬유 센서는 낙뢰나 전자기 간섭에 대한 내성이 비용을 상회하는 구조 건전성 모니터링 분야에서 틈새 역할을 담당하고 있습니다. 바이오광센서는 진단 부문, 특히 만성 질환 관리를 위한 혈당 및 젖산 모니터링 분야에서 그 입지를 강화하고 있습니다.
LiDAR 공급업체들은 포토닉스 산업 전반에 걸친 중요한 혁신인 실리콘 포토닉 칩 위에 빔 스티어링과 신호 처리를 통합하여, 폼 팩터 크기를 축소하고 전력 소비를 억제하고 있습니다. 이는 자동차 산업의 인증 요건에도 부합합니다. 이미지 센서 공급업체들은 CMOS 제조의 비용 우위를 활용하여, 공장 검사 시 극한의 조명 조건에서도 사용 가능한 높은 동적 범위의 장치를 시장에 출시하고 있습니다. 테라헤르츠 이미저(THz imager)는 보안 검색 및 비파괴 검사에 활용되고 있으나, 재료의 흡수 특성과 규제상의 장벽으로 인해 단기적인 생산량은 제한적입니다. 양자점 검출기는 실온에서 적외선 감도를 실현할 가능성을 지니고 있어 야간 투시 기술에 대한 관심을 모으고 있습니다. 각 기술이 성숙해짐에 따라 상호 융합이 진행되고 있습니다. 예를 들어, 3D 카메라에는 구조화된 광 방출기가 내장되어 있고, LiDAR 유닛에는 센서 융합을 위해 카메라가 내장되어 있습니다. 이러한 융합으로 인해 광센서 시장의 수익원이 다양화되고 있습니다.
2025년에는 산업 자동화가 광센서 시장의 29.21%를 차지했습니다. 이는 예측 유지보수 및 품질 보증 분야에서 지속적이고 간섭 없는 데이터가 요구되기 때문입니다. 자동차 부문은 2031년까지 연평균 성장률(CAGR) 11.71%로 확대될 것으로 예상되며, 이는 첨단 운전자 보조 시스템(ADAS)에서 안전성의 이중화를 확보하기 위해 LiDAR, 이미징, 적외선 어레이가 추가되고 있기 때문입니다. 항공우주 및 방위 부문에서는 항법 및 위협 감지에 대한 수요가 견조하게 유지되고 있으며, 진동, 방사선, 극한 온도 환경에 대응할 수 있는 견고한 광센서가 채택되고 있습니다.
의료 분야에서는 웨어러블 생체 센서 및 로봇 수술의 보급이 가속화되고 있는 반면, 에너지 및 유틸리티 부문에서는 파이프라인 및 케이블 라인의 실시간 모니터링을 위해 분산형 광섬유 시스템이 채택되고 있습니다. 가전 시장은 여전히 가격에 민감하지만, 증강현실(AR) 헤드셋과 제스처 제어 장치가 새로운 설계 채택의 기회를 열어주고 있습니다. 환경 모니터링 기관에서는 10억 분의 1 수준에서 오염 물질을 감지하는 포토닉 가스 분석 장치가 도입되고 있습니다. 이러한 동향들이 맞물리면서, 광센서 산업의 사업 영역은 초기 산업 부문이라는 틀을 넘어 확대되고 있습니다.
지역별 분석
북미는 지속적인 국방 조달, 반도체 팹, 고성능 센싱에 의존하는 자율주행차의 초기 실증 프로젝트 덕분에 2025년 매출의 38.28%를 차지했습니다. 연구 중심 대학 및 벤처 캐피털 생태계 덕분에 구상부터 상용화까지의 주기가 단축되는 한편, 생산의 국내 복귀(리쇼어링)를 촉진하는 인센티브가 반도체 및 배터리 공장 수요를 끌어올리고 있습니다. FDA(미국 식품의약국)의 규제로 인해 의료기기 시장 출시까지 소요되는 기간은 길어지지만, 진입 장벽도 높아져 광센서 시장에서 기존 기업의 입지를 공고히 하는 결과로 이어지고 있습니다.
아시아태평양은 중국, 일본, 한국이 인건비를 상쇄하고 수출 품질 기준을 충족하기 위해 공장 자동화를 추진함에 따라, 2031년까지 연평균 성장률(CAGR) 12.09%로 성장할 전망입니다. 중국의 ‘일대일로’ 프로젝트에서는 파이프라인과 철도에 광섬유를 이용한 모니터링 시스템이 도입되고 있습니다. 일본의 고령화 사회에서는 재택 간호용으로 포토닉 진단 기술이 채택되고 있는 반면, 한국의 반도체 산업에서는 피코그램 수준의 감도를 가진 부유 입자 검출기가 설치되어 있습니다. 지방 자치 단체는 센서 제조 공장에 대해 세제 우대 조치를 시행하여 지역 공급망을 강화하고 있습니다.
유럽에서는 기술 수출과 엄격한 안전성·지속가능성 요건 간의 균형이 유지되고 있습니다. 독일의 ‘인더스트리 4.0’ 프로그램을 통해 중견 기업(미텔슈탄트)의 공장에 지능형 센싱 기술이 보급되고 있으며, EU의 ‘그린 딜’은 분산형 광섬유 센싱을 활용한 스마트 그리드 구축에 자금을 지원하고 있습니다. 독일, 프랑스, 스웨덴의 자동차 OEM 기업들은 Euro NCAP 등급을 획득하기 위해 다중 센서의 이중화 기능을 도입하고 있으며, 이로 인해 광센서에 대한 수요가 촉진되고 있습니다. 라틴아메리카와 아프리카는 여전히 발전 단계에 있지만, 통신 및 에너지 인프라의 현대화에 따라 성장의 계기가 될 것으로 보입니다. 전반적으로, 지역적 분산화로 인해 광센서 시장은 특정 지역에서 발생하는 충격으로부터 보호받고 있습니다.
기타 혜택
- 엑셀 형식 시장 예측(ME) 시트
- 3개월간의 애널리스트 지원
자주 묻는 질문
목차
제1장 서론
제2장 조사 방법
제3장 주요 요약
제4장 시장 구도
제5장 시장 규모 및 성장 예측
제6장 경쟁 구도
제7장 시장 기회 및 향후 전망
AJY 26.08.11According to Mordor Intelligence, the photonic sensors market size is expected to grow from USD 33.01 billion in 2025 to USD 36.68 billion in 2026 and is forecast to reach USD 62.13 billion by 2031 at 11.12% CAGR over 2026-2031.
This report is Segmented by Product Type (Fiber-Optic Sensors, Image Sensors, and More), End-User Industry (Aerospace and Defense, Automotive, Industrial Automation, and More), Application (Structural Health Monitoring, Temperature and Pressure Sensing, and More), Technology (Fiber Bragg Grating, Fabry-perot Interferometry, and More), and Geography. The Market Forecasts are Provided in Terms of Value (USD).
Global Photonic Sensors Market Trends and Insights
Growing Automation Demand in Manufacturing Environments
Industrial facilities deploy photonic sensors where micron-level accuracy and immunity to electromagnetic noise are mission-critical. Paint-thickness checks, weld inspection, and vibration surveillance demonstrate how fiber-optic sensing raises production yields. Predictive-maintenance programs integrate distributed photonic arrays that identify bearing wear before catastrophic failure. Automotive body shops leverage laser displacement sensors for robotic guidance, reducing cycle times. Industry 4.0 adoption amplifies demand for real-time analytics, and photonic sensor longevity offsets initial capital outlays. As factories digitize, the photonic sensors market embeds deeper in control loops that require deterministic data.
Increasing Investment in Fiber-Optic Communication Infrastructure
Telecom carriers roll out distributed fiber-optic sensing to track temperature, strain, and intrusion along thousands of kilometers of network, safeguarding service uptime. Data-center operators integrate photonic temperature arrays inside racks to pinpoint hotspots that electronic probes miss. 5G densification multiplies base-station links and drives uptake of inline optical monitors that report latency and power drift. Smart-grid programs funded by stimulus bills in North America and Europe include fiber-optic fault-detection to curb outage frequency. As capacity upgrades proceed, embedded sensing becomes a default feature, extending the photonic sensors market into carrier-class hardware.
High Initial Implementation Cost
Comprehensive photonic sensor systems cost USD 50,000-200,000 versus USD 10,000-30,000 for electronic counterparts, stretching payback periods for factories and clinics. Small enterprises delay upgrades despite lower maintenance expenses over the product life cycle. Deployment requires specialist installers and training, inflating total cost of ownership. In healthcare, reimbursement schedules lag technology, limiting adoption of biophotonic diagnostics even when clinical benefits are clear. As volume grows and integrated designs mature, unit prices fall, but near-term budgets restrain the photonic sensors market trajectory.
Other drivers and restraints analyzed in the detailed report include:
- Rising Demand for Safety and Security Systems in Smart Cities
- Expansion of Healthcare Diagnostics Leveraging Biophotonic Sensing
- Supply-Chain Bottlenecks in Specialty Optical-Fiber Preforms
For complete list of drivers and restraints, kindly check the Table Of Contents.
Segment Analysis
Image sensors retained a 37.55% share of the photonic sensors market size in 2025 as automotive cameras, industrial line-scan systems, and machine-vision tools required scalable, low-cost optoelectronics. LiDAR platforms, however, record the fastest 12.03% CAGR due to autonomous mobility, warehouse robotics, and smart-infrastructure deployments that need real-time 3D mapping. Solid-state designs have collapsed unit pricing from USD 10,000 in 2020 to under USD 1,000 by 2024, removing a major adoption barrier. Fiber-optic sensors hold niche roles in structural health monitoring where immunity to lightning and electromagnetic interference outweighs cost. Biophotonic sensors gain ground in diagnostics, especially glucose and lactate monitoring for chronic-disease management.
LiDAR vendors integrate beam steering and signal processing on silicon photonic chips, a key innovation within the broader Photonics industry, to shrink enclosure size and curb power draw, which aligns with automotive qualification demands. Image-sensor suppliers exploit CMOS fabrication economies to release high dynamic-range devices for factory inspection lighting extremes. Terahertz imagers address security screening and non-destructive testing, although material absorption and regulatory hurdles cap near-term volume. Quantum-dot detectors promise infrared sensitivity at room temperature, attracting interest for night vision. As each technology matures, cross-pollination occurs: 3D cameras embed structured-light emitters, and LiDAR units incorporate cameras for sensor fusion. This convergence diversifies revenue streams within the photonic sensors market.
Industrial automation owned 29.21% of photonic sensors market share in 2025 because predictive maintenance and quality assurance require continuous, interference-free data. The automotive category advances at an 11.71% CAGR through 2031 as advanced driver-assistance systems add LiDAR, imaging, and infrared arrays for safety redundancy. Aerospace and defense demand remains steady for navigation and threat detection, with ruggedized photonic sensors specified for vibration, radiation, and temperature extremes.
Healthcare accelerates on wearable biosensors and robotic surgery, while energy utilities adopt distributed fiber-optic systems for real-time pipeline and cable-line monitoring. Consumer electronics remain price-sensitive, yet augmented-reality headsets and gesture-control devices open new design-win opportunities. Environmental monitoring agencies deploy photonic gas analyzers that detect pollutants at parts-per-billion levels. Collectively, these trends broaden the photonic sensors industry footprint beyond early industrial roots.
Complete Report Scope:
- By Product Type
- Fiber-Optic Sensors
- Image Sensors
- Biophotonic Sensors
- LiDAR Sensors
- Other Product Types
- By End-User Industry
- Aerospace and Defense
- Automotive
- Industrial Automation
- Healthcare and Life Sciences
- Energy and Power
- Consumer Electronics
- Environmental Monitoring
- Other End-User Industries
- By Application
- Structural Health Monitoring
- Temperature and Pressure Sensing
- Chemical and Biological Sensing
- Position and Displacement Sensing
- Safety and Security
- Imaging and Scanning
- Others
- By Technology
- Fiber Bragg Grating
- Fabry-Perot Interferometry
- Raman and Brillouin Scattering
- Photodiode and CMOS
- Quantum Dots and Nanophotonics
- Terahertz Photonics
- Others
- By Geography
- North America
- United States
- Canada
- Mexico
- South America
- Brazil
- Argentina
- Rest of South America
- Europe
- Germany
- United Kingdom
- France
- Italy
- Spain
- Rest of Europe
- Asia-Pacific
- China
- Japan
- South Korea
- India
- ASEAN
- Rest of Asia-Pacific
- Middle East and Africa
- Middle East
- Saudi Arabia
- United Arab Emirates
- Turkey
- Rest of Middle East
- Africa
- South Africa
- Nigeria
- Rest of Africa
- Middle East
- North America
Geography Analysis
North America accounted for 38.28% of 2025 revenue due to sustained defense procurement, semiconductor fabs, and early autonomous-vehicle pilots that rely on high-performance sensing. Research universities and venture capital ecosystems shorten concept-to-commercial cycles, while reshoring incentives boost demand in chip and battery plants. FDA regulation lengthens medical-device launch timelines but also elevates entry barriers, shielding incumbents in the photonic sensors market.
Asia-Pacific expands at a 12.09% CAGR through 2031 as China, Japan, and South Korea automate factories to offset labor costs and meet export-quality standards. China's Belt and Road projects embed fiber-optic monitoring in pipelines and railways. Japan's aging society adopts photonic diagnostics for home care, while South Korea's semiconductor industry installs airborne-particle detectors with picogram sensitivity. Local governments provide tax breaks for sensor fabs, strengthening regional supply chains.
Europe balances technology exports with strict safety and sustainability mandates. Germany's Industry 4.0 program disseminates intelligent sensing into Mittelstand factories, and EU Green Deal funds smart-grid rollouts that use distributed fiber-optic sensing. Automotive OEMs in Germany, France, and Sweden incorporate multi-sensor redundancy to achieve Euro NCAP ratings, bolstering photonic sensor demand. Latin America and Africa remain nascent but will unlock growth as telecom and energy infrastructure modernize. Overall, regional diversification protects the photonic sensors market from single-region shocks.
- Banner Engineering Corp.
- Baumer Holding AG
- STMicroelectronics N.V.
- Hamamatsu Photonics K.K.
- Omron Corporation
- Sick AG
- Keyence Corporation
- Pepperl+Fuchs SE
- Rockwell Automation, Inc.
- Autonics Corporation
- Teledyne FLIR LLC
- Luna Innovations Incorporated
- Altechna Co. Ltd.
- First Sensor AG
- Micron Technology, Inc.
- Texas Instruments Incorporated
- Excelitas Technologies Corp.
- Thorlabs, Inc.
- Coherent Corp.
- II-VI Incorporated
- Yokogawa Electric Corporation
- Bosch Sensortec GmbH
- TriLumina Corp.
- Leonardo S.p.A.
- Qorvo, Inc.
Additional Benefits:
- The market estimate (ME) sheet in Excel format
- 3 months of analyst support
TABLE OF CONTENTS
1 INTRODUCTION
- 1.1 Study Assumptions and Market Definition
- 1.2 Scope of the Study
2 RESEARCH METHODOLOGY
3 EXECUTIVE SUMMARY
4 MARKET LANDSCAPE
- 4.1 Market Overview
- 4.2 Market Drivers
- 4.2.1 Growing automation demand in manufacturing environments
- 4.2.2 Increasing investment in fiber-optic communication infrastructure
- 4.2.3 Rising demand for safety and security systems in smart cities
- 4.2.4 Expansion of healthcare diagnostics leveraging biophotonic sensing
- 4.2.5 Emergence of photonic integrated circuits enabling on-chip sensing
- 4.2.6 Demand for LiDAR-based perception in warehouse robotics
- 4.3 Market Restraints
- 4.3.1 High initial implementation cost
- 4.3.2 Lack of universal industry standards
- 4.3.3 Supply-chain bottlenecks in specialty optical-fiber preforms
- 4.3.4 Photonic-sensor performance drift under harsh radiation environments
- 4.4 Industry Value Chain Analysis
- 4.5 Regulatory Landscape
- 4.6 Technological Outlook
- 4.7 Porter's Five Forces Analysis
- 4.7.1 Bargaining Power of Suppliers
- 4.7.2 Bargaining Power of Buyers
- 4.7.3 Threat of New Entrants
- 4.7.4 Threat of Substitutes
- 4.7.5 Intensity of Competitive Rivalry
- 4.8 Impact of Macroeconomic Factors
5 MARKET SIZE AND GROWTH FORECASTS (VALUE)
- 5.1 By Product Type
- 5.1.1 Fiber-Optic Sensors
- 5.1.2 Image Sensors
- 5.1.3 Biophotonic Sensors
- 5.1.4 LiDAR Sensors
- 5.1.5 Other Product Types
- 5.2 By End-User Industry
- 5.2.1 Aerospace and Defense
- 5.2.2 Automotive
- 5.2.3 Industrial Automation
- 5.2.4 Healthcare and Life Sciences
- 5.2.5 Energy and Power
- 5.2.6 Consumer Electronics
- 5.2.7 Environmental Monitoring
- 5.2.8 Other End-User Industries
- 5.3 By Application
- 5.3.1 Structural Health Monitoring
- 5.3.2 Temperature and Pressure Sensing
- 5.3.3 Chemical and Biological Sensing
- 5.3.4 Position and Displacement Sensing
- 5.3.5 Safety and Security
- 5.3.6 Imaging and Scanning
- 5.3.7 Others
- 5.4 By Technology
- 5.4.1 Fiber Bragg Grating
- 5.4.2 Fabry-Perot Interferometry
- 5.4.3 Raman and Brillouin Scattering
- 5.4.4 Photodiode and CMOS
- 5.4.5 Quantum Dots and Nanophotonics
- 5.4.6 Terahertz Photonics
- 5.4.7 Others
- 5.5 By Geography
- 5.5.1 North America
- 5.5.1.1 United States
- 5.5.1.2 Canada
- 5.5.1.3 Mexico
- 5.5.2 South America
- 5.5.2.1 Brazil
- 5.5.2.2 Argentina
- 5.5.2.3 Rest of South America
- 5.5.3 Europe
- 5.5.3.1 Germany
- 5.5.3.2 United Kingdom
- 5.5.3.3 France
- 5.5.3.4 Italy
- 5.5.3.5 Spain
- 5.5.3.6 Rest of Europe
- 5.5.4 Asia-Pacific
- 5.5.4.1 China
- 5.5.4.2 Japan
- 5.5.4.3 South Korea
- 5.5.4.4 India
- 5.5.4.5 ASEAN
- 5.5.4.6 Rest of Asia-Pacific
- 5.5.5 Middle East and Africa
- 5.5.5.1 Middle East
- 5.5.5.1.1 Saudi Arabia
- 5.5.5.1.2 United Arab Emirates
- 5.5.5.1.3 Turkey
- 5.5.5.1.4 Rest of Middle East
- 5.5.5.2 Africa
- 5.5.5.2.1 South Africa
- 5.5.5.2.2 Nigeria
- 5.5.5.2.3 Rest of Africa
- 5.5.5.1 Middle East
- 5.5.1 North America
6 COMPETITIVE LANDSCAPE
- 6.1 Market Concentration
- 6.2 Strategic Moves
- 6.3 Market Share Analysis
- 6.4 Company Profiles (includes Global level Overview, Market level overview, Core Segments, Financials as available, Strategic Information, Market Rank/Share for key companies, Products and Services, and Recent Developments)
- 6.4.1 Banner Engineering Corp.
- 6.4.2 Baumer Holding AG
- 6.4.3 STMicroelectronics N.V.
- 6.4.4 Hamamatsu Photonics K.K.
- 6.4.5 Omron Corporation
- 6.4.6 Sick AG
- 6.4.7 Keyence Corporation
- 6.4.8 Pepperl+Fuchs SE
- 6.4.9 Rockwell Automation, Inc.
- 6.4.10 Autonics Corporation
- 6.4.11 Teledyne FLIR LLC
- 6.4.12 Luna Innovations Incorporated
- 6.4.13 Altechna Co. Ltd.
- 6.4.14 First Sensor AG
- 6.4.15 Micron Technology, Inc.
- 6.4.16 Texas Instruments Incorporated
- 6.4.17 Excelitas Technologies Corp.
- 6.4.18 Thorlabs, Inc.
- 6.4.19 Coherent Corp.
- 6.4.20 II-VI Incorporated
- 6.4.21 Yokogawa Electric Corporation
- 6.4.22 Bosch Sensortec GmbH
- 6.4.23 TriLumina Corp.
- 6.4.24 Leonardo S.p.A.
- 6.4.25 Qorvo, Inc.
7 MARKET OPPORTUNITIES AND FUTURE OUTLOOK
- 7.1 White-space and Unmet-Need Assessment