

|
시장보고서
상품코드
2100543
실리콘 메탈 시장 : 점유율 분석, 업계 동향 및 통계, 성장 예측(2026-2031년)Silicon Metal - Market Share Analysis, Industry Trends & Statistics, Growth Forecasts (2026 - 2031) |
||||||
 Mordor Intelligence
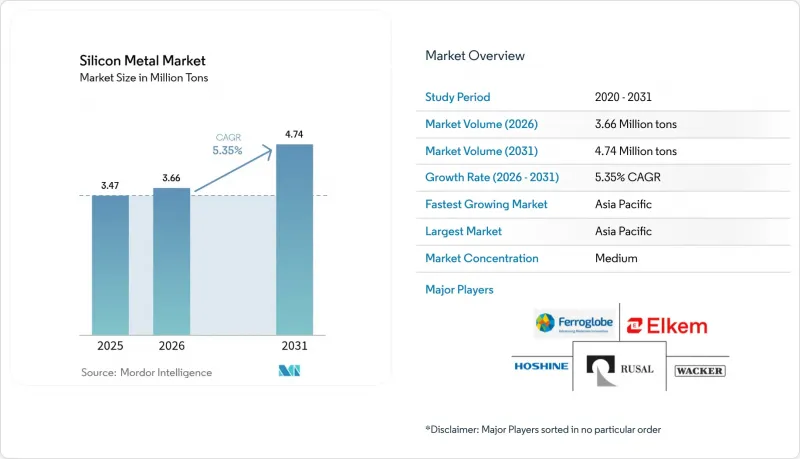
실리콘 메탈 시장 규모는 2026년에 366만 톤으로 추정되고 있어 2025년 347만 톤에서 확대해, 2031년에는 474만 톤에 이를 것으로 예측됩니다.
2026년부터 2031년까지 연평균 성장률(CAGR) 5.35%로 성장할 것으로 전망됩니다.
본 보고서는 제품 유형(야금용 등급 및 화학용 등급), 형태(덩어리, 분말, 과립), 용도(알루미늄 합금, 반도체, 태양광 패널, 실리콘, 기타 용도) 및 지역(아시아태평양, 북미, 유럽, 남미, 중동 및 아프리카)별로 분류되어 있습니다. 시장 전망은 수량(톤) 기준으로 제시되어 있습니다.
세계 실리콘 메탈 시장 동향 및 인사이트
경량 알루미늄 합금 수요 급증(자동차 및 전기차)
자동차 OEM 업체들은 경량 구조를 통해 배터리 팩을 대형화하지 않고도 주행 거리를 연장할 수 있기 때문에 차량 1대당 알루미늄 사용량을 늘리고 있습니다. 테슬라의 ‘기가캐스팅’ 기술 도입을 계기로, 중국의 다른 전기차 스타트업 기업들도 고순도 야금용 실리콘 첨가제가 필요한 대형 알루미늄 차체 부품 제조에 동참하고 있습니다. 미국 및 유럽의 알루미늄 주조 제조업체들은 현지 합금 등급을 확보하기 위해 생산 능력 확대를 발표하고 있으며, 이로 인해 안정적인 실리콘 공급에 대한 수요가 더욱 높아지고 있습니다. 중국의 합금 제조업체들은 규모의 우위를 바탕으로 가격 주도권을 유지하고 있지만, 운임 급등과 관세 장벽으로 인해 태평양 서쪽의 구매자들에게는 그 우위가 일부 약화되고 있습니다. 배터리 케이스가 주철에서 알루미늄으로 전환됨에 따라, 새로운 전기차(EV) 플랫폼이 출시될 때마다 자동차 1차 공급업체의 실리콘 메탈 구매량도 증가하고 있습니다. 따라서 이 요인은 경기 순환의 영향을 쉽게 받는 부문이 변동하더라도 실리콘 메탈 시장의 꾸준한 기본 성장세를 뒷받침하는 기반이 되고 있습니다.
태양광(PV) 설비 용량 증가 가속화
중국은 2024년에 499기가와트의 태양광 모듈을 출하했으며, 2025년에는 580기가와트 이상을 목표로 하고 있습니다. 폴리실리콘공급 과잉으로 인해 중국의 주요 제조업체들은 용광로 가동률을 40% 미만으로 낮출 수밖에 없었지만, 정부의 청정 에너지 정책에 따라 하류 부문의 신규 생산 능력 승인은 계속되고 있습니다. 인도, 브라질, 중동에서는 수입 잉곳에 의존하는 태양광 발전 프로젝트가 가속화되며 전 세계 수요의 폭을 넓히고 있습니다. 폴리실리콘의 이익률은 크게 압박받고 있지만, 봉형 반응로에 사용되는 실리콘 메탈 소비량은 분기별 가격 변동이 아닌 장기적인 설치 곡선에 계속해서 연동되고 있습니다. 모듈 효율이 향상됨에 따라 웨이퍼 제조업체들은 더 고품질의 원료를 사용하여 대응하고 있으며, 이는 간접적으로 화학 등급 실리콘의 순도 요건을 높이고 있습니다. 단기적인 가격 변동이 있더라도, 수년에 걸친 태양광 발전의 확대는 실리콘 메탈 시장 전체에 강력한 긍정적 기여를 뒷받침하고 있습니다.
에너지 비용이 높고 CO2 배출량이 많은 생산
실리콘 메탈 1톤을 생산하는 데 약 12메가와트시의 전력을 소비하기 때문에 제련소는 유럽 및 북미 일부 지역의 변동성이 큰 전기 요금의 영향을 받기 쉽습니다. CO₂ 1톤당 80유로를 초과하는 EU의 탄소 가격은 이미 구이난성(雲南省)이나 쓰촨성(四川省)의 일반적인 계통 연계 요금의 2배를 지불하고 있는 유럽 및 미국 기업들에게 추가적인 부담이 되고 있습니다. 엘켐(Elkem)사가 노르웨이에서 시행하고 있는 용융로 배가스를 회수하여 환원제로 재사용하는 시범 프로젝트는 적극적인 완화책을 보여주는 한편, 막대한 설비 투자를 필요로 합니다. 이러한 저탄소화 업그레이드가 이루어지지 않을 경우, 비용 차이는 톤당 650달러를 초과할 가능성이 있어 지역의 경쟁력을 저해하게 될 것입니다. ESG 정책을 내세우는 구매자들은 보다 환경 친화적인 공급을 선호하는 반면, 고액의 프리미엄을 지불하는 데는 소극적이며, 그 결과 일부 유럽 가공업체들은 관세 위험을 감수하고 아시아산 원자재를 수입하고 있습니다. 이러한 소극적인 태도는 고비용 지역의 확장 계획을 저해하고, 세계 실리콘 메탈 시장의 성장 모멘텀을 둔화시키고 있습니다.
부문 분석
야금용 등급은 2025년 출하량의 60.02%를 차지하며, 자동차 및 항공우주 분야의 견조한 알루미늄 합금 수요를 배경으로 연평균 5.83%의 성장이 예상됩니다. 실리콘 메탈 시장 규모에서 이 비중은 208만 톤을 약간 상회하며, 중국, 미국, 멕시코의 알루미늄 주조 생산량과 거의 연동되어 확대되고 있습니다. 기가캐스팅의 도입으로 대당 합금 잉곳 수요가 증가했으며, 주요 합금 시리즈에는 중량 기준으로 약 7%의 실리콘이 포함되어 있습니다. 아시아의 제련소는 수력 발전과 대형 수중 아크로를 활용하여 저비용 원료를 공급하고 있으며, 다른 지역의 에너지 가격 급등에도 불구하고 실리콘 메탈 시장이 경쟁력 있는 가격을 유지하는 데 기여하고 있습니다. 앞으로 3D 프린팅 알루미늄 구조물의 보급으로 용해량은 소폭 감소하겠지만, 순도 요건이 높아짐에 따라 프리미엄 틈새 시장이 지지를 받을 것으로 전망됩니다.
화학 등급은 나머지 부분을 차지하며, 기술 주기에 따라 변동하는 폴리실리콘, 실리콘 및 반도체 원료의 흐름을 뒷받침하고 있습니다. 2025년에는 폴리실리콘공급 과잉이 판매량을 압박하여 화학 등급 실리콘 메탈 시장 점유율이 소폭 하락했으나, 전자 및 전기차 배터리 공급망에서의 대체 수요가 하락 폭을 억제하고 있습니다. 웨이퍼 공장 및 화학 공장과 연계된 수직 통합 기업들은 자사 소비를 통해 가격 리스크를 헤지하고, 외부 수주가 둔화되었을 때도 이익률을 유지하고 있습니다. 예측 기간 동안 태양광 발전 투자의 완만한 회복과 실리콘 최종 시장의 안정으로 인해 화학용 등급의 연평균 성장률(CAGR)은 4%대를 유지할 것으로 전망됩니다. 이는 야금용 등급보다 낮은 성장률이지만, 실리콘 메탈 시장의 회복력에 있어 필수적인 요소입니다.
지역별 분석
아시아태평양은 2025년 총 생산량의 67.74%를 차지하며, 2031년까지 연평균 성장률(CAGR) 5.78%를 나타낼 것으로 예측되어 실리콘 메탈 업계를 주도하는 지역이 되고 있습니다. 이 지역은 리드타임 단축과 비용 절감을 실현하는 중국의 광산에서 모듈에 이르기까지 통합된 클러스터에 의해 뒷받침되고 있습니다. 구이난성의 수력 발전이 풍부한 전력망은 전기 요금을 낮게 유지하여, 탄소세가 부과되더라도 제련소의 손익분기점을 유지하고 있습니다. 일본과 한국은 최첨단 반도체 및 전기차(EV) 플랫폼을 통해 정제 수요를 견인하고 있습니다. 인도네시아는 실리카의 하류 가공에 457억 4,000만 달러를 투자하며, 중국의 지배력에 대한 헤지 수단이 될 지역적 대안을 모색하고 있습니다.
북미에서는 반덤핑 조사로 인해 수입이 억제되면서 공급 부족이 더욱 심화되었고, 현물 가격이 프리미엄 수준을 기록했습니다. '인플레이션 억제법'의 국내 조달 요건으로 인해 태평양 연안 북서부에서는 새로운 제련로 프로젝트가 촉진되고 있으며, 이 지역에서는 수력 발전으로 에너지 비용의 역풍을 부분적으로 상쇄할 수 있습니다. 캐나다는 ESG 기준을 준수하는 합금을 요구하는 OEM 제조업체를 유치하기 위해 저탄소 전력망을 강점으로 내세우고 있습니다. 유럽도 전기 요금으로 인한 유사한 비용 문제에 직면했으나, 혁신 보조금을 활용해 CO2 배출 제로 공정의 시범 사업을 추진하며, 기술적 차별화를 통해 생산 능력 유지를 도모하고 있습니다.
브라질은 풍부한 규암과 기존의 야금 노하우를 활용하고 있는 반면, 걸프협력회의(GCC) 회원국들은 실리콘 합금화가 필요한 알루미늄 복합 시설에 저렴한 천연가스와 태양광 발전을 공급하고 있습니다. 아프리카는 일조량이 많은 지역의 태양광 발전 설비 확충에 주력하고 있으며, 향후 폴리실리콘 관련 수요가 확대될 것으로 기대됩니다. 이러한 다양한 상황은 지역별 에너지 경제 및 정책 체계가 실리콘 메탈 시장의 지리적 변화를 어떻게 좌우하고 있는지를 여실히 보여주고 있습니다.
기타 혜택:
- 엑셀 형식 시장 예측(ME) 시트
- 3개월간의 애널리스트 지원
자주 묻는 질문
목차
제1장 서론
제2장 조사 방법
제3장 주요 요약
제4장 시장 구도
제5장 시장 규모와 성장 예측
제6장 경쟁 구도
제7장 시장 기회와 향후 전망
JHS 26.08.11According to Mordor Intelligence, silicon metal market size in 2026 is estimated at 3.66 million tons, growing from 2025 value of 3.47 million tons with 2031 projections showing 4.74 million tons, growing at 5.35% CAGR over 2026-2031.
This report is Segmented by Product Type (Metallurgy Grade and Chemical Grade), Form (Lump, Powder, and Granules), Application (Aluminum Alloys, Semiconductors, Solar Panels, Silicones, and Other Applications), and Geography (Asia-Pacific, North America, Europe, South America, and Middle-East and Africa). The Market Forecasts are Provided in Terms of Volume (Tons).
Global Silicon Metal Market Trends and Insights
Lightweight Al-Alloy Demand Boom (Automotive and EV)
Automotive OEMs are raising aluminum content per vehicle because lighter structures extend driving range without enlarging battery packs. Tesla's gigacasting adoption spurred other EV start-ups in China to replicate large aluminum body sections that need high-purity metallurgy-grade silicon additives. Aluminum foundries in the United States and Europe have announced capacity expansions that secure local alloy grades yet intensify demand for stable silicon inputs. Chinese alloy producers keep price leadership thanks to scale, though higher freight and tariff barriers erode some of that edge for buyers west of the Pacific. As more battery enclosures move from cast iron to aluminum, silicon metal purchases from automotive tier-ones rise in tandem with every new EV platform rollout. The driver therefore underpins steady baseline growth in the silicon metal market even when cyclical sectors fluctuate.
Solar-PV Capacity Additions Accelerating
China shipped 499 gigawatts of PV modules in 2024 and targets more than 580 gigawatts in 2025. Polysilicon oversupply forced leading Chinese producers to cut furnace utilization below 40% yet the government's clean-energy mandate keeps greenlighting new downstream capacity. India, Brazil, and the Middle East accelerate solar flotillas that lean on imported ingots, adding breadth to global demand. Although polysilicon margins compressed severely, silicon metal consumption for rod reactors remains tied to long-term installation curves, not quarterly price swings. As modules become more efficient, wafer makers compensate by using higher quality feedstock, indirectly lifting purity requirements for chemical-grade silicon. Even with short-term volatility, the multi-year solar buildout reinforces a strong positive contribution to the overall silicon metal market.
High Energy-Cost and CO2-Intensive Production
Producing 1 ton of silicon metal consumes near 12 megawatt-hours of electricity, exposing smelters to volatile power tariffs across Europe and parts of North America. EU carbon prices above EUR 80 per ton CO2 further burden Western players that already pay twice the grid rates typical in Yunnan or Sichuan. Elkem's Norwegian pilot to capture furnace off-gas and recycle it as a reductant demonstrates proactive mitigation yet demands heavy capex. Absent such low-carbon upgrades, cost gaps can exceed USD 650 per ton, eroding regional competitiveness. Buyers with ESG mandates favor greener supply but balk at paying steep premiums, leading some European fabricators to import Asian material despite tariff exposure. The restraint suppresses expansion plans in high-cost geographies and drags on the global silicon metal market growth momentum.
Other drivers and restraints analyzed in the detailed report include:
- Expanding Global Silicones Capacity
- Semiconductor Content Growth per Device
- Forced-Labor Trade Restrictions Risk
For complete list of drivers and restraints, kindly check the Table Of Contents.
Segment Analysis
Metallurgy grade contributed 60.02% to 2025 shipments and is forecast to grow 5.83% annually on the back of sturdy aluminum alloy demand in automotive and aerospace. This portion of the silicon metal market size equated to just over 2.08 million tons and scales in near lockstep with aluminum casting output in China, the United States, and Mexico. Gigacasting adoption multiplies alloy ingot pull per vehicle, embedding silicon at roughly 7% weight in key alloy series. Asian smelters leverage hydro-power and large submerged-arc furnaces to deliver low-cost feedstock, helping the silicon metal market maintain competitive pricing despite energy hikes elsewhere. Looking ahead, 3D-printed aluminum structures could modestly reduce melt volumes yet raise purity requirements, supporting premium niches.
Chemical grade covers the balance and supports polysilicon, silicones, and semiconductor raw material flows that swing with technology cycles. Silicon metal market share for chemical grade fell marginally in 2025 as polysilicon oversupply pressed volumes, but replacement demand from electronics and EV battery supply chains caps the downside. Vertical integrators aligned with wafer and chemical plants hedge price risk by self-consuming, shielding margins when external orders soften. Over the forecast, modest recovery in solar investment and stable silicones end-markets keeps chemical-grade CAGR in the 4% zone, slower than metallurgy yet integral to the silicon metal market's resilience.
Complete Report Scope:
- By Product Type
- Metallurgy Grade
- Chemical Grade
- By Form
- Lump
- Powder
- Granules
- By Application
- Aluminum Alloys
- Semiconductors
- Solar Panels
- Silicones
- Other Applications
- By Geography
- Asia-Pacific
- China
- India
- Japan
- South Korea
- Malaysia
- Thailand
- Indonesia
- Vietnam
- Rest of Asia-Pacific
- North America
- United States
- Canada
- Mexico
- Europe
- Germany
- United Kingdom
- France
- Italy
- Spain
- Turkey
- Russia
- Nordic Countries
- Rest of Europe
- South America
- Brazil
- Argentina
- Colombia
- Rest of South America
- Middle-East and Africa
- Saudi Arabia
- United Arab Emirates
- Qatar
- Egypt
- Nigeria
- South Africa
- Rest of Middle-East and Africa
- Asia-Pacific
Geography Analysis
Asia-Pacific delivered 67.74% of 2025 tonnage and is tracking a 5.78% CAGR to 2031, making it the leading region in the silicon metal industry. The region is supported by China's integrated mine-to-module clusters that shorten lead times and compress cost. Yunnan's hydro-rich grid lowers power tariffs, maintaining smelter breakevens even with carbon fees. Japan and South Korea add refined demand via cutting-edge semiconductors and EV platforms. Indonesia channels USD 45.74 billion into silica downstreaming to hatch regional alternatives that hedge against Chinese dominance.
North America logged premium spot prices as antidumping probes steered imports away, magnifying supply tightness. The Inflation Reduction Act's domestic content rules encourage fresh furnace projects in the Pacific Northwest, where hydro-power can partially neutralize energy cost headwinds. Canada positions its low-carbon grid as a magnet for OEMs seeking ESG-compliant alloys. Europe faced similar cost challenges with electricity tariffs, yet, embraced innovation grants to advance CO2-free process pilots, keeping capacity viable through technology differentiation.
Brazil leverages abundant quartzite and existing metallurgical know-how, while Gulf Cooperation Council members channel cheap natural gas and solar power into aluminum complexes that require silicon alloying. Africa focuses on solar-PV buildouts in high-insolation corridors, promising a future lift in polysilicon-related demand. The mosaic underscores how regional energy economics and policy filters govern the silicon metal market's evolving geography.
- Anyang Huatuo Metallurgy Co., Ltd.
- Dow
- East Hope Group
- Elkem ASA
- Ferroglobe
- Hoshine Silicon Industry Co., Ltd.
- LIASA
- Minasligas
- Mississippi Silicon
- PCC SE
- RIMA Industrial
- Rusal
- RW silicium GmbH
- Shin-Etsu Chemical Co., Ltd.
- Wacker Chemie AG
Additional Benefits:
- The market estimate (ME) sheet in Excel format
- 3 months of analyst support
TABLE OF CONTENTS
1 Introduction
- 1.1 Study Assumptions and Market Definition
- 1.2 Scope of the Study
2 Research Methodology
3 Executive Summary
4 Market Landscape
- 4.1 Market Overview
- 4.2 Market Drivers
- 4.2.1 Lightweight-Al Alloy Demand Boom (Automotive and EV)
- 4.2.2 Solar-PV Capacity Additions Accelerating
- 4.2.3 Expanding Global Silicones Capacity
- 4.2.4 Semiconductor Content Growth per Device
- 4.2.5 Silicon-Anode Batteries Commercialising
- 4.3 Market Restraints
- 4.3.1 High Energy-Cost and CO2-Intensive Production
- 4.3.2 China-Centric Supply-Chain Price Volatility
- 4.3.3 Forced-Labour Trade Restrictions Risk
- 4.4 Value Chain Analysis
- 4.5 Porter's Five Forces
- 4.5.1 Bargaining Power of Suppliers
- 4.5.2 Bargaining Power of Buyers
- 4.5.3 Threat of New Entrants
- 4.5.4 Threat of Substitutes
- 4.5.5 Degree of Competition
5 Market Size and Growth Forecasts (Volume)
- 5.1 By Product Type
- 5.1.1 Metallurgy Grade
- 5.1.2 Chemical Grade
- 5.2 By Form
- 5.2.1 Lump
- 5.2.2 Powder
- 5.2.3 Granules
- 5.3 By Application
- 5.3.1 Aluminum Alloys
- 5.3.2 Semiconductors
- 5.3.3 Solar Panels
- 5.3.4 Silicones
- 5.3.5 Other Applications
- 5.4 By Geography
- 5.4.1 Asia-Pacific
- 5.4.1.1 China
- 5.4.1.2 India
- 5.4.1.3 Japan
- 5.4.1.4 South Korea
- 5.4.1.5 Malaysia
- 5.4.1.6 Thailand
- 5.4.1.7 Indonesia
- 5.4.1.8 Vietnam
- 5.4.1.9 Rest of Asia-Pacific
- 5.4.2 North America
- 5.4.2.1 United States
- 5.4.2.2 Canada
- 5.4.2.3 Mexico
- 5.4.3 Europe
- 5.4.3.1 Germany
- 5.4.3.2 United Kingdom
- 5.4.3.3 France
- 5.4.3.4 Italy
- 5.4.3.5 Spain
- 5.4.3.6 Turkey
- 5.4.3.7 Russia
- 5.4.3.8 Nordic Countries
- 5.4.3.9 Rest of Europe
- 5.4.4 South America
- 5.4.4.1 Brazil
- 5.4.4.2 Argentina
- 5.4.4.3 Colombia
- 5.4.4.4 Rest of South America
- 5.4.5 Middle-East and Africa
- 5.4.5.1 Saudi Arabia
- 5.4.5.2 United Arab Emirates
- 5.4.5.3 Qatar
- 5.4.5.4 Egypt
- 5.4.5.5 Nigeria
- 5.4.5.6 South Africa
- 5.4.5.7 Rest of Middle-East and Africa
- 5.4.1 Asia-Pacific
6 Competitive Landscape
- 6.1 Market Concentration
- 6.2 Strategic Moves
- 6.3 Market Share (%)/Ranking Analysis
- 6.4 Company Profiles (includes Global Level Overview, Market Level Overview, Core Segments, Financials as available, Strategic Information, Market Rank/Share, Products and Services, Recent Developments)
- 6.4.1 Anyang Huatuo Metallurgy Co., Ltd.
- 6.4.2 Dow
- 6.4.3 East Hope Group
- 6.4.4 Elkem ASA
- 6.4.5 Ferroglobe
- 6.4.6 Hoshine Silicon Industry Co., Ltd.
- 6.4.7 LIASA
- 6.4.8 Minasligas
- 6.4.9 Mississippi Silicon
- 6.4.10 PCC SE
- 6.4.11 RIMA Industrial
- 6.4.12 Rusal
- 6.4.13 RW silicium GmbH
- 6.4.14 Shin-Etsu Chemical Co., Ltd.
- 6.4.15 Wacker Chemie AG
7 Market Opportunities and Future Outlook
- 7.1 White-Space and Unmet-Need Assessment


