

|
시장보고서
상품코드
2100597
전기차 파워트레인 시장 : 점유율 분석, 업계 동향 및 통계, 성장 예측(2026-2031년)Electric Vehicle Powertrain - Market Share Analysis, Industry Trends & Statistics, Growth Forecasts (2026 - 2031) |
||||||
 Mordor Intelligence
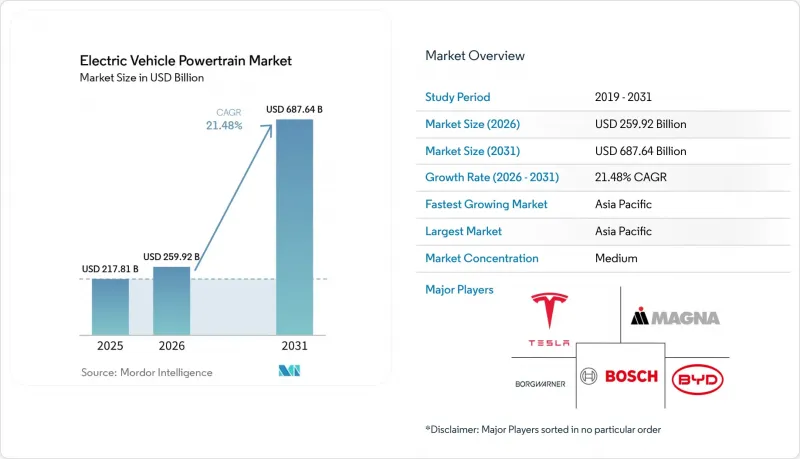
전기차 파워트레인 시장 규모는 2025년에 2,178억 1,000만 달러로 평가되었고 2026년 2,599억 2,000만 달러에서 2031년까지 6,876억 4,000만 달러에 이를 것으로 예측되며, 예측 기간(2026-2031년) CAGR은 21.48%를 나타낼 전망입니다.
본 보고서는 구성 부품(배터리, 모터, 변속기 등), 구동 방식(배터리식 전기차(BEV) 등), 차량 등급(승용차, 소형 상용차 등), 전압 아키텍처(800V 이하 시스템 등), 판매 채널(OEM 순정 파워트레인 등), 지역별로 분류되어 있습니다. 시장 전망은 금액(달러) 기준으로 제시되어 있습니다.
전 세계 전기차 파워트레인 시장 동향 및 인사이트
전 세계 전기차 판매 대수의 급증
세계 배터리식 전기차 및 플러그인 하이브리드 차량의 등록 대수가 크게 증가하고 있으며, 이에 따라 Tier 1 공급업체들은 내연기관과 생산 공간을 공유하는 대신 전용 e-드라이브 생산 라인을 구축하고 있습니다. 중국은 주요 시장으로 부상하고 있으며, 자동차 제조업체들은 소비자의 총 소유 비용을 절감하기 위해 배터리 교체 서비스 및 무료 충전 서비스를 제공합니다. 유럽에서는 물류 사업자들이 도시 지역의 저배출 구역 규제를 준수하기 위해 전기 밴을 빠르게 도입하고 있습니다. 북미에서는 픽업 트럭과 스포츠 유틸리티 차량(SUV)에 대한 관심이 높아짐에 따라, 차량 1대당 파워트레인의 부가가치가 상승하고 있습니다. 수요 증가에 따라 개정된 무역 규정에 의해 완제품 e-액슬의 국경 간 운송에 관세가 부과되게 되면서, 공급업체들은 사업의 현지화를 서두르고 있습니다.
엄격한 배기가스 규제 및 제로 배출 차량 규제
2025년 중반부터 유로 7 기준에 따라 질소산화물 배출 제한이 더욱 엄격해지고, 제동 미립자 물질에 대한 새로운 기준치가 설정됩니다. 이러한 변화는 소형 배터리를 탑재한 플러그인 하이브리드 차량의 생존 가능성에 과제를 안겨주고 있습니다. 캘리포니아주의 ‘Advanced Clean Cars II’는 2030년까지 제로 배출 차량(ZEV) 보급률을 68%로 높일 것을 의무화하고 있으며, 이 목표는 이미 미국 11개 주에서 채택되었습니다. 중국에서는 듀얼 크레딧 제도를 통해 주행 거리가 긴 배터리 전기차(BEV)가 장려되며, 차종 평균 연비가 기준에 미달하는 차량에는 벌금이 부과됩니다. 이 제도로 인해 OEM은 고에너지 밀도 배터리 화학 시스템으로의 전환을 강요받고 있습니다. 또한, 크레딧 거래 제도를 통해 제조업체는 규제를 준수하는 지역에서 잉여 전기차를 생산할 수 있게 됩니다. 그리고 이러한 크레딧을 경쟁사에 매각할 수 있어, 최종 조립 거점 근처에 전기 구동 시스템 공장이 집적되는 추세를 더욱 강화하고 있습니다.
신흥 시장의 공공 DC 급속 충전 인프라 부족
인도에서는 공공 충전소의 수가 제한적이어서 차량 대 충전기 비율이 현저히 높아지며, 주행 거리에 대한 불안감이 커지고 있습니다. 브라질에서는 충전 인프라가 소수의 대도시권에 집중되어 있어, 도시 간을 연결하는 간선 도로변에서는 서비스가 미흡합니다. 태국에서는 고속도로변의 직류 충전기에 대해 상당수가 승인되었으나, 인허가 지연으로 인해 실제로 가동 중인 것은 극히 일부에 그치고 있습니다. 충전 네트워크의 부족은 잔존 가치를 저하시키고 있으며, 이러한 시장에서는 중고 배터리식 전기차(BEV)가 내연기관 차량에 비해 현저히 저렴한 가격에 거래되고 있습니다. 각국 정부는 전기차 보급과 충전 인프라 이용 사이의 지속적인 교착 상태를 해소하기 위해 보조금 및 규제 조치를 통해 개입하고 있습니다.
부문 분석
2026년부터 2031년까지 실리콘 카바이드(SiC) 인버터 및 통합형 컨버터가 800볼트 플랫폼의 표준 사양으로 채택됨에 따라, 파워 일렉트로닉스 매출액은 연평균 성장률(CAGR) 29.42%를 나타낼 것으로 예측됩니다. 2025년 기준, 배터리 팩은 전기차 파워트레인 시장 규모의 38.32%를 차지했습니다. 그러나 중국의 배터리 셀 공급 과잉으로 인한 가격 압박으로 인해, 각 OEM 업체들은 배터리 팩을 상품화하면서 독자적인 배터리 관리 소프트웨어를 통해 경쟁 우위를 추구하고 있습니다.
전기 모터는 부품 지출의 대부분을 차지하고 있으며, 토크 밀도 측면에서는 영구자석식이 주류를 이루고 있습니다. 싱글 스피드 e-액슬 시스템이 두드러진 점유율을 차지하는 반면, 틈새 시장인 멀티 기어 유닛은 높은 등판 능력이 필요한 대형 트럭에 대응하도록 설계되었습니다. 열 루프는 냉매 히트 펌프 시스템으로 진화하고 있으며, 한랭 지역에서의 주행 거리 감소를 부분적으로 보완하는 데 기여하고 있습니다. 고전압 배선, 컨트롤러, 양방향 차량용 충전기가 구성 요소를 보완하고 있으며, OEM의 수직 통합으로 인해 기존에는 Tier 1 공급업체가 확보하던 이익률이 잠식되고 있습니다.
배터리식 전기차는 2025년 매출의 71.24%를 차지하며, 2031년까지 연평균 성장률(CAGR) 24.80%로 성장할 것으로 전망됩니다. 전기 요금이 0.15달러/kWh 미만인 지역에서는 내연기관 차량과의 총 소유 비용(TCO) 격차가 줄어들 것으로 전망됩니다. 플러그인 하이브리드 차량의 경우, 유로 7 실주행 시험을 통해 실험실과 실주행 시의 배출량 차이가 명확해지면, 규제상 크레딧 및 소비자에 대한 매력도가 떨어져 수익성이 저하될 전망입니다.
한때는 틈새 기술에 불과했던 연료전지 파워트레인은 수소 급속 충전이라는 장점을 살려, 현재는 주로 대형 차량 플릿에 채택되고 있습니다. 주요 제조업체들이 개발한 고에너지 밀도 배터리 팩의 도입으로 장거리 주행이 가능한 BEV(배터리식 전기차)가 부상하면서, 복잡한 구조를 가진 PHEV의 필요성은 점차 줄어들고 있습니다. 오프로드용 장비나 충전 인프라가 제한적인 일부 지역에서는 여전히 PHEV의 가치가 인정되고 있지만, 배터리 화학 기술의 지속적인 발전으로 인해 그 우위는 꾸준히 낮아지고 있습니다.
지역별 분석
아시아태평양은 2025년에 전기차 파워트레인 시장의 57.66%를 차지하며, 2031년까지 연평균 성장률(CAGR) 26.64%로 성장할 것으로 전망됩니다. 리튬 정제부터 최종 조립에 이르기까지를 아우르는 중국의 종합적인 생태계는 이 나라의 비용 측면에서의 우위를 확고히 하고 있습니다. 대조적으로, 인도의 생산 연계형 인센티브 제도는 보조금 수령에 막대한 국내 부가가치를 의무화하고 있어, 부지 확보에 다소 지연이 있기는 하지만 계획된 배터리 생산 능력 확립을 뒷받침하고 있습니다. 한편, 일본과 한국은 내연기관에서 전동 구동 부품으로 주력 분야를 전환하고 있습니다. 특히 LG에너지솔루션의 오창 공장에서는 주로 유럽 시장을 겨냥한 계약을 목표로 파우치형 배터리를 생산하고 있습니다. 동시에 니덱은 트랙션 모터 출하에 성공했습니다. 동남아시아는 급성장 중인 허브로서의 위상을 확립해 가고 있습니다. 태국에서는 상당한 현지 조달률을 달성한 프로젝트에 대해 면세 조치를 제공하고 있으며, 베트남의 VinFast는 북미로의 수출 출하를 시작했습니다.
유럽은 파워트레인 매출에서 큰 점유율을 차지하고 있습니다. '유럽 공동 중요 프로젝트(IPC)' 이니셔티브는 기가팩토리를 위해 막대한 자금을 배정하고 있습니다. 이 자금은 노스볼트, ACC, CATL을 뒷받침하여 향후 몇 년 동안 이 3개사에 총 생산 능력을 제공할 전망입니다. 그러나 독일의 유서 깊은 자동차 제조업체들은 각 공장의 막대한 설비 갱신 비용으로 어려움을 겪고 있습니다. 한편, 영국의 어드밴스드 프로펄션 센터(Advanced Propulsion Centre)는 희토류 자석에 대한 의존도를 낮추기 위해 실리콘 카바이드 연구 개발에 투자하고 있습니다. 스페인과 이탈리아는 경쟁력 있는 인건비에 힘입어 배터리 조립 프로젝트의 거점으로 부상하고 있습니다. 또한, 로테르담 항은 중국산 전기차와 리튬 수입을 모두 처리함으로써 재수출 물류에서 매우 중요한 역할을 수행하고 있습니다.
북미는 전 세계 매출에서 상당한 점유율을 차지하고 있습니다. ‘인플레이션 억제법’ 제45X조는 셀 크레딧을 제공하는 획기적인 조치이며, 이러한 인센티브를 통해 배터리 및 전기 구동 시스템에 대한 막대한 투자가 촉진되고 있습니다. 미국에서는 새로 발표된 기가팩토리가 연간 생산량의 대폭적인 확대를 야심차게 목표로 하고 있습니다. 한편, 캐나다에서는 주 정부의 보조금을 통해 주목할 만한 생산 능력을 확보해 나가고 있습니다. 멕시코는 USMCA(미국·멕시코·캐나다 협정)의 규정을 활용하여 BMW와 테슬라의 신규 공장 설립을 촉진함으로써, 관세 없이 미국 시장에 공급할 수 있는 체제를 갖추고 있습니다. 대조적으로, 남미, 중동 및 아프리카의 합계 시장 점유율은 비교적 작은 임베디드니다. 이 지역에서의 주목할 만한 점으로는 브라질에서의 판매 급증, 사우디아라비아의 루시드(Lucid) 공장 지원, 그리고 광산 환기 비용 절감을 목적으로 한 남아프리카공화국에서의 배터리식 운반 트럭 시범 운용 등을 들 수 있습니다.
기타 혜택:
- 엑셀 형식 시장 예측(ME) 시트
- 3개월간의 애널리스트 지원
자주 묻는 질문
목차
제1장 서론
제2장 조사 방법
제3장 주요 요약
제4장 시장 구도
제5장 시장 규모와 성장 예측
제6장 경쟁 구도
제7장 시장 기회와 향후 전망
JHS 26.08.11According to Mordor Intelligence, the electric vehicle powertrain market size was valued at USD 217.81 billion in 2025 and estimated to grow from USD 259.92 billion in 2026 to reach USD 687.64 billion by 2031, at a CAGR of 21.48% during the forecast period (2026-2031).
This report is Segmented by Component (Battery Motors, Transmission, and More), Propulsion Type (Battery Electric Vehicle (BEV) and More), Vehicle Class (Passenger Cars, Light Commercial Vehicles, and More), Voltage Architecture (Less Than Equal To 800 V Systems and More), Sales Channel (OEM-Fitted Powertrains and More) and Geography. The Market Forecasts are Provided in Terms of Value (USD).
Global Electric Vehicle Powertrain Market Trends and Insights
Surging Global Electric Vehicle Sales Volumes
Global registrations of battery-electric and plug-in hybrid vehicles have increased significantly, prompting Tier-1 suppliers to establish dedicated e-drive lines instead of sharing production space with combustion engines. China has emerged as a dominant market, with automakers offering battery-swap services and complimentary charging to lower the total cost of ownership for consumers. In Europe, logistics providers have rapidly adopted electric vans to comply with urban low-emission zone regulations. In North America, the focus on pickups and sport utility vehicles has driven up the powertrain content value per vehicle. The growing demand is pressuring suppliers to localize operations, as revised trade rules now impose tariffs on cross-border shipments of complete e-axles..
Stringent Tail-Pipe and Zero-Emission Vehicle Regulations
Starting mid-2025, Euro 7 standards will impose stricter nitrogen-oxide limits and set new brake-particulate thresholds. These changes challenge the viability of small-battery plug-in hybrids . California's Advanced Clean Cars II mandates a 68% penetration of zero-emission vehicles (ZEVs) by 2030, a target already embraced by 11 states across the United States. In China, a dual-credit system incentivizes longer-range battery electric vehicles (BEVs) and penalizes those with subpar fleet-average fuel economies. This system steers original equipment manufacturers (OEMs) towards high-energy-density chemistries. Additionally, tradable-credit programs empower manufacturers to produce excess electric vehicles in regions where they comply with regulations. They can then sell these credits to competitors, further solidifying the trend of clustering e-drive plants close to final assembly hubs.
Public DC-Fast-Charging Gap in Emerging Markets
India operates a limited number of public charging points, resulting in a significant vehicle-to-charger ratio that heightens range anxiety. In Brazil, charging infrastructure is heavily concentrated in a few metropolitan areas, leaving inter-city corridors underserved. Thailand approved a substantial number of highway DC chargers, but only a fraction became operational due to delays in permitting. Sparse networks hurt residual values, with used battery electric vehicles (BEVs) trading at notable discounts compared to combustion models in these markets. Governments are intervening with subsidies and mandates to address the ongoing stalemate between the adoption of electric vehicles and the utilization of charging infrastructure.
Other drivers and restraints analyzed in the detailed report include:
- Rapid Cost Decline in High-Nickel Battery Chemistries
- OEM Shift to 800-Volt Architectures
- Critical-Mineral Supply Volatility
For complete list of drivers and restraints, kindly check the Table Of Contents.
Segment Analysis
Power electronics revenue is forecast to post a 29.42% CAGR between 2026 and 2031 as silicon-carbide inverters and integrated converters become standard on 800-volt platforms. Battery packs held a 38.32% share of the electric vehicle powertrain market size in 2025; however, price pressure from Chinese cell oversupply is driving OEMs to treat packs as commoditized, while seeking a competitive edge through proprietary battery-management software.
Electric motors account for a significant portion of component expenditure, with permanent-magnet designs leading in terms of torque density. Single-speed e-axle systems hold a notable share, while niche multigear units are designed to support heavy trucks requiring enhanced gradeability. Thermal loops are evolving into refrigerant heat-pump systems, which help recover a portion of cold-weather range losses. High-voltage wiring, controllers, and bidirectional on-board chargers complete the mix, as OEM vertical integration captures margins previously held by Tier-1 suppliers.
Battery electric vehicles generated 71.24% of 2025 revenue and are projected to grow at a 24.80% CAGR through 2031, narrowing the total-cost-of-ownership gap with combustion variants in regions where electricity prices remain below USD 0.15/kWh. Plug-in hybrids face diminishing returns once Euro 7 real-world testing exposes the gaps between laboratory and road emissions, eroding regulatory credits and consumer appeal.
Fuel-cell powertrains, once a niche technology, are now primarily adopted by heavy-duty fleets, capitalizing on hydrogen's rapid refueling advantage. With the introduction of high-energy-density packs, such as those developed by leading manufacturers, long-range BEVs are overshadowing the need for the complexities of PHEVs. While off-highway equipment and certain regions with limited charging infrastructure still find value in PHEVs, ongoing advancements in chemistry are steadily diminishing that advantage.
Complete Report Scope:
- By Component
- Electric Motors
- Permanent-Magnet Synchronous
- Induction
- Switched-Reluctance
- Transmission / e-Axle Systems
- Single-Speed
- Multi-Speed
- Power Electronics
- Inverters
- DC-DC Converters
- On-Board Chargers
- Battery Pack
- Thermal Management Systems
- High-Voltage Cabling & Controllers
- Electric Motors
- By Propulsion Type
- Battery Electric Vehicle (BEV)
- Plug-in Hybrid Electric Vehicle (PHEV)
- Fuel-Cell Electric Vehicle (FCEV)
- By Vehicle Class
- Passenger Cars
- Light Commercial Vehicles
- Heavy Commercial Vehicles
- Two and Three-Wheelers
- Off-Highway Vehicles
- By Voltage Architecture
- Less than equal to 400 V Systems
- 800 V Systems
- Above 800 V Systems
- By Sales Channel
- OEM-Fitted Powertrains
- Aftermarket Retrofit Kits
- By Geography
- North America
- United States
- Canada
- Rest of North America
- South America
- Brazil
- Argentina
- Rest of South America
- Europe
- Germany
- United Kingdom
- France
- Italy
- Spain
- Netherlands
- Rest of Europe
- Asia-Pacific
- China
- Japan
- India
- South Korea
- Thailand
- Vietnam
- Rest of Asia-Pacific
- Middle East and Africa
- Saudi Arabia
- United Arab Emirates
- Turkey
- South Africa
- Egypt
- Rest of Middle East and Africa
- North America
Geography Analysis
Asia-Pacific commanded 57.66% of the electric vehicle powertrain market in 2025 and is projected to grow at a 26.64% CAGR through 2031. China's comprehensive ecosystem, spanning from lithium refining to final assembly, solidifies its cost leadership. In contrast, India's production-linked incentive program, which mandates a significant domestic value addition for subsidies, has catalyzed the establishment of planned cell capacity, albeit with some delays in land acquisition. Meanwhile, Japan and South Korea are shifting their focus from combustion engines to e-drive components. Notably, LG Energy Solution's Ochang plant has produced pouch cells, primarily targeting European contracts. Concurrently, Nidec has successfully shipped traction motors. Southeast Asia is positioning itself as a burgeoning hub: Thailand is offering tax holidays for projects that achieve a substantial local content, and Vietnam's VinFast has commenced export shipments to North America.
Europe contributes a significant share of powertrain revenue. The Important Projects of Common European Interest initiative has allocated substantial funding towards gigafactories. This funding is set to bolster Northvolt, ACC, and CATL, granting them a combined capacity in the years to come. However, Germany's established OEMs are grappling with hefty retooling costs for each plant. On another front, the United Kingdom's Advanced Propulsion Centre is investing in silicon-carbide research and development, aiming to reduce its reliance on rare-earth magnets. Spain and Italy are emerging as hotspots for battery assembly projects, lured by their competitive labor costs. Additionally, the Port of Rotterdam is playing a pivotal role in re-export logistics, handling both Chinese-made electric vehicles and lithium imports.
North America accounts for a notable share of global revenue. The Inflation Reduction Act's Section 45X is a game-changer, offering cell credits. This incentive has spurred significant investments in batteries and electric drives. In the United States, newly announced gigafactories are ambitiously targeting substantial annual output. Meanwhile, Canada is securing a notable capacity, thanks to provincial subsidies. Mexico is capitalizing on USMCA regulations, facilitating the establishment of new plants by BMW and Tesla, ensuring they can serve the United States market without tariffs. In contrast, South America, the Middle East, and Africa collectively account for a smaller market share. Highlights from these regions include Brazil witnessing a surge in sales, Saudi Arabia's commitment to Lucid's plant, and South Africa's trials with battery-electric haul trucks, aiming to reduce mine ventilation costs.
- Tesla, Inc.
- BYD Co. Ltd.
- Bosch Mobility (Robert Bosch GmbH)
- Magna International Inc.
- BorgWarner Inc.
- ZF Friedrichshafen AG
- Dana Incorporated
- GKN Automotive
- Hitachi Astemo, Ltd.
- Mitsubishi Electric Corporation
- AVL List GmbH
- Cummins Inc.
- Siemens AG (eMobility)
- Nidec Corporation
- Continental AG
- Valeo SA
- Vitesco Technologies Group AG
- AISIN Corporation
- Denso Corporation
- Schaeffler AG
- Hyundai Mobis Co., Ltd.
Additional Benefits:
- The market estimate (ME) sheet in Excel format
- 3 months of analyst support
TABLE OF CONTENTS
1 Introduction
- 1.1 Study Assumptions and Market Definition
- 1.2 Scope of the Study
2 Research Methodology
3 Executive Summary
4 Market Landscape
- 4.1 Market Overview
- 4.2 Market Drivers
- 4.2.1 Surging Global Electric Vehicle Sales Volumes
- 4.2.2 Stringent Tail-pipe and Zero-Emission Vehicle (ZEV) Regulations
- 4.2.3 Rapid Cost Decline in High-nickel Battery Chemistries
- 4.2.4 Original Equipment Manufacturer (OEM) Shift to 800-volt Architectures
- 4.2.5 Localization Incentives for E-drive Manufacturing
- 4.2.6 Tier-1 Vertical Integration of E-Axle Bundles
- 4.3 Market Restraints
- 4.3.1 Public DC-fast-charging Gap in Emerging Markets
- 4.3.2 Critical-mineral Supply Volatility
- 4.3.3 Thermal-runaway Safety and Warranty-cost Exposure
- 4.3.4 High-voltage Talent Shortage in Manufacturing Hubs
- 4.4 Value / Supply-Chain Analysis
- 4.5 Regulatory Landscape
- 4.6 Technological Outlook
- 4.7 Porter's Five Forces
- 4.7.1 Threat of New Entrants
- 4.7.2 Bargaining Power of Buyers
- 4.7.3 Bargaining Power of Suppliers
- 4.7.4 Threat of Substitutes
- 4.7.5 Intensity of Competitive Rivalry
5 Market Size and Growth Forecasts (Value in USD)
- 5.1 By Component
- 5.1.1 Electric Motors
- 5.1.1.1 Permanent-Magnet Synchronous
- 5.1.1.2 Induction
- 5.1.1.3 Switched-Reluctance
- 5.1.2 Transmission / e-Axle Systems
- 5.1.2.1 Single-Speed
- 5.1.2.2 Multi-Speed
- 5.1.3 Power Electronics
- 5.1.3.1 Inverters
- 5.1.3.2 DC-DC Converters
- 5.1.3.3 On-Board Chargers
- 5.1.4 Battery Pack
- 5.1.5 Thermal Management Systems
- 5.1.6 High-Voltage Cabling & Controllers
- 5.1.1 Electric Motors
- 5.2 By Propulsion Type
- 5.2.1 Battery Electric Vehicle (BEV)
- 5.2.2 Plug-in Hybrid Electric Vehicle (PHEV)
- 5.2.3 Fuel-Cell Electric Vehicle (FCEV)
- 5.3 By Vehicle Class
- 5.3.1 Passenger Cars
- 5.3.2 Light Commercial Vehicles
- 5.3.3 Heavy Commercial Vehicles
- 5.3.4 Two and Three-Wheelers
- 5.3.5 Off-Highway Vehicles
- 5.4 By Voltage Architecture
- 5.4.1 Less than equal to 400 V Systems
- 5.4.2 800 V Systems
- 5.4.3 Above 800 V Systems
- 5.5 By Sales Channel
- 5.5.1 OEM-Fitted Powertrains
- 5.5.2 Aftermarket Retrofit Kits
- 5.6 By Geography
- 5.6.1 North America
- 5.6.1.1 United States
- 5.6.1.2 Canada
- 5.6.1.3 Rest of North America
- 5.6.2 South America
- 5.6.2.1 Brazil
- 5.6.2.2 Argentina
- 5.6.2.3 Rest of South America
- 5.6.3 Europe
- 5.6.3.1 Germany
- 5.6.3.2 United Kingdom
- 5.6.3.3 France
- 5.6.3.4 Italy
- 5.6.3.5 Spain
- 5.6.3.6 Netherlands
- 5.6.3.7 Rest of Europe
- 5.6.4 Asia-Pacific
- 5.6.4.1 China
- 5.6.4.2 Japan
- 5.6.4.3 India
- 5.6.4.4 South Korea
- 5.6.4.5 Thailand
- 5.6.4.6 Vietnam
- 5.6.4.7 Rest of Asia-Pacific
- 5.6.5 Middle East and Africa
- 5.6.5.1 Saudi Arabia
- 5.6.5.2 United Arab Emirates
- 5.6.5.3 Turkey
- 5.6.5.4 South Africa
- 5.6.5.5 Egypt
- 5.6.5.6 Rest of Middle East and Africa
- 5.6.1 North America
6 Competitive Landscape
- 6.1 Market Concentration
- 6.2 Strategic Moves
- 6.3 Market Share Analysis
- 6.4 Company Profiles (Includes Global-level Overview, Market-level Overview, Core Segments, Financials, Strategic Information, Market Rank/Share, Products & Services, Recent Developments)
- 6.4.1 Tesla, Inc.
- 6.4.2 BYD Co. Ltd.
- 6.4.3 Bosch Mobility (Robert Bosch GmbH)
- 6.4.4 Magna International Inc.
- 6.4.5 BorgWarner Inc.
- 6.4.6 ZF Friedrichshafen AG
- 6.4.7 Dana Incorporated
- 6.4.8 GKN Automotive
- 6.4.9 Hitachi Astemo, Ltd.
- 6.4.10 Mitsubishi Electric Corporation
- 6.4.11 AVL List GmbH
- 6.4.12 Cummins Inc.
- 6.4.13 Siemens AG (eMobility)
- 6.4.14 Nidec Corporation
- 6.4.15 Continental AG
- 6.4.16 Valeo SA
- 6.4.17 Vitesco Technologies Group AG
- 6.4.18 AISIN Corporation
- 6.4.19 Denso Corporation
- 6.4.20 Schaeffler AG
- 6.4.21 Hyundai Mobis Co., Ltd.
7 Market Opportunities and Future Outlook
- 7.1 White-Space and Unmet-Need Assessment


