

|
시장보고서
상품코드
2100606
CaaS(Cybersecurity-as-a-Service) 시장 : 시장 점유율 분석, 업계 동향 및 통계, 성장 예측(2026-2031년)Cybersecurity As A Service - Market Share Analysis, Industry Trends & Statistics, Growth Forecasts (2026 - 2031) |
||||||
 Mordor Intelligence
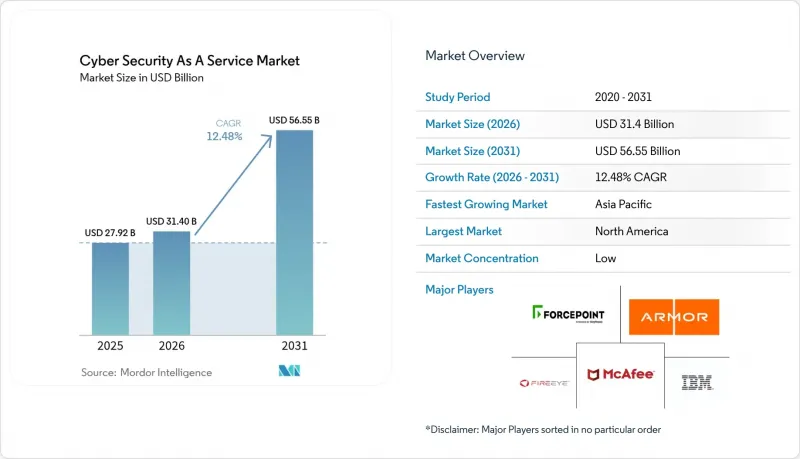
Mordor Intelligence에 의하면, CaaS(Cybersecurity-as-a-Service) 시장 규모는 2025년 279억 2,000만 달러로 평가되었고, 2026년에는 314억 달러로 확대될 것으로 추정되고, 2026-2031년 CAGR 12.48%로 성장을 지속할 전망이며, 2031년에는 565억 5,000만 달러에 이를 것으로 예측됩니다.
본 보고서는 최종 사용자 기업 규모별(중소기업, 대기업), 서비스 모델별(SOC as a Service 등), 보안 유형별(위험 및 취약점 평가 등), 도입 형태별(퍼블릭 클라우드, 프라이빗 클라우드 등), 최종 사용자 산업별(은행, 금융서비스 및 보험(BFSI), 제조업 등), 지역별(북미, 유럽 등)로 분류되어 있습니다. 시장 전망은 금액(달러) 기준으로 제시되어 있습니다.
세계의 CaaS(Cybersecurity-as-a-Service) 시장 동향 및 인사이트
데이터 침해 비용 및 빈도 증가가 서비스 도입을 촉진
2024년 데이터 침해로 인한 평균 비용은 488만 달러에 달하고, 전년 대비 10% 증가했습니다. 이에 따라 이사회는 지속적인 모니터링 및 신속한 대응 서비스에 대한 자금 지원을 서둘러야 하는 상황에 직면했습니다. 의료 분야의 데이터 침해로 인한 피해액은 977만 달러에 달하고, 보고된 사고의 79%를 차지했으나, AI 및 자동화를 도입한 조직에서는 220만 달러의 비용 절감을 실현하고 피해 차단 기간을 54일 단축했습니다. 데이터 유출 피해를 입은 기업의 70%가 심각한 사업 중단을 경험한 것으로 나타나, ISO 27001 등의 규제 프레임워크에서는 실시간 감지 및 대응이 기본 요건으로 자리 잡고 있습니다.
기술 인력 부족의 위기 속에서 중소기업의 사이버 보안 수요가 가속화
사이버 공격의 43%는 중소기업이 피해를 입고 있지만, 여전히 18%의 기업이 공식적인 방어책을 마련하지 않고 있으며, 44%는 기본적인 도구에 의존하고 있습니다. 피해를 입은 중소기업의 60%가 6개월 이내에 폐업에 내몰리는 가운데, 각 서비스 제공업체들은 연중무휴 24시간 SOC 모니터링, 규정 준수 지도, 사이버 보험 가입을 패키지화한 구독형 서비스를 전개하고 있습니다. 영국의 ‘Cyber Essentials’와 같은 정부 주도 제도나월1만 달러부터 이용할 수 있는 저비용 SOC 패키지 덕분에 관련 수요가 확대되고 있습니다.
데이터 주권에 대한 우려가 서비스 제공의 과제를 야기하고 있습니다.
NIS2에 따라 유럽의 35만 개 사업체가 공급망 감시를 강화해야 하는 상황에 놓여 있으며, 제공업체는 거주 요건을 충족하기 위해 텔레메트리 데이터를 EU 역내에 호스팅해야 할 의무가 있습니다. 싱가포르와 인도에서의 유사한 규제로 인해 전 세계 MSSP는 지역별로 인프라를 복제할 수밖에 없게 되었으며, 이로 인해 설비 투자가 증가하고 위협 인텔리전스 공유가 복잡해지고 있습니다. 벤더 종속을 우려하는 기업들은 전환 장벽을 낮추기 위해 계약상의 해지 조항이나 개방형 표준 텔레메트리 데이터를 점점 더 요구하고 있습니다.
부문 분석
2025년, CaaS(Cybersecurity-as-a-Service) 시장의 71.35%를 대기업이 차지했습니다. 이는 다층적인 MDR, 위협 헌팅, 규정 준수 오케스트레이션 이니셔티브를 뒷받침하는 예산에 힘입은 결과입니다. 사고 대응 정액제 계약이나 데이터 침해 보험과의 연동을 포함한 종합적인 서비스의 경우, 계약 금액이 연간 50만 달러를 초과하는 것이 일반적입니다. 한편, 중소기업 부문은 턴키 방식의 SOC-as-a-Service 번들 및 NIS2 의무를 소규모 공급망 파트너까지 확대하는 규제 프로그램의 뒷받침을 받아 연평균 성장률(CAGR) 13.98%를 나타낼 것으로 예측됩니다.
비용 대비 효과가 높은 클라우드 제공 모델, 정액제 구독 요금, 보험사와 연계된 할인 혜택 덕분에 중소기업, 특히 중소기업의 클라우드 도입이 급증하고 있는 아시아태평양에서 진입 장벽이 낮아지고 있습니다. 언어 지원이 완료된 대시보드와 규정 준수 템플릿을 맞춤화하는 제공업체는 관리형 보안 서비스를 처음 도입하는 고객 사이에서 압도적인 시장 점유율을 확보하고 있습니다.
2025년, 매니지드 감지 및 대응(MDR)은 사이버 보안 서비스(CaaS) 시장 규모의 29.10%를 차지했으며, 신속한 시정 조치와 결합된 선제적인 위협 감지 활동을 기업들이 선호하는 경향을 반영하고 있습니다. CrowdStrike의 플랫폼 모델은 엔드포인트, ID, 클라우드 텔레메트리 데이터를 통합함으로써 실현한 경쟁 우위를 보여주고 있습니다. SOC as a Service(SOCaaS)는 AI를 활용한 트리아지 및 자원이 제한된 조직의 요구를 충족시키는 ‘성장에 따른 라이선싱’ 방식에 힘입어 연평균 성장률(CAGR) 16.95%로 확대되고 있습니다.
또한, AI 워크플로우에서 M2M(머신 간) 트래픽이 폭발적으로 증가하고, 기업들이 인증 정보의 라이프사이클 관리를 외부에 위탁하는 추세에 따라 ‘아이덴티티 애즈 어 서비스(IaaS)’도 성장을 이어가고 있습니다. 취약점 테스트나 규정 준수 평가는 여전히 기초적인 요소이지만, 현재는 보험이나 이사회 수준의 위험 지표와 직접적으로 연결되는 지속적인 검증 능력야말로 차별화의 핵심이 되고 있습니다.
지역별 분석
북미는 2025년 매출의 34.10%를 차지했습니다. 이는 미국 기업이 건당 980만 달러라는 세계 최고 수준의 데이터 유출 비용을 부담하고 있다는 점과, 지속적인 감지 및 보고를 우선시하는 SEC(미국 증권거래위원회)의 엄격한 공시 요건에 힘입은 결과입니다. 이사회가 도구의 중복을 줄이고 감사 대응을 간소화하는 단일 플랫폼 공급업체를 선호함에 따라 지출 증가세는 견조하게 유지되고 있습니다. 벤처 캐피털은 계속해서 AI를 핵심으로 하는 혁신 기업에 자금을 지원하며, 활기찬 파트너 생태계를 유지하고 있습니다.
아시아태평양은 가장 빠르게 성장하는 지역으로, 기업들이 멀티클라우드로의 전환과 온라인 결제 채널의 보안 확보를 서두르는 가운데 2031년까지 연평균 성장률(CAGR) 14.95%로 확대될 전망입니다. 인도의 기술 지출은 2025년에 5조 루피(604억 달러)에 달할 전망이며, 이는 하이브리드 클라우드 보안 컨설팅에 대한 수요를 자극하는 한편, 해당 지역의 사이버 보험 시장은 연간 약 50%의 속도로 성장하고 있습니다. 싱가포르의 ‘사이버 보안법’부터 중국의 ‘개인정보 보호법’에 이르는 현지 규제로 인해, 세계 위협 인텔리전스와 국내 데이터 처리를 융합한 지역 특화 SOC 구축이 촉진되고 있습니다.
유럽에서는 NIS2를 배경으로 꾸준한 확대가 이어지고 있으며, 이에 따라 약 35만 개의 중요 사업체에 대해 연중무휴 24시간 SOC 운영이 의무화되었습니다. 데이터 주권에 대한 우려로 인해 지역 클라우드를 운영하고 개인정보 보호 강화 기술을 지원하는 제공업체가 선호되고 있습니다. 또한, ENISA 지침 준수를 입증한 조직에 대해 보험사가 보험료를 인하하는 등 경제적 인센티브도 나타나고 있으며, 이에 따라 중견 기업 및 대기업 부문 전반에서 서비스 이용이 더욱 정착되고 있습니다.
기타 혜택 :
- 엑셀 형식 시장 예측(ME) 시트
- 3개월간의 애널리스트 지원
자주 묻는 질문
목차
제1장 서론
제2장 조사 방법
제3장 주요 요약
제4장 시장 구도
제5장 시장 규모 및 성장 예측
제6장 경쟁 구도
제7장 시장 기회 및 향후 전망
AJY 26.08.07According to Mordor Intelligence, the cybersecurity as a service market size is expected to grow from USD 27.92 billion in 2025 to USD 31.4 billion in 2026 and is forecast to reach USD 56.55 billion by 2031 at 12.48% CAGR over 2026-2031.
This report is Segmented by End-User Enterprise Size (SMEs, Large Enterprises), Service Model ( SOC As A Service, and More), Security Type (Risk and Vulnerability Assessment, and More), Deployment Mode (Public Cloud, Private Cloud, and More), End-User Industry (BFSI, Manufacturing, and More), and Geography (North America, Europe, and More). The Market Forecasts are Provided in Terms of Value (USD).
Global Cybersecurity As A Service Market Trends and Insights
Rising Cost and Frequency of Data Breaches Drive Service Adoption
Average breach expenses climbed to USD 4.88 million in 2024, a 10% year-over-year jump, pressuring boards to fund continuous monitoring and rapid containment services. Healthcare breaches cost USD 9.77 million and represented 79% of reported incidents, while AI- and automation-enabled organizations saved USD 2.2 million and shortened containment by 54 days. As 70% of breached firms experience material business disruption, regulatory frameworks such as ISO 27001 elevate real-time detection and response to a baseline requirement.
SME Cybersecurity Demand Accelerates Amid Skills Crisis
SMEs suffer 43% of cyberattacks, yet 18% still lack formal defenses; a further 44% rely on basic tools. With 60% of impacted SMEs folding within six months, service providers are tailoring subscription-based offerings that bundle 24/7 SOC oversight, compliance guidance, and cyber-insurance facilitation. Government schemes like the U.K.'s Cyber Essentials and lower-cost SOC bundles priced from USD 10,000 per month are expanding addressable demand.
Data Sovereignty Concerns Create Service Delivery Challenges
NIS2 pushes 350,000 European entities to tighten supply-chain oversight, compelling providers to host telemetry inside the bloc to satisfy residency mandates. Similar rules in Singapore and India force global MSSPs to replicate infrastructure regionally, raising capex and complicating threat-intelligence sharing. Enterprises wary of vendor lock-in increasingly demand contractual exit clauses and open-standards telemetry to mitigate switching barriers.
Other drivers and restraints analyzed in the detailed report include:
- Cloud Migration Expands Attack Surfaces and Service Requirements
- Cyber-Insurance Evolution Mandates Continuous Monitoring
- Multi-Cloud Visibility Gaps Undermine Service Effectiveness
For complete list of drivers and restraints, kindly check the Table Of Contents.
Segment Analysis
Large enterprises accounted for 71.35% of Cybersecurity As A Service Market share in 2025, driven by budgets that support multi-layered MDR, threat-hunting, and compliance orchestration engagements. Contract values routinely surpass USD 500,000 per year for holistic coverage that includes incident-response retainers and breach-insurance alignment. The SME segment, however, is forecast to grow at 13.98% CAGR, fueled by turnkey SOC-as-a-Service bundles and regulatory programs that extend NIS2 obligations to smaller supply-chain partners.
Cost-effective cloud delivery models, flat-fee subscription pricing, and insurer-linked discounts are lowering barriers for SMEs, especially in Asia Pacific, where SMB cloud adoption is surging. Providers tailoring language-localized dashboards and compliance templates are capturing outsized share among first-time buyers of managed security services.
Managed detection and response held 29.10% of the Cybersecurity As A Service Market size in 2025, reflecting enterprises' preference for proactive threat-hunting fused with rapid remediation. CrowdStrike's platform model illustrates competitive advantage achieved through endpoint, identity, and cloud telemetry convergence. SOC as a Service is expanding at 16.95% CAGR, supported by AI-driven triage and pay-as-you-grow licensing that resonates with resource-constrained organizations.
Identity-as-a-Service is also climbing as machine-to-machine traffic explodes in AI workflows, prompting firms to outsource credential lifecycle management. Vulnerability testing and compliance assessment remain foundational, yet differentiation now hinges on continuous validation capabilities that map directly to insurance and board-level risk metrics.
Complete Report Scope:
- By End-user Enterprise Size
- Small and Medium Enterprises (SMEs)
- Large Enterprises
- By Service Model
- Managed Detection and Response (MDR)
- SOC as a Service
- Identity and Access Management as a Service
- Vulnerability and Pen-Test as a Service
- Compliance and Risk Assessment as a Service
- Data Loss Prevention as a Service
- By Security Type
- Risk and Vulnerability Assessment
- Threat Intelligence and Analytics
- Auditing and Logging
- Continuous Monitoring and Encryption
- Identity and Access Management
- Incident Response and Disaster Recovery aaS
- By Deployment Mode
- Public Cloud
- Private Cloud
- Hybrid Cloud
- By End-user Industry
- BFSI
- Healthcare and Life Sciences
- IT and Telecom
- Government and Defense
- Energy and Utilities
- Retail and E-commerce
- Manufacturing
- Geography
- North America
- United States
- Canada
- Mexico
- South America
- Brazil
- Argentina
- Rest of South America
- Europe
- United Kingdom
- Germany
- France
- Russia
- Rest of Europe
- Asia-Pacific
- China
- India
- Japan
- South Korea
- Rest of Asia-Pacific
- Middle East and Africa
- Middle East
- GCC
- Turkey
- Israel
- Rest of Middle East
- Africa
- South Africa
- Nigeria
- Kenya
- Rest of Africa
- Middle East
- North America
Geography Analysis
North America generated 34.10% of 2025 revenue, supported by the world's highest breach costs U.S. organizations pay USD 9.8 million per incident and by stringent SEC disclosure mandates that prioritize continuous detection and reporting. Spending growth remains healthy as boards favor single-platform vendors that cut tool overlap and simplify audit readiness. Venture capital continues to fund AI-centric disruptors, sustaining a vibrant partner ecosystem.
Asia Pacific is the fastest-growing region, advancing at 14.95% CAGR to 2031 as enterprises rush to secure multi-cloud migrations and online-payment channels. India's technology expenditure is set to reach INR 5 trillion (USD 60.4 billion) in 2025, stimulating demand for hybrid-cloud security consulting, while the region's cyber-insurance market grows almost 50% annually. Local regulations ranging from Singapore's Cybersecurity Act to China's Personal Information Protection Law are spurring localized SOC buildouts that blend global threat intelligence with in-country data processing.
Europe maintains steady expansion underpinned by NIS2, which extends mandatory 24/7 SOC coverage to roughly 350,000 critical entities. Data-sovereignty sensitivities drive preference for providers that operate regional clouds and support privacy-enhancing technologies. Economic incentives are emerging as insurers lower premiums for organizations demonstrating adherence to ENISA guidance, further embedding service consumption across mid-market and enterprise segments.
- International Business Machines (IBM) Corporation
- Accenture plc
- Cisco Systems, Inc.
- AT&T Cybersecurity (AT&T Inc.)
- Secureworks, Inc.
- McAfee, LLC
- Trellix LLC (Musarubra US LLC)
- Fortinet, Inc.
- Palo Alto Networks Inc.
- Check Point Software Technologies Ltd.
- CrowdStrike Holdings, Inc.
- Rapid7, Inc.
- Sophos Ltd
- Proofpoint Inc.
- Zscaler, Inc.
- FireEye, LLC
- Armor Defense Inc.
- Convergent Network Solutions Ltd.
- Transputec Ltd.
- Zeguro Inc.
- Sara Technologies Inc.
- Cloud24x7 Pvt. Ltd.
Additional Benefits:
- The market estimate (ME) sheet in Excel format
- 3 months of analyst support
TABLE OF CONTENTS
1 INTRODUCTION
- 1.1 Study Assumptions and Market Definition
- 1.2 Scope of the Study
2 RESEARCH METHODOLOGY
3 EXECUTIVE SUMMARY
4 MARKET LANDSCAPE
- 4.1 Market Overview
- 4.2 Market Drivers
- 4.2.1 Rising cost and frequency of data breaches
- 4.2.2 SME demand amid cyber-skills shortage
- 4.2.3 Cloud and remote-work-led attack surface expansion
- 4.2.4 Cyber-insurance clauses mandating continuous monitoring
- 4.2.5 Identity-centric security for API/M2M traffic
- 4.2.6 NIS2 and similar 24X7 SOC requirements for critical entities
- 4.3 Market Restraints
- 4.3.1 Data-sovereignty / vendor-lock-in concerns
- 4.3.2 Visibility gaps in multi-cloud environments
- 4.3.3 Targeted attacks on MSSP/CSaaS supply chain
- 4.3.4 Talent-cost inflation eroding provider margins
- 4.4 Industry Value Chain Analysis
- 4.5 Regulatory Landscape
- 4.6 Technological Outlook
- 4.7 Porter's Five Forces Analysis
- 4.7.1 Bargaining Power of Suppliers
- 4.7.2 Bargaining Power of Buyers
- 4.7.3 Threat of New Entrants
- 4.7.4 Threat of Substitutes
- 4.7.5 Competitive Rivalry
5 MARKET SIZE AND GROWTH FORECASTS (VALUE)
- 5.1 By End-user Enterprise Size
- 5.1.1 Small and Medium Enterprises (SMEs)
- 5.1.2 Large Enterprises
- 5.2 By Service Model
- 5.2.1 Managed Detection and Response (MDR)
- 5.2.2 SOC as a Service
- 5.2.3 Identity and Access Management as a Service
- 5.2.4 Vulnerability and Pen-Test as a Service
- 5.2.5 Compliance and Risk Assessment as a Service
- 5.2.6 Data Loss Prevention as a Service
- 5.3 By Security Type
- 5.3.1 Risk and Vulnerability Assessment
- 5.3.2 Threat Intelligence and Analytics
- 5.3.3 Auditing and Logging
- 5.3.4 Continuous Monitoring and Encryption
- 5.3.5 Identity and Access Management
- 5.3.6 Incident Response and Disaster Recovery aaS
- 5.4 By Deployment Mode
- 5.4.1 Public Cloud
- 5.4.2 Private Cloud
- 5.4.3 Hybrid Cloud
- 5.5 By End-user Industry
- 5.5.1 BFSI
- 5.5.2 Healthcare and Life Sciences
- 5.5.3 IT and Telecom
- 5.5.4 Government and Defense
- 5.5.5 Energy and Utilities
- 5.5.6 Retail and E-commerce
- 5.5.7 Manufacturing
- 5.6 Geography
- 5.6.1 North America
- 5.6.1.1 United States
- 5.6.1.2 Canada
- 5.6.1.3 Mexico
- 5.6.2 South America
- 5.6.2.1 Brazil
- 5.6.2.2 Argentina
- 5.6.2.3 Rest of South America
- 5.6.3 Europe
- 5.6.3.1 United Kingdom
- 5.6.3.2 Germany
- 5.6.3.3 France
- 5.6.3.4 Russia
- 5.6.3.5 Rest of Europe
- 5.6.4 Asia-Pacific
- 5.6.4.1 China
- 5.6.4.2 India
- 5.6.4.3 Japan
- 5.6.4.4 South Korea
- 5.6.4.5 Rest of Asia-Pacific
- 5.6.5 Middle East and Africa
- 5.6.5.1 Middle East
- 5.6.5.1.1 GCC
- 5.6.5.1.2 Turkey
- 5.6.5.1.3 Israel
- 5.6.5.1.4 Rest of Middle East
- 5.6.5.2 Africa
- 5.6.5.2.1 South Africa
- 5.6.5.2.2 Nigeria
- 5.6.5.2.3 Kenya
- 5.6.5.2.4 Rest of Africa
- 5.6.5.1 Middle East
- 5.6.1 North America
6 COMPETITIVE LANDSCAPE
- 6.1 Market Concentration
- 6.2 Strategic Moves
- 6.3 Market Share Analysis
- 6.4 Company Profiles (includes Global level Overview, Market level overview, Core Segments, Financials as available, Strategic Information, Market Rank/Share for key companies, Products and Services, Recent Developments)
- 6.4.1 International Business Machines (IBM) Corporation
- 6.4.2 Accenture plc
- 6.4.3 Cisco Systems, Inc.
- 6.4.4 AT&T Cybersecurity (AT&T Inc.)
- 6.4.5 Secureworks, Inc.
- 6.4.6 McAfee, LLC
- 6.4.7 Trellix LLC (Musarubra US LLC)
- 6.4.8 Fortinet, Inc.
- 6.4.9 Palo Alto Networks Inc.
- 6.4.10 Check Point Software Technologies Ltd.
- 6.4.11 CrowdStrike Holdings, Inc.
- 6.4.12 Rapid7, Inc.
- 6.4.13 Sophos Ltd
- 6.4.14 Proofpoint Inc.
- 6.4.15 Zscaler, Inc.
- 6.4.16 FireEye, LLC
- 6.4.17 Armor Defense Inc.
- 6.4.18 Convergent Network Solutions Ltd.
- 6.4.19 Transputec Ltd.
- 6.4.20 Zeguro Inc.
- 6.4.21 Sara Technologies Inc.
- 6.4.22 Cloud24x7 Pvt. Ltd.
7 MARKET OPPORTUNITIES and FUTURE OUTLOOK
- 7.1 White-space and Unmet-need Assessment


