

|
시장보고서
상품코드
2100651
디지털 뱅킹 플랫폼 : 시장 점유율 분석, 업계 동향 및 통계, 성장 예측(2026-2031년)Digital Banking Platform - Market Share Analysis, Industry Trends & Statistics, Growth Forecasts (2026 - 2031) |
||||||
 Mordor Intelligence
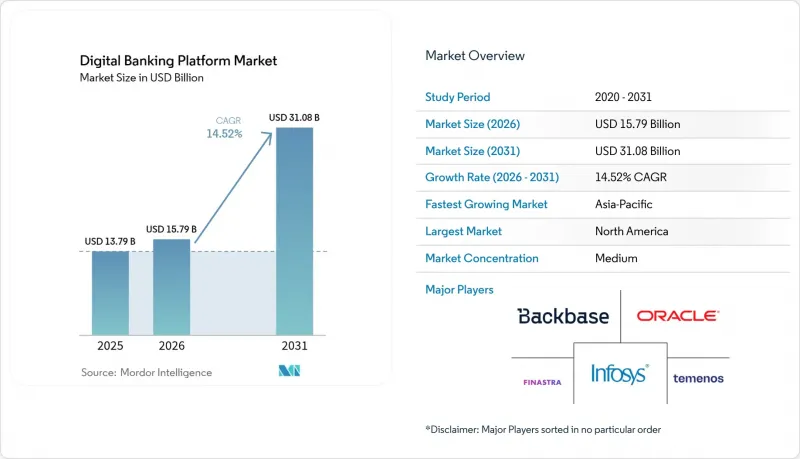
Mordor Intelligence에 의하면, 디지털 뱅킹 플랫폼 시장 규모는 2025년에 137억 9,000만 달러로 평가되었습니다. 2026년 157억 9,000만 달러에서 2031년까지 310억 8,000만 달러에 이를 것으로 예상되며, 예측 기간(2026-2031년) CAGR은 14.52%를 나타낼 전망입니다.
본 보고서는 도입 형태(클라우드 및 On-Premise), 은행 유형(소매 뱅킹 및 법인·중소기업 대상 뱅킹), 구성 요소(플랫폼 및 서비스), 서비스 모델(SaaS 구독, 라이선싱, Banking-As-A-Service), 접근 방식(모바일 뱅킹 및 온라인/웹 뱅킹)별로 분류되어 있습니다. 또한 지역별로도 분석되어 있습니다. 시장 예측은 금액(달러) 기준으로 제시되어 있습니다.
세계의 디지털 뱅킹 플랫폼 시장 동향과 인사이트
Tier 1 은행의 ‘클라우드 퍼스트’형 코어 뱅킹 전환
Tier 1 금융기관은 고정 인프라 비용 절감과 제품 출시 주기 단축을 위해 멀티 클라우드 도입을 가속화하고 있습니다. JP모건 체이스는 멀티클라우드 구축을 완료한 반면, 산탄데르 은행의 10개 시장에 걸친 시스템 개편은 레거시 코어 시스템을 단계적으로 폐지하는 데 필요한 조치의 중요성을 부각시키고 있습니다. 각 은행은 전환 후 신규 디지털 제품 시장 출시 기간이 50% 단축되었다고 보고하고 있으며, 이는 클라우드가 전략적 수단임을 입증하고 있습니다. 실시간 분석, 내장형 부정 감지 엔진, AI 기반 고객 인사이트가 동일한 아키텍처 상에서 작동하여 교차 판매 촉진 및 규정 준수 대응의 민첩성을 높이고 있습니다. 반코 이타우는 2028년까지 100% 클라우드 전환을 완료할 계획이며, 이는 측정 가능한 효율성 향상이 전환 위험을 상회한다는 점을 동종 업계에 보여주는 신호가 되고 있습니다.
신흥 시장에서 스마트폰 중심의 라이프스타일 뱅킹에 대한 수요
모바일 퍼스트 전략의 도입으로 아시아태평양 및 라틴아메리카 전역에서 지점망 확장에 따른 경제성이 약화되고 있습니다. 디지털 지갑은 이미 해당 지역 내 전자상거래 지출의 70% 이상을 차지하고 있으며, 은행들은 프런트엔드를 라이프스타일형 슈퍼 앱으로 재구축할 수밖에 없는 상황에 처해 있습니다. 비용 측면의 경제성이 이러한 움직임을 뒷받침하고 있습니다. 모바일 거래 비용은 0.17달러인 반면, 창구 거래 비용은 4.25달러로, 이를 통해 창출된 이익을 사용자 경험(UX) 개선 및 임베디드 가맹점 서비스에 재투자하는 데 활용할 수 있게 됩니다. 누뱅크는 규모의 우위를 보여주고 있으며, 고객 기반을 2020년 3,330만 명에서 2023년 9,390만 명으로 확대하면서도 세전 ROE를 27%로 유지하고 있습니다.
실시간 부정 분석 및 AML 규정 준수 비용 상승
세계 AML 관련 지출은 2,139억 달러에 달할 전망입니다. 이러한 투자에도 불구하고, 자금 세탁을 하는 자들은 합성 신분증이나 암호화폐 믹서를 통해 매년 약 2조 달러를 세탁하고 있는 것으로 추정됩니다. 은행들은 2023년 한 해에만 70억 달러의 벌금을 부과받았습니다. 스마트 AML 제품군은 오감지 감소를 통해 60%의 비용 절감을 약속하고 있지만, 도입에는 자본과 전문 기술이 필요하여 중소규모 금융 기관에 부담을 주고 있습니다.
부문 분석
2025년, 클라우드는 디지털 뱅킹 플랫폼 시장 점유율의 60.74%를 차지했으며, 금융 기관들이 자본 지출(Capex) 부담을 유연한 운영 비용(OpEx)으로 전환함에 따라 연평균 성장률(CAGR) 15.54%로 확대되고 있습니다. 각 은행은 워크로드를 확장 가능한 리전으로 이전함으로써 인프라 유지 관리 비용이 50% 절감되고 재해 복구 체계도 강화된다고 밝히고 있습니다. 엄격한 데이터 현지화 규정을 시행하고 있는 관할 구역에서는 On-Premise 핵심 시스템이 여전히 남아 있지만, 이러한 도입 환경에서도 컨테이너 오케스트레이션을 통해 클라우드의 탄력성을 모방하고 있습니다. EQ Bank의 Temenos 기반 마이그레이션은 지역 금융 기관들이 클라우드를 활용하여 메이니 센터 은행과의 기능 격차를 해소하고 있는 실태를 여실히 보여주고 있습니다.
클라우드 도입은 벤더의 비즈니스 모델을 재구성하고 있습니다. 구독형 라이선싱을 통해 수익이 사용량 피크와 연동되므로, 은행은 조달로 인한 지연 없이 새로운 서비스의 프로토타입을 제작할 수 있게 됩니다. 실시간 분석, 내장형 부정 감지 스코어링, AI 기반 신용 평가 모델링이 네이티브로 작동하므로 통합의 복잡성이 완화됩니다. 이와 동시에 벤더들은 에너지 효율을 높이기 위해 데이터센터 설계를 최적화하여 유럽의 그린 IT 지침을 준수하는 동시에 총 소유 비용(TCO)을 절감하고 있습니다. 더 많은 Tier 1 은행들이 탄소 순제로 달성 일정을 발표하는 가운데, 검증 가능한 배출량 감축을 입증하는 클라우드의 탄소 발자국이 조달 측면에서 우위를 점하고 있습니다.
2025년 매출에서 소매 뱅킹이 차지한 비중은 63.12%였으나, 기업 및 중소기업 대상 뱅킹은 현재 연평균 성장률(CAGR) 16.19%를 기록하며 디지털 뱅킹 플랫폼 시장에서 가장 빠르게 성장하는 하위 부문으로 자리매김하고 있습니다. 기업들은 실시간 유동성 대시보드, API 기반 결제, 그리고 ERP 워크플로우와 원활하게 연동되는 내장형 무역 금융 모듈을 요구하고 있습니다. 도입 계약의 평균 규모는 소매 계약을 상회하고 있으며, 이는 공급업체의 이익률 향상과 락인 기간 연장을 뒷받침하고 있습니다.
아시아태평양의 국경 간 공급업체들은 단일 작업 공간 내에서의 즉시 결제 및 동적 환율 헤지에 대한 수요를 높이고 있습니다. 내장형 금융 솔루션 또한 추가적인 성장 동력이 되고 있습니다. 핀테크 기업과의 제휴를 통해 제조업체는 청구서 할인 및 공급업체 신용 도구를 조달 포털에 직접 통합할 수 있어, 플랫폼에 대한 사용자 유지율을 높이고 있습니다.
지역별 분석
아시아태평양은 가장 빠른 성장을 주도하며 연평균 성장률(CAGR) 16.34%를 기록, 디지털 뱅킹 플랫폼 시장에서 이 지역의 기여도를 높이고 있습니다. 높은 스마트폰 보급률, 광범위한 QR 코드 결제 인프라, 그리고 지원적인 라이선스 제도가 기존 기업의 디지털화와 네오뱅크 설립을 모두 뒷받침하고 있습니다. 2024년에는 중국에서만 7조 6,000억 달러 규모의 디지털 지갑 지출이 처리된 반면, 싱가포르와 말레이시아는 경쟁을 촉진하기 위해 디지털 뱅크 인가 한도를 확대되고 있습니다. 동남아시아의 디지털 금융 서비스 매출은 330억 달러에 달하며, 상업적 실행 가능성을 입증했습니다.
북미는 풍부한 기술 예산과 클라우드 도입 선점을 바탕으로 37.35%의 점유율을 유지하고 있습니다. 각 은행은 신용 분석을 위한 AI 코파일럿, FedNow와의 통합, ESG 기준을 준수하는 코어 시스템 업데이트에 투자하고 있습니다. 오픈 뱅킹에 관한 규제 명확화는 아직 진행 중이지만, 금융 기관들이 수십년전의 메인프레임을 쇄신하는 가운데 투자의 기세는 꺾이지 않고 있습니다. 클라우드로의 집중 위험이 감독 당국의 주목을 받고 있어, 벤더에 대한 의존도를 완화하기 위한 멀티 클라우드 테스트이 진행되고 있습니다.
유럽에서는 오픈 뱅킹에서의 리더십과 지속가능성에 대한 요구 사이의 균형이 잡혀 있습니다. PSD2에 따라 API 공개가 표준화된 반면, ESG 보고가 벤더 선정에 영향을 미치게 되면서 에너지 효율이 뛰어난 SaaS 코어가 평가 기준에서 우선시되고 있습니다. 북유럽 시장은 높은 성숙도를 보이고 있으며, 디지털 뱅킹 보급률은 90%에 육박하고, 생체 인증의 급속한 도입이 진행되고 있습니다. 라틴아메리카는 ‘모바일 퍼스트’의 궤도를 따르고 있으며, 브라질의 Pix 결제 시스템은 즉시 결제 인프라가 디지털화 보급을 어떻게 가속화하는지를 보여주고 있습니다. 아프리카는 아직 발전 단계에 있지만, 완전한 디지털 뱅킹으로의 진입점이 되는 통신 사업자의 금융 생태계가 혜택을 가져다주고 있어, 클라우드 네이티브 벤더에게 새로운 비즈니스 기회가 창출되고 있습니다.
기타 혜택 :
- 엑셀 형식 시장 예측(ME) 시트
- 3개월간의 애널리스트 지원
자주 묻는 질문
목차
제1장 서론
제2장 조사 방법
제3장 주요 요약
제4장 시장 구도
제5장 시장 규모 및 성장 예측
제6장 경쟁 구도
제7장 시장 기회 및 향후 동향
KTH 26.08.07According to Mordor Intelligence, the digital banking platform market size was valued at USD 13.79 billion in 2025 and estimated to grow from USD 15.79 billion in 2026 to reach USD 31.08 billion by 2031, at a CAGR of 14.52% during the forecast period (2026-2031).
This report is Segmented by Deployment (Cloud and On-Premises), Banking Type (Retail Banking and Corporate/SME Banking), Component (Platform and Services), Service Model (SaaS Subscription, Licensed, and Banking-As-A-Service), Access Mode (Mobile Banking and Online/Web Banking). And Geography. The Market Forecasts are Provided in Terms of Value (USD).
Global Digital Banking Platform Market Trends and Insights
Cloud-First Core Banking Migrations Among Tier-1 Banks
Tier-1 institutions fast-track multi-cloud deployments to lower fixed infrastructure costs and compress product launch cycles. JPMorgan Chase has finished a multi-cloud roll-out, while Santander's ten-market overhaul underlines the commitment required to sunset legacy cores. Banks report 50% shorter time-to-market for new digital products after migration, reinforcing cloud as a strategic lever. Real-time analytics, embedded fraud-detection engines, and AI-based customer insights ride on the same architecture, boosting cross-sell and compliance agility. Banco Itau intends to complete a 100% cloud move by 2028, a signal to peers that measurable efficiency gains outweigh transition risk.
Smartphone-Centric Lifestyle Banking Demand in Emerging Markets
Mobile-first adoption short-circuits branch expansion economics across Asia-Pacific and Latin America. Digital wallets already underpin more than 70% of regional e-commerce spend, compelling banks to recast their front ends as lifestyle super-apps. Cost economics drive momentum: a mobile transaction costs USD 0.17 against USD 4.25 at the counter, freeing margin for reinvestment in UX refresh and embedded merchant services. Nubank demonstrates scale advantage, growing its customer base from 33.3 million in 2020 to 93.9 million in 2023 while sustaining a 27% pre-tax ROE.
Rising Cost of Real-Time Fraud-Analytics and AML Compliance
Global AML spend has reached USD 213.9 billion. Despite investment, launderers funnel an estimated USD 2 trillion through synthetic IDs and crypto mixers each year. Banks fielded USD 7 billion in fines during 2023 alone. Smart-AML suites promise 60% cost savings through false-positive reduction, yet rollout demands capital and specialist skill, pressuring small-to-mid-tier lenders.
Other drivers and restraints analyzed in the detailed report include:
- Regulatory Push for Open-Banking and API-Standard Compliance
- Generative-AI Powered Hyper-Personalized UX Roll-Outs
- Vendor Lock-In Risks from Hyperscaler Managed Services
For complete list of drivers and restraints, kindly check the Table Of Contents.
Segment Analysis
Cloud captured 60.74% of the digital banking platform market share in 2025 and is expanding at a 15.54% CAGR as institutions convert capex burdens into flexible opex. Banks cite 50% lower infrastructure upkeep and stronger disaster-recovery postures once workloads move to scalable regions. On-premises cores persist in jurisdictions enforcing strict data-localization, but even these deployments now mimic the cloud's elasticity through container orchestration. EQ Bank's Temenos-based migration underscores how regional lenders leverage cloud to close capability gaps with money-center peers.
Cloud adoption reshapes vendor economics: subscription licensing aligns revenue with usage peaks, letting banks prototype new services without procurement delays. Real-time analytics, embedded fraud scoring, and AI-driven credit modeling activate natively, reducing integration complexity. In parallel, platform vendors tune data-center designs for energy efficiency, addressing European Green-IT directives and lowering total cost of ownership. As more tier-1 banks publish carbon-net-zero timelines, cloud footprints that demonstrate verifiable emission savings gain a procurement advantage.
Retail banking represented 63.12% of 2025 revenue, yet corporate/SME banking now tracks a 16.19% CAGR, making it the fastest sub-segment within the digital banking platform market. Businesses seek real-time liquidity dashboards, API-driven payments, and embedded trade-finance modules that dovetail with ERP workflows. Average implementation deal sizes outstrip retail contracts, supporting higher vendor margins and longer lock-in periods.
Cross-border suppliers in Asia-Pacific elevate demand for instant settlement and dynamic FX hedging within single workspaces. Embedded finance propositions add further lift: fintech partnerships allow manufacturers to embed invoice-discounting or supplier-credit tools directly inside procurement portals, boosting platform stickiness.
Complete Report Scope:
- By Deployment
- Cloud
- On-Premises
- By Banking Type
- Retail Banking
- Corporate/SME Banking
- By Component
- Platform (Software)
- Services (Implementation and Support)
- By Service Model
- SaaS Subscription
- Licensed (Perpetual)
- Banking-as-a-Service (BaaS)
- By Access Mode
- Mobile Banking
- Online/Web Banking
- By Geography
- North America
- United States
- Canada
- Mexico
- South America
- Brazil
- Argentina
- Chile
- Rest of South America
- Europe
- Germany
- United Kingdom
- France
- Italy
- Spain
- Russia
- Rest of Europe
- Asia-Pacific
- China
- India
- Japan
- South Korea
- Singapore
- Malaysia
- Australia
- Rest of Asia-Pacific
- Middle East and Africa
- Middle East
- United Arab Emirates
- Saudi Arabia
- Turkey
- Rest of Middle East
- Africa
- South Africa
- Nigeria
- Rest of Africa
- Middle East
- North America
Geography Analysis
Asia-Pacific drives the fastest advance, recording a 16.34% CAGR that lifts regional contribution within the digital banking platform market. Smartphone saturation, universal QR payment infrastructure, and supportive licensing regimes nurture both incumbent digitization and neo-bank launches. China alone handled USD 7.6 trillion in digital-wallet spend during 2024, while Singapore and Malaysia expand digital-bank quotas to promote competition. Southeast Asia's digital financial services revenue reached USD 33 billion, confirming commercial viability.
North America retains a 37.35% share, underpinned by deep technology budgets and early-stage cloud adoption. Banks channel spending into AI copilots for credit analytics, FedNow integrations, and ESG-aligned core replacements. Regulatory clarity around open banking is still forming, but investment momentum remains intact as institutions refresh decades-old mainframes. Cloud concentration risk garners oversight, prompting multi-cloud experiments that temper vendor dependency.
Europe balances open-banking leadership with sustainability imperatives. PSD2 has normalized API exposure, while ESG reporting now influences vendor selection energy-efficient SaaS cores earn scorecard preference. Nordic markets illustrate maturity, with nearly 90% digital banking penetration and rapid adoption of biometric authentication. Latin America follows a mobile-first trajectory; Brazil's Pix rails demonstrate how instant-payment infrastructure accelerates digital adoption. Africa, though nascent, benefits from telco money ecosystems acting as on-ramps to full digital banking, creating greenfield opportunities for cloud-native vendors.
- Backbase B.V.
- Temenos Headquarters SA
- Finastra Group Holdings Limited
- Infosys Ltd. (Finacle)
- Oracle Corporation
- Fiserv, Inc.
- SAP SE
- Sopra Steria Group SA
- Tata Consultancy Services Limited
- CREALOGIX Holding AG
- Appway AG
- Worldline SA
- nCino, Inc.
- Alkami Technology, Inc.
- Mambu GmbH
- Thought Machine Group Ltd.
- Finxact, Inc.
- Fidor Solutions AG
- Technisys S.A.
- Plaid Inc.
- Intellect Design Arena Limited
- Ohpen Holding B.V.
- Jack Henry & Associates, Inc.
- Sopra Banking Software USA, Inc.
- Avaloq Group AG
Additional Benefits:
- The market estimate (ME) sheet in Excel format
- 3 months of analyst support
TABLE OF CONTENTS
1 INTRODUCTION
- 1.1 Study Assumptions and Market Definition
- 1.2 Scope of the Study
2 RESEARCH METHODOLOGY
3 EXECUTIVE SUMMARY
4 MARKET LANDSCAPE
- 4.1 Market Overview
- 4.2 Market Drivers
- 4.2.1 Cloud-first core banking migrations among Tier-1 banks
- 4.2.2 Smartphone-centric lifestyle banking demand in emerging markets
- 4.2.3 Regulatory push for open-banking and API-standard compliance
- 4.2.4 Generative-AI powered hyper-personalized UX roll-outs
- 4.2.5 Green-IT mandates driving shift to energy-efficient SaaS cores
- 4.2.6 Digital-only neo-bank expansion in under-banked regions
- 4.3 Market Restraints
- 4.3.1 Rising cost of real-time fraud-analytics and AML compliance
- 4.3.2 Vendor lock-in risks from hyperscaler managed services
- 4.3.3 Scarcity of cloud-native banking talent in developing nations
- 4.3.4 Interoperability gaps across legacy and micro-services stacks
- 4.4 Industry Value Chain Analysis
- 4.5 Regulatory Landscape
- 4.6 Technological Outlook
- 4.7 Industry Attractiveness - Porter's Five Forces Analysis
- 4.7.1 Bargaining Power of Suppliers
- 4.7.2 Bargaining Power of Consumers
- 4.7.3 Threat of New Entrants
- 4.7.4 Threat of Substitutes
- 4.7.5 Intensity of Competitive Rivalry
- 4.8 Impact of Macroeconomic Factors on the Market
5 MARKET SIZE AND GROWTH FORECASTS (VALUES)
- 5.1 By Deployment
- 5.1.1 Cloud
- 5.1.2 On-Premises
- 5.2 By Banking Type
- 5.2.1 Retail Banking
- 5.2.2 Corporate/SME Banking
- 5.3 By Component
- 5.3.1 Platform (Software)
- 5.3.2 Services (Implementation and Support)
- 5.4 By Service Model
- 5.4.1 SaaS Subscription
- 5.4.2 Licensed (Perpetual)
- 5.4.3 Banking-as-a-Service (BaaS)
- 5.5 By Access Mode
- 5.5.1 Mobile Banking
- 5.5.2 Online/Web Banking
- 5.6 By Geography
- 5.6.1 North America
- 5.6.1.1 United States
- 5.6.1.2 Canada
- 5.6.1.3 Mexico
- 5.6.2 South America
- 5.6.2.1 Brazil
- 5.6.2.2 Argentina
- 5.6.2.3 Chile
- 5.6.2.4 Rest of South America
- 5.6.3 Europe
- 5.6.3.1 Germany
- 5.6.3.2 United Kingdom
- 5.6.3.3 France
- 5.6.3.4 Italy
- 5.6.3.5 Spain
- 5.6.3.6 Russia
- 5.6.3.7 Rest of Europe
- 5.6.4 Asia-Pacific
- 5.6.4.1 China
- 5.6.4.2 India
- 5.6.4.3 Japan
- 5.6.4.4 South Korea
- 5.6.4.5 Singapore
- 5.6.4.6 Malaysia
- 5.6.4.7 Australia
- 5.6.4.8 Rest of Asia-Pacific
- 5.6.5 Middle East and Africa
- 5.6.5.1 Middle East
- 5.6.5.1.1 United Arab Emirates
- 5.6.5.1.2 Saudi Arabia
- 5.6.5.1.3 Turkey
- 5.6.5.1.4 Rest of Middle East
- 5.6.5.2 Africa
- 5.6.5.2.1 South Africa
- 5.6.5.2.2 Nigeria
- 5.6.5.2.3 Rest of Africa
- 5.6.5.1 Middle East
- 5.6.1 North America
6 COMPETITIVE LANDSCAPE
- 6.1 Market Concentration
- 6.2 Strategic Moves
- 6.3 Market Share Analysis
- 6.4 Company Profiles (includes Global level Overview, Market level overview, Core Segments, Financials as available, Strategic Information, Market Rank/Share for key companies, Products and Services, and Recent Developments)
- 6.4.1 Backbase B.V.
- 6.4.2 Temenos Headquarters SA
- 6.4.3 Finastra Group Holdings Limited
- 6.4.4 Infosys Ltd. (Finacle)
- 6.4.5 Oracle Corporation
- 6.4.6 Fiserv, Inc.
- 6.4.7 SAP SE
- 6.4.8 Sopra Steria Group SA
- 6.4.9 Tata Consultancy Services Limited
- 6.4.10 CREALOGIX Holding AG
- 6.4.11 Appway AG
- 6.4.12 Worldline SA
- 6.4.13 nCino, Inc.
- 6.4.14 Alkami Technology, Inc.
- 6.4.15 Mambu GmbH
- 6.4.16 Thought Machine Group Ltd.
- 6.4.17 Finxact, Inc.
- 6.4.18 Fidor Solutions AG
- 6.4.19 Technisys S.A.
- 6.4.20 Plaid Inc.
- 6.4.21 Intellect Design Arena Limited
- 6.4.22 Ohpen Holding B.V.
- 6.4.23 Jack Henry & Associates, Inc.
- 6.4.24 Sopra Banking Software USA, Inc.
- 6.4.25 Avaloq Group AG
7 MARKET OPPORTUNITIES AND FUTURE TRENDS
- 7.1 White-Space and Unmet-Need Assessment


