

|
시장보고서
상품코드
2113215
HCS(High Content Screening) : 시장 점유율 분석, 업계 동향과 통계, 성장 예측(2026-2031년)High Content Screening - Market Share Analysis, Industry Trends & Statistics, Growth Forecasts (2026 - 2031) |
||||||
 Mordor Intelligence
Mordor Intelligence에 의하면, HCS(High Content Screening) 시장 규모는 2025년 20억 2,000만 달러에서 2026년에는 21억 4,000만 달러로 확대되어 2026-2031년 CAGR 5.83%로 성장을 지속하여, 2031년까지 28억 4,000만 달러에 달할 것으로 예측됩니다.
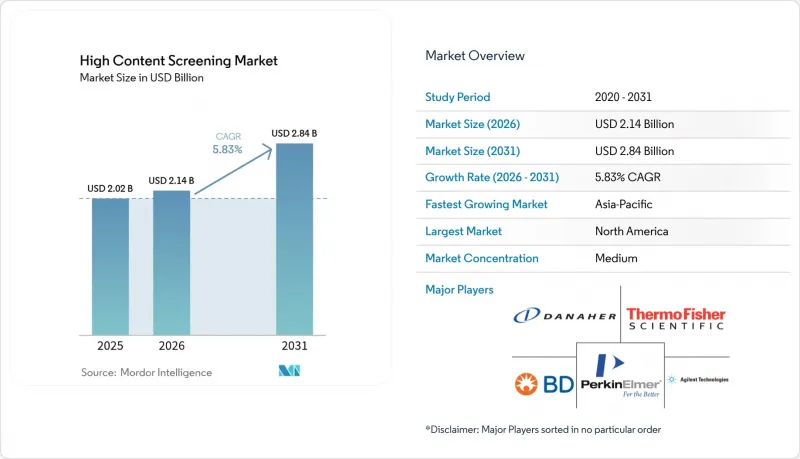
본 보고서는 제품별(장비, 소모품 및 시약, 소프트웨어, 서비스, 부속품), 용도별(1차·2차 스크리닝, 표적 동정·검증 등), 최종 사용자별(제약·바이오기술 기업, 수탁 연구 기관 등), 지역별(북미, 유럽 등)로 분류되어 있습니다. 시장 예측은 금액(달러) 기준으로 제시되어 있습니다.
세계 HCS(High Content Screening) 시장 동향 및 인사이트
비용 대비 효과가 높은 신약 개발의 필요성
연구 개발비 증가와 후기 단계에서의 개발 실패가 지속됨에 따라, 제약 기업들은 히트에서 리드로의 의사 결정을 효율화하는 HCS(High Content Screening) 시장의 솔루션을 채택할 수밖에 없게 되었습니다. 클라우드 랩은 이미지 획득 및 분석 워크로드를 종량제 인프라로 전환함으로써 자본적 장벽을 대폭 낮추고, 중소규모 기업도 현미경이나 로봇을 소유하지 않고도 대규모 라이브러리를 분석할 수 있도록 하고 있습니다. 다국적 기업들은 오프라인 시설 확충에서 포트폴리오의 요구에 따라 확장 가능한 유연한 AI 구독 서비스로 예산을 재분배하고 있으며, CRO는 이에 대응하여 표현형 프로파일링과 의약 화학을 결합한 턴키 방식의 자산 육성 서비스를 제공합니다. 이러한 변화들이 맞물려 성숙 시장 및 신흥 시장 전반에 걸쳐 지속적인 수요 성장을 뒷받침하고 있습니다.
AI를 활용한 이미지 분석의 발전
현재, 심층 컨볼루션 네트워크는 다중화된 형광 이미지에서 미묘한 형태학적 특징을 추출하여, 순위가 매겨진 화합물 중 상위 1%에 대한 히트 식별률을 23.8%까지 끌어올리고 있습니다. 각 벤더사는 사전 학습된 모델을 통합하고, 데이터 상주 요건을 충족하기 위한 On-Premise 추론 기능을 갖춘 플랫폼을 출시하고 있습니다. 제약 팀의 연구원들은 이러한 엔진을 활용하여 화합물과 반응 경로를 매핑하고, 기존 파이프라인에서는 불가능했던 단계보다 더 이른 시점에 경로 간의 상호작용이나 작용기전상의 문제점을 밝혀내고 있습니다. 그 결과, 사이클 타임 단축, 시약 사용량 최적화, 그리고 선도 화합물의 다양성 향상이 실현됩니다.
HCS 플랫폼의 고액 설비 투자
최첨단 자동 이미저, 로봇 및 환경 제어형 인큐베이터는 1세트당 300만 달러를 초과하는 경우가 있어, 자원이 제한적인 생명공학 기업에게는 도입 장벽이 되고 있습니다. 2025년 미국 생명과학 분야의 설비 설치 비용은 1제곱피트당 평균 846달러로 전년 대비 4.3% 상승하여 신축 예산을 압박하고 있습니다. 이러한 고액의 초기 비용 부담을 완화하기 위해 각 벤더사는 리스-투-오운(Lease-to-Own) 플랜, 모듈식 추가 기능, 그리고 수년에 걸친 프로젝트를 통해 비용을 분산시키는 성과 연동형 서비스 계약을 추진하고 있습니다. CRO(의약품 개발 수탁 기관)는 스크리닝별 과금 옵션을 제공함으로써 이러한 기회를 활용하고, 간헐적인 처리 능력이 필요한 고객을 위해 설비 투자(Capex)를 운영비(OpEx)로 효과적으로 전환하고 있습니다.
부문 분석
2025년, 장비는 HCS(High Content Screening) 시장 점유율의 45.98%를 차지할 것으로 예상되며, 이는 고해상도 광학 시스템 및 통합형 액체 처리 기술에 대한 꾸준한 수요를 반영합니다. 한편, 연구소들이 기존 하드웨어의 수명을 연장하는 AI 워크플로우를 우선시함에 따라, 소프트웨어 구독은 2031년까지 연평균 성장률(CAGR) 5.93%를 나타낼 것으로 예측됩니다. 소프트웨어에 기인한 HCS(High Content Screening) 시장 규모는 2031년까지 1억 8,300만 달러 증가할 것으로 예측되며, 그 주된 요인은 단계별 분석 패키지와 클라우드 컴퓨팅 크레딧 때문입니다. 요코가와(Yokogawa)의 ‘CellVoyager CQ3000’과 같은 주요 신제품은 듀얼 스피닝 디스크 공초점 모듈과 온보드 GPU를 결합한 반면,사르토리우스(Sartorius)의 ‘iQue 5 HTS’는 27채널의 세포측정 기능과 연속적인 무인 가동을 결합하고 있습니다. 액세서리와 시약은 한 자릿수 중반대의 꾸준한 성장을 유지하고 있는 반면, 서비스는 장비의 복잡화에 따라 확대되고 있으며, 라이프사이클 전반에 걸친 가동률 확보와 규제 대응 문서 작성을 보장하고 있습니다.
AI 파이프라인이 성숙해짐에 따라, 독립형 분석 제품군에는 컨테이너 오케스트레이션, 자동 버전 관리, 감사 대응 보고 기능이 통합되어 FDA 21 CFR Part 11 규정을 충족하고 있습니다. 하드웨어, 분석, 검증 서비스를 묶어 제공하는 벤더는 원스톱 파트너로서의 입지를 확립하여 수년에 걸친 정기적인 수익원을 확보하는 동시에 타사로의 전환 장벽을 높이고 있습니다.
지역별 분석
북미는 확립된 바이오의약품 클러스터와 견조한 벤처 자금 조달에 힘입어 2025년 매출의 41.78%를 차지했습니다. 아시아태평양은 2031년까지 연평균 성장률(CAGR) 6.17%를 나타낼 것으로 예측되며, 그 원동력은 중국의 IND 신청 건수가 2019년 688건에서 2023년 2,298건으로 급증하고 승인률이 83.5%에 달한 점입니다. 각 지역 정부는 GMP 준수 세포 제조 시설 및 디지털 규제 포털에 투자하고 있으며, 이를 통해 승인까지의 지연 시간이 단축되어 다국적 임상시험 후원사를 유치하고 있습니다.
유럽은 꾸준한 성장 궤도를 유지하고 있으며, 유럽 헬스 데이터 스페이스(European Health Data Space)가 임상, 영상, 분자 데이터 세트를 통합하는 상호 운용 가능한 AI 프로젝트를 추진하고 있습니다. 남미 및 중동 및 아프리카는 현지 수탁 연구 기관(CRO)들이 다국적 1상-3상 임상시험을 수용할 수 있는 역량을 확대함에 따라, 시장 점유율은 작지만 증가 추세를 보이고 있습니다.
기타 혜택:
- 엑셀 형식 시장 예측(ME) 시트
- 3개월간의 애널리스트 지원
자주 묻는 질문
목차
제1장 서론
제2장 조사 방법
제3장 주요 요약
제4장 시장 구도
제5장 시장 규모와 성장 예측
제6장 경쟁 구도
제7장 시장 기회와 향후 전망
LSH 26.08.24According to Mordor Intelligence, the high content screening market size is expected to grow from USD 2.02 billion in 2025 to USD 2.14 billion in 2026 and is forecast to reach USD 2.84 billion by 2031 at 5.83% CAGR over 2026-2031.
This report is Segmented by Product (Instruments, Consumables & Reagents, Software, Services, Accessories), Application (Primary & Secondary Screening, Target Identification & Validation, and More), End-User (Pharmaceutical & Biotechnology Companies, Contract Research Organizations, and More), and Geography (North America, Europe, and More). The Market Forecasts are Provided in Terms of Value (USD).
Global High Content Screening Market Trends and Insights
Cost-effective Drug Discovery Imperatives
Escalating R&D outlays and persistent late-stage attrition compel drug makers to embrace High Content Screening market solutions that streamline hit-to-lead decision making. Cloud labs drastically lower capital barriers by shifting image acquisition and analysis workloads to pay-as-you-go infrastructures, allowing smaller firms to interrogate large libraries without owning microscopes or robotics. Multinational sponsors reallocate budgets from brick-and-mortar buildouts toward flexible AI subscriptions that scale with portfolio needs, and CROs respond by bundling phenotypic profiling with medicinal chemistry to deliver turnkey asset incubation. Collectively, these shifts reinforce sustainable demand growth across mature and emerging economies.
AI-powered Image-analysis Advancements
Deep convolutional networks now extract subtle morphological signatures from multiplexed fluorescent images, lifting hit-identification rates to 23.8% within the top 1% of ranked compounds. Vendors launch platforms that embed pre-trained models and secure on-prem inference to satisfy data-residency mandates. Pharmaceutical teams leverage these engines to map compound-response trajectories, revealing pathway cross-talk and mechanistic liabilities earlier than legacy pipelines allowed. The net result is faster cycle times, optimized reagent usage, and enriched lead diversity.
High Capital Expenditure for HCS Platforms
State-of-the-art automated imagers, robotics, and controlled-environment incubators can exceed USD 3 million per suite, deterring adoption among resource-constrained biotechs. U.S. life-science fit-out costs averaged USD 846 per square foot in 2025, climbing 4.3% year over year and squeezing new-build budgets. To mitigate sticker shock, vendors promote lease-to-own plans, modular add-ons, and outcome-based service contracts that spread expenses across multiyear projects. CROs capitalize by offering pay-per-screen options, effectively converting capex to opex for clients needing episodic throughput.
Other drivers and restraints analyzed in the detailed report include:
- Oncology-focused Funding Surge for Cell-based Research
- Phenotypic Screening Adoption for 3D Organoids
- Shortage of Data-science Talent for HCS Analytics
For complete list of drivers and restraints, kindly check the Table Of Contents.
Segment Analysis
In 2025, instruments accounted for 45.98% of the High Content Screening market share, reflecting entrenched demand for high-resolution optics and integrated liquid-handling. Software subscriptions, however, post a 5.93% CAGR through 2031 as laboratories prioritize AI workflows that extend the productive life of existing hardware. The High Content Screening market size attributed to software is projected to add USD 183 million by 2031, largely through tiered analytics packages and cloud compute credits. Leading launches such as Yokogawa's CellVoyager CQ3000 pair dual spinning-disk confocal modules with onboard GPUs, while Sartorius' iQue 5 HTS marries 27-channel cytometry with continuous unattended runs. Accessories and reagents maintain steady mid-single-digit growth, while services expand in tandem with instrument complexity, ensuring lifecycle uptime and regulatory documentation.
As AI pipelines mature, stand-alone analysis suites integrate container orchestration, automated version control, and audit-ready reporting, meeting FDA 21 CFR Part 11 stipulations. Vendors who bundle hardware, analytics, and validation services position themselves as one-stop partners, locking in multi-year annuity streams and elevating switching barriers.
Complete Report Scope:
- By Product
- Instruments
- Cell Imaging and Analysis Systems
- Flow Cytometers
- Consumables & Reagents
- Reagents and Assay Kits
- Microplates
- Other Consumables
- Software
- Services
- Accessories
- Instruments
- By Application
- Primary & Secondary Screening
- Target Identification & Validation
- Toxicity Studies
- Compound Profiling
- Other Emerging Applications
- By End-User
- Pharmaceutical & Biotechnology Companies
- Contract Research Organizations (CROs)
- Academic & Government Institutes
- Other End-Users
- By Geography
- North America
- United States
- Canada
- Mexico
- Europe
- Germany
- United Kingdom
- France
- Italy
- Spain
- Rest of Europe
- Asia-Pacific
- China
- India
- Japan
- South Korea
- Australia
- Rest of Asia-Pacific
- South America
- Brazil
- Argentina
- Rest of South America
- Middle East and Africa
- GCC
- South Africa
- Rest of Middle East and Africa
- North America
Geography Analysis
North America generated 41.78% of 2025 revenues, anchored by entrenched biopharma clusters and robust venture funding. Asia-Pacific grows at 6.17% CAGR through 2031, powered by China's IND surge from 688 filings in 2019 to 2,298 in 2023 with 83.5% approval. Regional governments invest in GMP-compliant cell-manufacturing suites and digital regulatory portals, reducing approval latency and attracting multinational trial sponsors.
Europe maintains a steady expansion path, with the European Health Data Space fostering interoperable AI projects that integrate clinical, imaging, and molecular datasets. South America and Middle East & Africa collectively contribute a small but rising share as local contract sites expand capacity for multinational phase I-III trials.
- Thermo Fisher Scientific
- Danaher
- Revvity, Inc.
- GE HealthCare Technologies Inc.
- Beckton Dickinson
- Yokogawa Electric
- Agilent Technologies
- Olympus
- Sartorius
- Tecan Group
- Merck
- Bio-Rad Laboratories
- Huawei Technologies Co., Ltd. (HCS AI modules)
- Cell Signaling Technology
- ThermoGenesis
- Alpha-Med Scientific, Inc.
- Arrayjet Ltd.
- Bitplane AG (Oxford Instruments)
Additional Benefits:
- The market estimate (ME) sheet in Excel format
- 3 months of analyst support
TABLE OF CONTENTS
1 Introduction
2 Research Methodology
3 Executive Summary
4 Market Landscape
- 4.1 Market Overview
- 4.2 Market Drivers
- 4.2.1 Cost-effective drug discovery imperatives
- 4.2.2 AI-powered image-analysis advancements
- 4.2.3 Oncology-focused funding surge for cell-based research
- 4.2.4 Phenotypic screening adoption for 3D organoids
- 4.2.5 Cloud-connected HCS instruments enabling distributed labs
- 4.3 Market Restraints
- 4.3.1 High capital expenditure for HCS platforms
- 4.3.2 Shortage of data-science talent for HCS analytics
- 4.3.3 Massive image-data storage & compliance burdens
- 4.3.4 Inter-vendor software interoperability gaps
- 4.4 Value / Supply-Chain Analysis
- 4.5 Regulatory Landscape
- 4.6 Technological Outlook
- 4.7 Porter's Five Forces
- 4.7.1 Threat of New Entrants
- 4.7.2 Bargaining Power of Suppliers
- 4.7.3 Bargaining Power of Buyers
- 4.7.4 Threat of Substitutes
- 4.7.5 Competitive Rivalry
5 Market Size & Growth Forecasts (Value)
- 5.1 By Product
- 5.1.1 Instruments
- 5.1.1.1 Cell Imaging and Analysis Systems
- 5.1.1.2 Flow Cytometers
- 5.1.2 Consumables & Reagents
- 5.1.2.1 Reagents and Assay Kits
- 5.1.2.2 Microplates
- 5.1.2.3 Other Consumables
- 5.1.3 Software
- 5.1.4 Services
- 5.1.5 Accessories
- 5.1.1 Instruments
- 5.2 By Application
- 5.2.1 Primary & Secondary Screening
- 5.2.2 Target Identification & Validation
- 5.2.3 Toxicity Studies
- 5.2.4 Compound Profiling
- 5.2.5 Other Emerging Applications
- 5.3 By End-User
- 5.3.1 Pharmaceutical & Biotechnology Companies
- 5.3.2 Contract Research Organizations (CROs)
- 5.3.3 Academic & Government Institutes
- 5.3.4 Other End-Users
- 5.4 By Geography
- 5.4.1 North America
- 5.4.1.1 United States
- 5.4.1.2 Canada
- 5.4.1.3 Mexico
- 5.4.2 Europe
- 5.4.2.1 Germany
- 5.4.2.2 United Kingdom
- 5.4.2.3 France
- 5.4.2.4 Italy
- 5.4.2.5 Spain
- 5.4.2.6 Rest of Europe
- 5.4.3 Asia-Pacific
- 5.4.3.1 China
- 5.4.3.2 India
- 5.4.3.3 Japan
- 5.4.3.4 South Korea
- 5.4.3.5 Australia
- 5.4.3.6 Rest of Asia-Pacific
- 5.4.4 South America
- 5.4.4.1 Brazil
- 5.4.4.2 Argentina
- 5.4.4.3 Rest of South America
- 5.4.5 Middle East and Africa
- 5.4.5.1 GCC
- 5.4.5.2 South Africa
- 5.4.5.3 Rest of Middle East and Africa
- 5.4.1 North America
6 Competitive Landscape
- 6.1 Market Concentration
- 6.2 Market Share Analysis
- 6.3 Company Profiles (includes Global level Overview, Market level overview, Core Segments, Financials as available, Strategic Information, Market Rank/Share for key companies, Products & Services, and Recent Developments)
- 6.3.1 Thermo Fisher Scientific Inc.
- 6.3.2 Danaher Corporation
- 6.3.3 Revvity, Inc.
- 6.3.4 GE HealthCare Technologies Inc.
- 6.3.5 Becton, Dickinson and Company
- 6.3.6 Yokogawa Electric Corporation
- 6.3.7 Agilent Technologies Inc.
- 6.3.8 Olympus Corporation
- 6.3.9 Sartorius AG
- 6.3.10 Tecan Group Ltd.
- 6.3.11 Merck KGaA
- 6.3.12 Bio-Rad Laboratories, Inc.
- 6.3.13 Huawei Technologies Co., Ltd. (HCS AI modules)
- 6.3.14 Cell Signaling Technology, Inc.
- 6.3.15 ThermoGenesis Holdings, Inc.
- 6.3.16 Alpha-Med Scientific, Inc.
- 6.3.17 Arrayjet Ltd.
- 6.3.18 Bitplane AG (Oxford Instruments)
7 Market Opportunities & Future Outlook
- 7.1 White-space & Unmet-Need Assessment


