

|
시장보고서
상품코드
2113350
탄소 관리 소프트웨어 : 시장 점유율 분석, 업계 동향과 통계, 성장 예측(2026-2031년)Carbon Management Software - Market Share Analysis, Industry Trends & Statistics, Growth Forecasts (2026 - 2031) |
||||||
 Mordor Intelligence
Mordor Intelligence에 따르면 탄소 관리 소프트웨어 시장 규모는 2026년에 181억 7,000만 달러로 추정되며, 예측 기간(2026-2031년) 동안 CAGR 11.63%를 기록하며 2031년까지 315억 달러에 달할 것으로 전망됩니다.
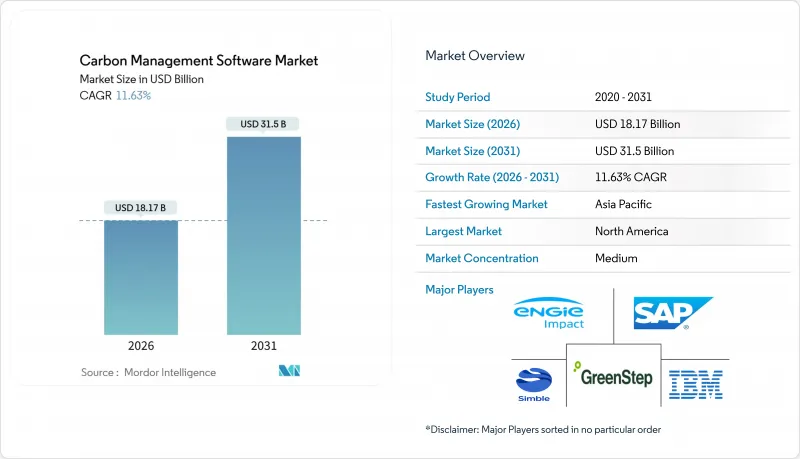
본 보고서는 제공 형태(소프트웨어 및 서비스), 도입 형태(클라우드형 및 온프레미스형), 용도(에너지, 온실가스 관리, 지속가능성 등), 최종사용자 산업(석유·가스, 제조, 의료 등), 조직 규모(대기업 및 중소기업), 그리고 지역별로 분류되어 있습니다. 시장 전망은 금액(달러) 기준으로 제시되어 있습니다.
세계 탄소 관리 소프트웨어 시장의 동향 및 인사이트
탄소 공시 규제의 강화
2024년 3월 SEC 규정에 따라, 2025년 상반기 미국 내 감사 대응 플랫폼에 대한 수요가 전년 동기 대비 40% 급증했습니다. 이와 더불어, 2025 회계연도 제출분부터 약 5만 개의 유럽 기업으로 보고 의무를 확대하는 ‘기업 지속가능성 보고 지침’에서도 유사한 압박이 가해지고 있습니다. 따라서 다국적 기업들은 데이터 수집의 중복을 초래하지 않으면서도 서로 다른 관할권의 템플릿을 전환할 수 있는 멀티테넌트형 솔루션을 요구하고 있습니다. 분기 결산 보고서에 탄소 지표를 포함하고 있는 조기 도입 기업들은 스프레드시트에 의존하는 후발 기업들에 비해 외부 보증 비용을 25% 절감하고 있습니다. 현재 경쟁 우위는 공급업체가 규제 당국과 투자자 양측을 대상으로 규칙 라이브러리를 얼마나 신속하게 업데이트하고, 위조 불가능한 감사 추적을 유지할 수 있는지에 달려 있습니다.
기업의 넷제로 공약과 ESG에 대한 압력
시가총액 70조 달러를 초과하는 4,000개 이상의 기업이 넷제로 목표를 설정하고 있지만, 중간 단계의 진척 상황을 추적할 수 있을 만큼 상세한 인벤토리를 유지하고 있는 기업은 5개사 중 1개사 미만입니다. 130조 달러를 운용하는 자산운용사는 포트폴리오 기업에 스코프 3 배출량의 완전한 공개를 요구하고 있으며, 탄소 투명성은 자금 조달의 가정이 되고 있습니다. 그 결과, 특히 자동차 및 소비재 분야에서 1차 제조업체가 표준화된 API를 통해 제품 수준의 데이터를 확보할 수 있는 공급업체 포털이 급속히 확산되고 있습니다. 검증된 배출 감축 실적은 더 저렴한 비용의 지속가능성 연계형 대출을 가능하게 하며, 이 시장의 2024년 신규 발행액은 4,500억 달러를 넘어섰습니다. 브랜드 리스크와 인재 리스크도 또 다른 과제로 대두되고 있습니다. 2025년 조사에 따르면, 밀레니얼 세대의 62%가 신뢰할 수 있는 탈탄소화 계획을 갖추지 않은 고용주를 기피하는 것으로 나타났습니다.
중소기업에 대한 높은 도입 및 통합 비용
초기 비용은 통합 및 교육을 포함하면 5만 달러에서 20만 달러에 달하며, 직원 500명 미만의 기업에서는 연간 IT 예산의 2-5%에 해당합니다. 레거시 ERP(기업 자원 계획) 플랫폼을 위한 맞춤형 API를 도입하면 프로젝트 비용이 30-50% 증가하고, 투자 회수 기간이 12개월을 초과할 가능성이 있습니다. 사내에 지속가능성 전문 인력이 부족하기 때문에 시간당 150-300달러의 보수를 청구하는 컨설턴트에 의존할 수밖에 없습니다. 또한, 간격별로 측정된 에너지 데이터가 부족하여 보고되는 탄소발자국의 불확실성이 높아지고 있습니다. 프리미엄 플랜이나 모듈식 가격 책정이 등장하고 있지만, 자금 조달 프로그램은 여전히 소프트웨어 구독이 아닌 유형 자산에 중점을 두고 있어 자금 사정이 어려운 기업에서의 도입 진전은 더딘 편입니다.
부문별 분석
서비스 부문은 2025년 매출의 31.7%를 차지했으나, 기업이 사내 팀 인력 확보가 어려운 데이터 엔지니어링 및 보증 업무를 외부에 위탁함에 따라 12.1%라는 가장 높은 연평균 성장률(CAGR)을 기록할 것으로 예측됩니다. API 구축, ERP 커넥터 설정, 데이터 마이그레이션이 서비스 매출의 약 40%를 차지하고 있습니다. 자원이 제한적인 기업들은 배출 계수 라이브러리를 최신 상태로 유지하고 보고 서류 작성도 대행해 주는 벤더를 선호하기 때문에 매니지드 서비스가 성장하고 있습니다. 교육 및 변경 관리 지원을 통해 도입에 성공한 사례에서는 사용자 도입률이 80%를 초과하고 있습니다. 검증된 배출 감축량에 요금을 연동하는 성과 연동형 가격 책정이 정착되고 있지만, 측정 및 귀속 판단에 대해서는 여전히 논의의 여지가 있습니다. 이러한 모델이 성숙해짐에 따라 탄소 관리 소프트웨어 시장에서는 서비스 제공업체가 일회성 프로젝트가 아닌 고객의 장기적인 워크플로우에 깊이 통합되면서 경상 수익의 가시성이 향상되고 있습니다.
다국적 기업이 미국, EU, 아시아태평양의 규제를 동시에 준수해야 하는 경우, 컨설팅 부문은 프리미엄 요금을 책정하고 있습니다. 투자자들이 ‘기업 지속가능성 보고 지침(CSRD)’에 따라 독립적인 검증을 요구하게 되면서, 제3자 보증은 고성장 틈새 시장으로 부상하고 있습니다. 이러한 동향들이 맞물리면서, 서비스는 단순한 지원 역할에서 핵심 성장 동력으로 격상되어 탄소 관리 소프트웨어의 총 잠재 시장(TAM)을 확대하고 있습니다.
2025년 매출에서 클라우드 도입이 차지하는 비중은 73.7%에 달했으며, 2031년까지 연평균 성장률(CAGR) 11.9%를 유지할 것으로 전망됩니다. 멀티테넌트 아키텍처를 통해 사용자당 비용을 최대 60% 절감할 수 있을 뿐만 아니라, 규칙 라이브러리가 자동으로 업데이트되므로 고객은 진화하는 공시 프레임워크에 항상 대응할 수 있습니다. 또한, 하이퍼스케일 인프라는 AI를 활용한 Scope 3 추정 및 실시간 분석에 필요한 연산 능력도 제공합니다. 데이터 보존 요건의 적용을 받는 규제 대상 공익 사업체나 은행의 경우, 하이브리드 모델을 통해 기밀성이 높은 운영 데이터를 온프레미스에 저장하는 한편, 익명화된 집계 데이터를 클라우드로 전송하여 처리합니다. 온프레미스의 점유율은 여전히 26.3%를 차지하고 있지만, 각 벤더들이 영구 라이선스 제공 종료를 발표하고 원활한 전환을 위한 전환 크레딧을 제공하고 있어 그 점유율은 해마다 줄어들고 있습니다. 이러한 변화로 인해 탄소 관리 소프트웨어 시장은 구독 수익 및 지속적인 제공을 지향하는 보다 광범위한 엔터프라이즈 소프트웨어의 동향과 보조를 맞추고 있습니다.
철강 및 화학 산업에서는 엣지 배포가 탄력을 받고 있습니다. 이 산업들에서는 지연 없는 분석 데이터를 통해 용광로 적재량이 최적화되어 에너지 낭비가 10-15% 감소하고 있습니다. 5G 네트워크가 성숙해짐에 따라, 각 벤더들은 엣지 네이티브 모듈을 통해 중공업이 대역폭 제약에서 해방될 것으로 기대하고 있습니다. 하지만 공급망 데이터의 집계나 투자자 보고를 위해서는 전 세계 어디서나 접근 가능한 플랫폼이 필요하기 때문에 클라우드는 여전히 핵심적인 역할을 수행하고 있습니다.
지역별 분석
북미는 조기 규제 조치와 기후 분석 분야의 스타트업 설립을 가속화한 풍부한 벤처 캐피탈에 힘입어 2025년 매출의 35.85%를 계속 차지했습니다. 미국의 대기업들은 탄소 IT 스택에 연간 200만-500만 달러를 투자하고 있으며, 캐나다의 연방 탄소 가격 책정 체계가 국내 수요의 견조함을 유지하고 있습니다. 그러나 탄소 관리 소프트웨어 시장에서는 성장세가 동쪽으로 이동하고 있습니다.
유럽은 ‘기업 지속가능성 보고 지침(CSRD)’ 및 수출업자에게 ‘크래들 투 게이트(Cradle-to-Gate)’ 배출량 문서를 의무화하고, 위반 시 관세를 부과하는 ‘탄소 국경 조정 메커니즘(CBAM)’ 도입을 앞두고 있는 것을 배경으로 약 30%의 점유율을 유지했습니다. 독일, 영국, 프랑스가 지역 전체 지출의 60%를 차지하고 있는데, 이는 본사 기능이 데이터 거버넌스를 일원화하고 있기 때문입니다. 해당 지침의 역외 적용으로 인해 EU 역외 공급업체들도 호환 가능한 플랫폼으로의 전환을 강요받고 있으며, 이는 간접적으로 시장 범위를 확대시키고 있습니다.
아시아태평양은 중국의 ‘이산화탄소 배출 정점 달성 및 탄소 중립’ 목표와 인도의 에너지 전환 로드맵에 힘입어 연평균 성장률(CAGR) 11.85%로 가장 빠르게 성장하고 있습니다. 일본의 ‘그린 트랜스포메이션 펀드’와 한국의 배출권 거래 의무도 추가적인 견인력이 되고 있습니다. 싱가포르를 필두로 한 동남아시아국가연합(ASEAN) 회원국들은 상장 기업에 대한 보고를 의무화하여, 수출 지향형 공급망 전반에 걸친 도입을 촉진하고 있습니다. 호주와 뉴질랜드는 오랜 기간 운영되어 온 배출권 거래 제도 덕분에 이미 북미와 동등한 도입 수준을 보이고 있습니다.
남미는 매출의 8%를 차지하고 있으며, 브라질의 산림 벌채 모니터링과 아르헨티나의 재생에너지 확대가 견인 역할을 하고 있습니다. 중동 및 아프리카는 10%를 차지하고 있으며, 걸프 지역 에너지 대기업들의 탄소 중립 공약과 남아프리카공화국 및 나이지리아의 탄소세 제도가 기반이 되고 있습니다. 기반이 작아 절대적인 매출액은 적지만, 에너지 다각화 정책과 투자자들의 엄격한 감시가 맞물려 두 지역 모두 평균을 상회하는 프로젝트 수 증가세를 보이고 있습니다.
기타 혜택:
- 엑셀 형식의 시장 예측(ME) 시트
- 3개월간의 애널리스트 지원
자주 묻는 질문
목차
제1장 소개
제2장 조사 방법
제3장 주요 요약
제4장 시장 구도
제5장 시장 규모와 성장 예측
제6장 경쟁 구도
제7장 시장 기회와 향후 전망
KSM 26.08.25According to Mordor Intelligence, the carbon management software market size is estimated at USD 18.17 billion in 2026, and is expected to reach USD 31.5 billion by 2031, at a CAGR of 11.63% during the forecast period (2026-2031).
This report is Segmented by Offering (Software and Services), Deployment Mode (Cloud-Based and On-Premise), Application (Energy, Greenhouse Gas Management, Sustainability, and More), End-User Industry (Oil and Gas, Manufacturing, Healthcare, and More), Organization Size (Large Enterprises and Small and Medium Enterprises), and Geography. The Market Forecasts are Provided in Terms of Value (USD).
Global Carbon Management Software Market Trends and Insights
Stricter Carbon-Disclosure Regulations
The March 2024 SEC rule triggered a 40% year-over-year surge in U.S. demand for audit-ready platforms during 1H 2025. Parallel pressure stems from the Corporate Sustainability Reporting Directive, which extends mandatory reporting to roughly 50,000 European companies starting with fiscal 2025 filings. Multinationals, therefore, need multi-tenant solutions that toggle between divergent jurisdictional templates without duplicating data collection. Early adopters embedding carbon metrics into quarterly close reports have 25% lower external assurance costs compared with spreadsheet-based late movers. Competitive advantage now hinges on how quickly a vendor updates rule libraries and maintains immutable audit trails for regulators and investors alike.
Corporate Net-Zero Commitments and ESG Pressure
More than 4,000 companies with a market capitalization of USD 70 trillion have set net-zero targets, yet fewer than 1 in 5 maintain inventories granular enough to track progress against interim milestones. Asset managers overseeing USD 130 trillion expect portfolio firms to disclose full Scope-3 emissions, making carbon transparency a capital-access prerequisite. Supplier portals that enable tier-one manufacturers to pull product-level data via standardized APIs are therefore proliferating, especially in automotive and consumer goods. Verified reductions unlock cheaper sustainability-linked loans, a market that exceeded USD 450 billion in new issuance during 2024. Brand and talent risks add another layer: a 2025 survey found 62% of millennials shun employers without credible decarbonization plans.
High Implementation and Integration Costs for SMEs
Initial outlays range from USD 50,000 to USD 200,000, once integration and training are included, equal to 2-5% of a firm's annual IT budget for firms with fewer than 500 staff. Custom APIs for legacy enterprise resource planning platforms can add 30-50% to project costs and push payback beyond 12 months. Limited in-house sustainability talent forces reliance on consultants billing USD 150-USD 300 per hour, while the absent of interval-metered energy data inflates uncertainty in reported footprints. Freemium tiers and modular pricing are emerging, but financing programs still focus on physical assets rather than software subscriptions, slowing uptake among capital-constrained firms.
Other drivers and restraints analyzed in the detailed report include:
- AI-Driven Scope-3 Data Harmonization
- Cost Savings from Energy-Efficiency and Cloud Migration
- Data-Accuracy and Standardization Challenges
For complete list of drivers and restraints, kindly check the Table Of Contents.
Segment Analysis
Services captured 31.7% of 2025 revenue, but they are forecast to post the fastest 12.1% CAGR, as enterprises outsource data engineering and assurance tasks that internal teams struggle to staff. API build work, ERP connector setup, and data migration account for roughly 40% of service billings. Managed services are growing because resource-constrained companies prefer vendors that keep their emission-factor libraries up to date and prepare filings. Training and change-management support drive user adoption rates above 80% in successful rollouts. Outcome-based pricing that links fees to verified reductions is taking hold, though measurement and attribution remain contentious. As these models mature, the carbon management software market sees service providers embedding themselves in long-term client workflows rather than on one-off projects, boosting visibility into recurring revenue.
The consulting component commands premium rates when multinationals juggle U.S., EU, and Asia-Pacific regulations. Third-party assurance is a high-growth niche because investors now demand independent verification under the Corporate Sustainability Reporting Directive. Combined, these trends elevate services from a supporting role to a central growth lever, widening the total addressable market for carbon management software.
Cloud installations accounted for 73.7% of 2025 billings and are expected to maintain an 11.9% CAGR through 2031. Multi-tenant architectures cut per-user costs by up to 60% and automatically update the rule library, keeping customers current with evolving disclosure frameworks. Hyperscale infrastructure also supplies the compute needed for AI-driven Scope-3 estimation and real-time analytics. For regulated utilities and banks subject to data-residency mandates, hybrid models store sensitive operational data on-premise while dispatching anonymized aggregates to the cloud for processing. Although on-premises still holds a 26.3% share, its footprint shrinks each year as vendors announce the end of life for perpetual licenses, offering migration credits to cushion the transition. This shift keeps the carbon management software market aligned with broader enterprise-software trends toward subscription revenue and continuous delivery.
Edge deployments are gaining traction in steel and chemicals, where latency-free insights optimize furnace loads and cut energy waste by 10-15%. As 5G networks mature, vendors expect edge-native modules to free heavy industry from bandwidth constraints. Nonetheless, cloud remains the backbone because supply-chain data aggregation and investor reporting need globally accessible platforms.
Complete Report Scope:
- By Offering
- Software
- Services
- By Deployment Mode
- Cloud-Based
- On-Premise
- By Application
- Energy
- Greenhouse Gas Management
- Air Quality Management
- Sustainability
- Other Applications
- By End-User Industry
- Oil and Gas
- Manufacturing
- Healthcare
- IT and Telecom
- Power and Utilities
- Transportation and Logistics
- Construction and Infrastructure
- Other End-User Industries
- By Organization Size
- Large Enterprises
- Small and Medium Enterprises
- By Geography
- North America
- United States
- Canada
- Mexico
- South America
- Brazil
- Argentina
- Rest of South America
- Europe
- Germany
- United Kingdom
- France
- Italy
- Spain
- Russia
- Rest of Europe
- Asia-Pacific
- China
- Japan
- India
- South Korea
- ASEAN
- Australia and New Zealand
- Rest of Asia-Pacific
- Middle East and Africa
- Middle East
- Saudi Arabia
- United Arab Emirates
- Turkey
- Rest of Middle East
- Africa
- South Africa
- Nigeria
- Rest of Africa
- Middle East
- North America
Geography Analysis
North America retained 35.85% of 2025 turnover, buoyed by early regulatory moves and abundant venture capital that accelerated the formation of start-ups in climate analytics. Large U.S. corporates devote USD 2-USD 5 million annually to carbon-IT stacks, and Canada's federal carbon-pricing framework keeps domestic demand resilient. Yet the carbon management software market is seeing a shift in momentum toward the East.
Europe held a roughly 30% share on the back of the Corporate Sustainability Reporting Directive and the looming Carbon Border Adjustment Mechanism, which forces exporters to document cradle-to-gate emissions or face tariffs. Germany, the United Kingdom, and France account for 60% of regional spend, as headquarters functions centralize data governance. The directive's extraterritorial reach nudges non-EU suppliers toward compatible platforms, indirectly enlarging market scope.
Asia-Pacific is the fastest riser with an 11.85% CAGR, propelled by China's dual-carbon goals and India's energy-transition roadmap. Japan's Green Transformation Fund and South Korea's emissions-trading obligations add further pull. Association of Southeast Asian Nations members, led by Singapore, mandate reporting for listed companies, spurring adoption across export-oriented supply chains. Australia and New Zealand already show uptake levels akin to those in North America, thanks to long-standing cap-and-trade schemes.
South America accounts for 8% of revenue, led by Brazil's deforestation monitoring and Argentina's renewable build-out. The Middle East and Africa contribute 10%, anchored by net-zero pledges from Gulf energy giants and carbon-tax frameworks in South Africa and Nigeria. Though smaller bases temper absolute revenues, both regions show above-average pipeline growth as energy diversification policies and investor scrutiny converge.
- IBM Corporation
- SAP SE
- ENGIE Impact
- Simble Solutions Ltd
- GreenStep Solutions Inc.
- Microsoft Corporation
- Schneider Electric SE
- Salesforce.com Inc.
- Greenstone + Ltd
- Sphera Solutions
- Enablon SA (Wolters Kluwer)
- IsoMetrix
- Persefoni AI
- Watershed Technology Inc.
- Plan A
- Net0
- Sinai Technologies Inc.
- Workiva Inc.
- Brightly Software
- Terrascope Pte Ltd
- Carbmee GmbH
- Diligent Corporation
- Emitwise
- Sweep SAS
- Greenly
Additional Benefits:
- The market estimate (ME) sheet in Excel format
- 3 months of analyst support
TABLE OF CONTENTS
1 INTRODUCTION
- 1.1 Study Assumptions and Market Definition
- 1.2 Scope of the Study
2 RESEARCH METHODOLOGY
3 EXECUTIVE SUMMARY
4 MARKET LANDSCAPE
- 4.1 Market Overview
- 4.2 Market Drivers
- 4.2.1 Stricter Carbon-Disclosure Regulations (SEC, CSRD)
- 4.2.2 Corporate Net-Zero Commitments and ESG Pressure
- 4.2.3 Cost Savings from Energy-Efficiency and Cloud Migration
- 4.2.4 AI-Driven Scope-3 Data Harmonization Unlocks ESG Finance
- 4.2.5 Tokenized Carbon-Credit Integration into EMS Platforms
- 4.2.6 Mandated Digital Product Passports for Scope-3 Traceability
- 4.3 Market Restraints
- 4.3.1 High Implementation and Integration Costs for SMEs
- 4.3.2 Data-Accuracy and Standardization Challenges
- 4.3.3 Vendor Lock-In Risk from Proprietary Emission Factors
- 4.3.4 Cyber-Security Liabilities in Audit-Grade Data Trails
- 4.4 Impact of Macroeconomic Factors on the Market
- 4.5 Industry Value Chain Analysis
- 4.6 Regulatory Landscape
- 4.7 Technological Outlook
- 4.8 Porter's Five Forces Analysis
- 4.8.1 Bargaining Power of Suppliers
- 4.8.2 Bargaining Power of Buyers
- 4.8.3 Threat of New Entrants
- 4.8.4 Threat of Substitutes
- 4.8.5 Intensity of Competitive Rivalry
- 4.9 Other Structural Analyses
- 4.9.1 Investment and Funding Trends
- 4.9.2 Patent Landscape
5 MARKET SIZE AND GROWTH FORECASTS (VALUE)
- 5.1 By Offering
- 5.1.1 Software
- 5.1.2 Services
- 5.2 By Deployment Mode
- 5.2.1 Cloud-Based
- 5.2.2 On-Premise
- 5.3 By Application
- 5.3.1 Energy
- 5.3.2 Greenhouse Gas Management
- 5.3.3 Air Quality Management
- 5.3.4 Sustainability
- 5.3.5 Other Applications
- 5.4 By End-User Industry
- 5.4.1 Oil and Gas
- 5.4.2 Manufacturing
- 5.4.3 Healthcare
- 5.4.4 IT and Telecom
- 5.4.5 Power and Utilities
- 5.4.6 Transportation and Logistics
- 5.4.7 Construction and Infrastructure
- 5.4.8 Other End-User Industries
- 5.5 By Organization Size
- 5.5.1 Large Enterprises
- 5.5.2 Small and Medium Enterprises
- 5.6 By Geography
- 5.6.1 North America
- 5.6.1.1 United States
- 5.6.1.2 Canada
- 5.6.1.3 Mexico
- 5.6.2 South America
- 5.6.2.1 Brazil
- 5.6.2.2 Argentina
- 5.6.2.3 Rest of South America
- 5.6.3 Europe
- 5.6.3.1 Germany
- 5.6.3.2 United Kingdom
- 5.6.3.3 France
- 5.6.3.4 Italy
- 5.6.3.5 Spain
- 5.6.3.6 Russia
- 5.6.3.7 Rest of Europe
- 5.6.4 Asia-Pacific
- 5.6.4.1 China
- 5.6.4.2 Japan
- 5.6.4.3 India
- 5.6.4.4 South Korea
- 5.6.4.5 ASEAN
- 5.6.4.6 Australia and New Zealand
- 5.6.4.7 Rest of Asia-Pacific
- 5.6.5 Middle East and Africa
- 5.6.5.1 Middle East
- 5.6.5.1.1 Saudi Arabia
- 5.6.5.1.2 United Arab Emirates
- 5.6.5.1.3 Turkey
- 5.6.5.1.4 Rest of Middle East
- 5.6.5.2 Africa
- 5.6.5.2.1 South Africa
- 5.6.5.2.2 Nigeria
- 5.6.5.2.3 Rest of Africa
- 5.6.5.1 Middle East
- 5.6.1 North America
6 COMPETITIVE LANDSCAPE
- 6.1 Market Concentration
- 6.2 Strategic Moves
- 6.3 Market Share Analysis
- 6.4 Company Profiles (includes Global level Overview, Market Level Overview, Core Segments, Financials as Available, Strategic Information, Market Rank/Share for Key Companies, Products and Services, and Recent Developments)
- 6.4.1 IBM Corporation
- 6.4.2 SAP SE
- 6.4.3 ENGIE Impact
- 6.4.4 Simble Solutions Ltd
- 6.4.5 GreenStep Solutions Inc.
- 6.4.6 Microsoft Corporation
- 6.4.7 Schneider Electric SE
- 6.4.8 Salesforce.com Inc.
- 6.4.9 Greenstone + Ltd
- 6.4.10 Sphera Solutions
- 6.4.11 Enablon SA (Wolters Kluwer)
- 6.4.12 IsoMetrix
- 6.4.13 Persefoni AI
- 6.4.14 Watershed Technology Inc.
- 6.4.15 Plan A
- 6.4.16 Net0
- 6.4.17 Sinai Technologies Inc.
- 6.4.18 Workiva Inc.
- 6.4.19 Brightly Software
- 6.4.20 Terrascope Pte Ltd
- 6.4.21 Carbmee GmbH
- 6.4.22 Diligent Corporation
- 6.4.23 Emitwise
- 6.4.24 Sweep SAS
- 6.4.25 Greenly
7 MARKET OPPORTUNITIES AND FUTURE OUTLOOK
- 7.1 White-space and Unmet-Need Assessment


