

|
시장보고서
상품코드
2113539
북미의 배터리 : 시장 점유율 분석, 업계 동향 및 통계, 성장 예측(2026-2031년)North America Battery - Market Share Analysis, Industry Trends & Statistics, Growth Forecasts (2026 - 2031) |
||||||
 Mordor Intelligence
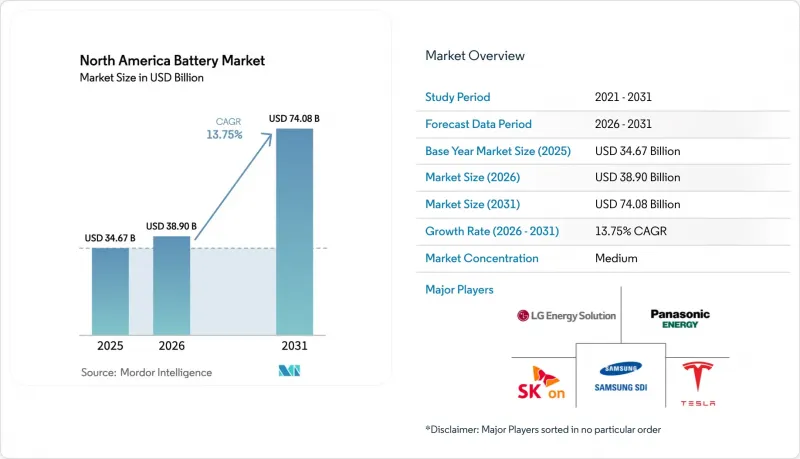
Mordor Intelligence에 의하면, 북미의 배터리 시장 규모는 2025년에 346억 7,000만 달러, 2026년에 389억 달러에 이르고, 2031년까지 740억 8,000만 달러에 이를 것으로 예측되며, 2026-2031년 CAGR 13.75%를 기록할 전망입니다.
본 보고서는 배터리 유형(1차 전지 및 2차 전지), 기술(납축전지, 리튬이온전지, 니켈-금속 수소 전지, 니켈-카드뮴 전지, 나트륨-황 전지, 전고체 전지, 플로우 배터리 및 신흥 화학계 전지),용도(자동차, 산업용, 휴대용 기기, 전동 공구, SLI 등), 지역(미국, 캐나다, 멕시코)별로 분류되어 있습니다. 시장 규모 및 전망은 금액(달러) 기준으로 표시되어 있습니다.
북미의 배터리 시장 동향 및 인사이트
IRA에 힘입은 기가팩토리 건설 확대로 배터리 팩 비용 절감
인플레이션 감축법(IRA) 제45X조에서는 국내에서 제조된 셀에 대해 1kW시당 35달러,모듈의 경우 1kW시당 10달러의 보조금이 지급되도록 되어 있으며, 이러한 제도를 통해 2022년 이후 13개 주에서 총 1,100억 달러 규모의 배터리 투자가 발표되었습니다. BlueOval SK는 켄튀르키예주와 테네시주에 건설할 두 공장에 대해 에너지부로부터 96억 달러의 대출을 확보했으며, 첫 번째 생산 라인은 2025년 하반기에 가동을 시작할 예정입니다. 파나소닉은 2025년에 캔자스주 데소토 시설의 생산 능력을 30기가와트시로 확대할 예정이며, 한편 삼성SDI와 제너럴 모터스는 2026년 가동 개시를 목표로 인디애나주의 건설 부지에서 착공했습니다. 이러한 프로젝트를 통해 손익분기점이 되는 가동률 기준치가 80%에서 60%로 낮아지고, 가동 시작 일정이 앞당겨지는 동시에 2022년부터 2027년에 걸쳐 배터리 팩 비용이 40% 하락할 것으로 예측됩니다. 비용이 낮아짐에 따라 전기차(EV)와 내연기관 차량 간의 총 소유 비용(TCO) 균형은 빠르면 2027년에 달성될 것으로 예상되며, 이는 많은 자동차 제조업체들이 당초 예상했던 시기보다 무려 2년이나 앞당겨진 것입니다.
OEM공급망 리스크를 완화하는 온쇼어링 인센티브
각 자동차 제조업체는 2021년부터 2022년에 걸친 반도체 부족 사태 당시, 23억 달러의 추가 물류 비용을 부담했습니다. 이를 계기로 운송 혼란과 관세 리스크를 완화하기 위해 지역별 배터리 생산으로의 전환이 추진되고 있습니다. 2024년 1월 발효되는 IRA(인플레이션 억제법)의 ‘우려 대상 외국 기업’ 관련 규정에 따라, 배터리나 중요 광물이 중국 또는 러시아 기업으로부터 공급되는 경우, 전기차는 7,500달러의 소비자 세액 공제 대상에서 제외됩니다. 이에 따라 공급업체 재선정이 진행되고 있습니다. Ultium Cells는 현재 총 140기가와트시의 생산 능력을 갖춘 3개의 미국 공장을 운영하고 있으며, 배터리 셀 리드타임을 12주에서 4주로 단축하고 운전 자금 수요를 약 20% 절감했습니다. 이에 이어 스텔란티스와 삼성SDI는 풀사이즈 픽업 트럭공급을 확보하기 위해 73억 달러 규모의 코코모 공장을 건설했습니다. 이러한 수직 통합 모델을 통해 OEM의 프로그램은 환율 변동이나 물류 병목 현상으로부터 보호받으며, 전기차 생산 확대기에도 이익률을 유지할 수 있게 됩니다.
리튬 가격 변동이 프로젝트의 IRR(내부수익률) 변동 폭을 확대
탄산리튬 현물 가격은 2022년 말 톤당 8만 달러에서 2024년 6월까지 1만 2,000달러로 급락한 후, 12월까지 1만 5,000달러로 반등했습니다. 이러한 롤러코스터와 같은 가격 변동으로 인해 배터리 팩의 수익성에 12%-15%의 스프레드가 발생했습니다. 제너럴 모터스(GM)의 ‘사커 패스(Soccer Pass)’ 합작 사업은 2027년까지 연간 4만 메트르톤을 확보하는 것을 목표로 하고 있으며, 이를 통해 연간 80만 대의 차량을 현물 가격 변동으로부터 보호하게 됩니다. 그러나 프로젝트의 내부수익률(IRR)은 여전히 매우 민감한 상태이며, 가격이 1만 8,000달러 아래로 계속 유지될 경우 투자 회수 기간이 10년 이상으로 늘어날 가능성이 있어, 중견 배터리 제조업체에 대한 은행 대출이 지연될 우려가 있습니다. 자체 리튬 조달원을 보유하지 않은 중소기업들은 대출 기관이 요구하는 80%의 구매 할당량을 충족하는 데 어려움을 겪고 있으며, 이는 신규 공장 건설을 억제하고 단기적인 생산 능력 확대에 큰 걸림돌이 되고 있습니다.
부문별 분석
2025년, 2차 충전식 배터리는 북미의 배터리 시장 점유율의 75.5%를 차지할 것으로 예상되며, 2031년까지 연평균 성장률(CAGR) 15.5%로 확대될 것으로 전망됩니다. 이러한 성장 추세는 전기차(EV) 및 가정용 에너지 저장 시스템의 도입이 급증하고 있음을 반영한 것으로, 이들 모두는 긴 수명과 수년에 걸친 보증이 필요하기 때문에 리튬 이온 배터리가 유리합니다. 전기 트럭의 평균 배터리 팩 용량은 2025년에 78kW시에 달하여, 대당 셀 수요를 끌어올리고 기가팩토리의 가동률 향상을 가속화했습니다. 1차 전지는 매출의 24.5%를 차지하고 있지만, 성장률은 한 자릿수에 그치고 있으며, 재충전성보다는 수십년단위의 보관 기간이 중시되는 의료, 국방, IoT와 같은 틈새 시장에 국한되어 있습니다. 업계 재편 동향은 하위 부문에 따라 다릅니다. 듀라셀과 에너자이저는 소비자용 알칼리 전지 분야에서 브랜드력을 유지하고 있는 반면, 자동차 OEM 각사는 리튬이온 전지의 자체 생산을 확대하고 있어, 이로 인해 독립 공급업체의 이익률이 압박받고 있습니다.
단위 경제성도 갈라지고 있습니다. 테슬라의 사내 생산 라인 ‘4680’은 2025년 9월까지 10기가와트시의 생산 속도에 도달하여,외부에서 조달한 2170 셀과 비교해 kW시당 비용을 15% 절감하는 동시에, 기존에는 공급업체에 귀속되던 업스트림 단계의 부가가치를 자체적으로 확보하고 있습니다. 소규모 1차 전지 공급업체들은 2024년 미국 국방부의 조달액이 12% 증가한 혜택을 누렸습니다. 이는 성능이 극히 중요한 틈새 시장에서는 판매량 증가세가 둔화되더라도 여전히 안정적인 이익률을 확보할 수 있음을 보여줍니다. 전반적으로 2031년까지 재충전식 배터리 생산 능력 확대와 이에 따른 학습 곡선에 의한 비용 절감이 북미의 배터리 시장의 주요 성장 동력으로 자리 잡고 있습니다.
기타 혜택:
- 엑셀 형식 시장 예측(ME) 시트
- 3개월간의 애널리스트 지원
자주 묻는 질문
목차
제1장 서론
제2장 조사 방법
제3장 주요 요약
제4장 시장 구도
제5장 시장 규모와 성장 예측
제6장 경쟁 구도
제7장 시장 기회와 향후 전망
LSH 26.08.25According to Mordor Intelligence, the North America battery market size is projected to be USD 34.67 billion in 2025, USD 38.90 billion in 2026, and reach USD 74.08 billion by 2031, growing at a CAGR of 13.75% from 2026 to 2031.
This report is Segmented by Battery Type (Primary and Secondary), Technology (Lead-Acid, Li-Ion, Nickel-Metal Hydride, Nickel-Cadmium, Sodium-Sulfur, Solid-State, Flow Battery, and Emerging Chemistries), Application (Automotive, Industrial, Portable, Power Tools, SLI, and More), and Geography (United States, Canada, and Mexico). The Market Sizes and Forecasts are Provided in Terms of Value (USD).
North America Battery Market Trends and Insights
IRA-Fuelled Gigafactory Build-Out Compressing Pack Costs
Section 45X of the Inflation Reduction Act (IRA) provides USD 35 per kilowatt-hour for cells and USD 10 per kilowatt-hour for modules manufactured domestically, a structure that triggered USD 110 billion of announced battery investments across 13 states since 2022. BlueOval SK secured a USD 9.6 billion Department of Energy loan for twin plants in Kentucky and Tennessee, with the first line online in late 2025. Panasonic ramped its De Soto, Kansas, facility to 30 gigawatt-hours in 2025, while Samsung SDI and General Motors broke ground on an Indiana site targeting a 2026 start-up. These projects lower the breakeven utilization threshold from 80% to 60%, accelerating commissioning schedules and enabling a forecast 40% pack-cost decline from 2022 to 2027. As costs fall, total-cost-of-ownership parity between EVs and internal-combustion vehicles is expected as early as 2027, a full two years earlier than many OEMs originally modeled.
On-Shoring Incentives Reducing Supply-Chain Risk for OEMs
Automakers absorbed USD 2.3 billion of extra logistics costs during the 2021-2022 semiconductor crunch, prompting a pivot toward regional cell production that mitigates shipping disruptions and tariff exposure. The IRA's Foreign Entity of Concern provisions, effective January 2024, disqualify EVs from a USD 7,500 consumer credit if batteries or critical minerals come from Chinese or Russian entities, driving supplier re-mapping. Ultium Cells now runs three U.S. plants totaling 140 gigawatt-hours, trimming cell lead times from 12 to 4 weeks and lowering working-capital needs by about 20%. Stellantis and Samsung SDI followed with a USD 7.3 billion Kokomo facility that secures supply for full-size pickups. Together, these vertically integrated models insulate OEM programs from foreign-exchange swings and logistics bottlenecks, protecting margins during the EV ramp.
Lithium-Price Volatility Widening Project IRR Band
Spot lithium-carbonate prices plunged from USD 80,000 per metric ton in late 2022 to USD 12,000 by June 2024 before rebounding to USD 15,000 by December, a roller-coaster that injected a 12%-15% spread into battery-pack economics. General Motors' Thacker Pass joint venture aims to secure 40,000 metric tons annually by 2027, shielding 800,000 vehicles per year from spot swings. Yet project IRRs remain highly sensitive; sustained prices below USD 18,000 could extend paybacks beyond 10 years, delaying bank financing for mid-tier cell manufacturers. Smaller firms lacking captive lithium struggle to hit the 80% offtake threshold demanded by lenders, throttling greenfield builds and weighing on near-term capacity additions.
Other drivers and restraints analyzed in the detailed report include:
- Utility-Scale Storage Mandates in CA, NY, TX, BC
- EV-Driven Average Battery Size Increase (SUV Mix)
- Mid-Stream Bottlenecks (Foil, Separator) Delay Ramp-Ups
For complete list of drivers and restraints, kindly check the Table Of Contents.
Segment Analysis
Secondary rechargeable batteries accounted for 75.5% of the North America battery market share in 2025 and are projected to expand at a 15.5% CAGR to 2031. This growth trajectory reflects surging EV and stationary-storage deployments, both of which require high cycle life and multi-year warranties that favor lithium-ion chemistries. Average pack sizes in electric trucks rose to 78 kilowatt-hours in 2025, lifting cell demand per vehicle and hastening gigafactory utilization ramps. Primary cells, at 24.5% of revenue, grow at single-digit rates, limited to medical, defense, and IoT niches where multi-decade shelf life outweighs rechargeability. Consolidation trends differ by sub-segment; Duracell and Energizer maintain brand pull in consumer alkaline, whereas automotive OEMs increasingly insource lithium-ion, compressing margins for independent suppliers.
Unit economics are also diverging. Tesla's internal 4680 line hit a 10 gigawatt-hour run rate by September 2025, reducing per-kilowatt-hour costs 15% versus externally sourced 2170 cells and capturing upstream value that previously accrued to vendors. Small primary-battery suppliers benefited from a 12% rise in Department of Defense procurement in 2024, highlighting how performance-critical niches can still yield steady margins despite slower volume growth. Overall, rechargeable capacity additions and associated learning-curve cost declines are locked in as the principal engine of the North America battery market through 2031.
Complete Report Scope:
- By Battery Type
- Primary Batteries
- Secondary Batteries
- By Technology
- Lead-acid
- Li-ion
- Nickel-metal hydride
- Nickel-cadmium
- Sodium-sulfur
- Solid-state
- Flow Battery
- Emerging chemistries
- By Application
- Automotive (HEV, PHEV, and EV)
- Industrial (Motive, Stationary (Telecom, UPS, ESS), etc.)
- Portable (Consumer Electronics, etc.)
- Power Tools
- SLI
- Other Applications
- By Geography
- United States
- Canada
- Mexico
List of Companies Covered in this Report:
- LG Energy Solution
- Panasonic Energy Co.
- Tesla (Internal Cell Ops)
- Samsung SDI
- SK On
- BYD Co. Ltd.
- CATL
- Enersys
- Saft Groupe SA
- Duracell Inc.
- Johnson Controls Intl.
- Clarios
- Northvolt AB
- AESC (Envision)
- EVE Energy NA
- American Battery Factory
- Natron Energy
- 24M Technologies
- FREYR Battery
- Lyten Inc.
- BlueOval SK
Additional Benefits:
- The market estimate (ME) sheet in Excel format
- 3 months of analyst support
TABLE OF CONTENTS
1 Introduction
- 1.1 Study Assumptions & Market Definition
- 1.2 Scope of the Study
2 Research Methodology
3 Executive Summary
4 Market Landscape
- 4.1 Market Overview
- 4.2 Market Drivers
- 4.2.1 IRA-fuelled gigafactory build-out compressing pack costs
- 4.2.2 On-shoring incentives reducing supply-chain risk for OEMs
- 4.2.3 Utility-scale storage mandates in CA, NY, TX, BC
- 4.2.4 Emerging auto-maker-battery-maker JVs unlocking capital efficiency
- 4.2.5 EV-driven average battery size ↑ (SUV mix) creating volume pull
- 4.2.6 Recycling tax credits lowering end-of-life costs
- 4.3 Market Restraints
- 4.3.1 Mid-stream bottlenecks (foil, separator) delay ramp-ups
- 4.3.2 Lithium-price volatility widening project IRR band
- 4.3.3 Tariff uncertainty on Chinese LFP imports
- 4.3.4 Skilled-labour shortages at new cell plants
- 4.4 Supply-Chain Analysis
- 4.5 Regulatory Landscape
- 4.6 Technological Outlook
- 4.7 Porter's Five Forces
- 4.7.1 Bargaining Power of Suppliers
- 4.7.2 Bargaining Power of Buyers
- 4.7.3 Threat of New Entrants
- 4.7.4 Threat of Substitutes
- 4.7.5 Competitive Rivalry
- 4.8 Pricing Analysis
- 4.9 International Trade Analysis
5 Market Size & Growth Forecasts
- 5.1 By Battery Type
- 5.1.1 Primary Batteries
- 5.1.2 Secondary Batteries
- 5.2 By Technology
- 5.2.1 Lead-acid
- 5.2.2 Li-ion
- 5.2.3 Nickel-metal hydride
- 5.2.4 Nickel-cadmium
- 5.2.5 Sodium-sulfur
- 5.2.6 Solid-state
- 5.2.7 Flow Battery
- 5.2.8 Emerging chemistries
- 5.3 By Application
- 5.3.1 Automotive (HEV, PHEV, and EV)
- 5.3.2 Industrial (Motive, Stationary (Telecom, UPS, ESS), etc.)
- 5.3.3 Portable (Consumer Electronics, etc.)
- 5.3.4 Power Tools
- 5.3.5 SLI
- 5.3.6 Other Applications
- 5.4 By Geography
- 5.4.1 United States
- 5.4.2 Canada
- 5.4.3 Mexico
6 Competitive Landscape
- 6.1 Market Concentration
- 6.2 Strategic Moves (M&A, Partnerships, PPAs)
- 6.3 Market Share Analysis (Market Rank/Share for key companies)
- 6.4 Company Profiles (includes Global level Overview, Market level overview, Core Segments, Financials as available, Strategic Information, Products & Services, and Recent Developments)
- 6.4.1 LG Energy Solution
- 6.4.2 Panasonic Energy Co.
- 6.4.3 Tesla (Internal Cell Ops)
- 6.4.4 Samsung SDI
- 6.4.5 SK On
- 6.4.6 BYD Co. Ltd.
- 6.4.7 CATL
- 6.4.8 Enersys
- 6.4.9 Saft Groupe SA
- 6.4.10 Duracell Inc.
- 6.4.11 Johnson Controls Intl.
- 6.4.12 Clarios
- 6.4.13 Northvolt AB
- 6.4.14 AESC (Envision)
- 6.4.15 EVE Energy NA
- 6.4.16 American Battery Factory
- 6.4.17 Natron Energy
- 6.4.18 24M Technologies
- 6.4.19 FREYR Battery
- 6.4.20 Lyten Inc.
- 6.4.21 BlueOval SK
7 Market Opportunities & Future Outlook
- 7.1 White-space & Unmet-Need Assessment


