

|
시장보고서
상품코드
2113625
모바일 맵핑 시스템 : 시장 점유율 분석, 업계 동향 및 통계, 성장 예측(2026-2031년)Mobile Mapping System - Market Share Analysis, Industry Trends & Statistics, Growth Forecasts (2026 - 2031) |
||||||
 Mordor Intelligence
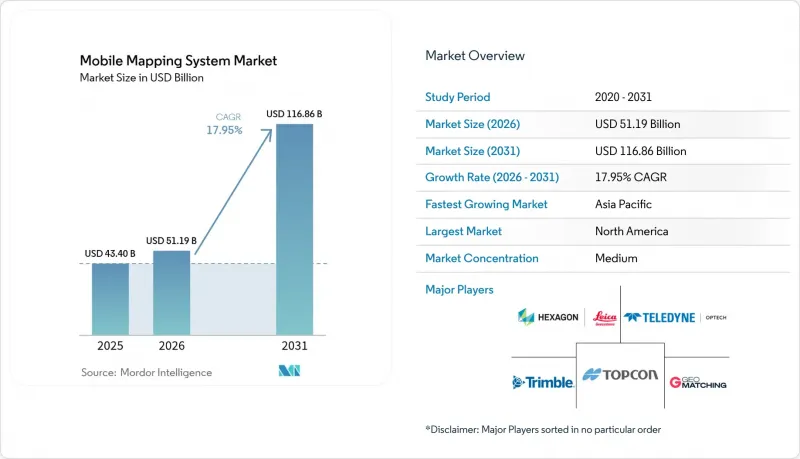
Mordor Intelligence에 의하면, 모바일 맵핑 시스템 시장 규모는 2025년에 434억 달러, 2026년 511억 9,000만 달러에서 2031년까지 1,168억 6,000만 달러에 이를 것으로 예측되며, 예측 기간(2026년-2031년) CAGR은 17.95%를 기록할 전망입니다.
본 보고서는 구성 요소(하드웨어, 소프트웨어, 서비스), 설치 형태(차량 탑재형, 철도 탑재형 등), 용도(이미지 서비스, 항공 모바일 매핑 등), 최종 사용자 산업(정부, 석유 및 가스, 광업, 군사 등), 지역(북미, 유럽, 남미 등)별로 분류되어 있습니다. 시장 전망은 금액(달러) 기준으로 제시되어 있습니다.
세계 모바일 매핑 시스템 시장 동향 및 인사이트
모든 유형의 차량과의 통합
철도 차량, 트럭, 자율주행 셔틀, 나아가 선박에도 센서를 탑재할 수 있게 됨에 따라 모바일 매핑 시스템 시장의 범위가 확대되었습니다. 독일 철도(Deutsche Bahn)는 2022년, 시속 100km에서 철도 측량을 위해 Trimble사의 MX9 플랫폼을 인증함으로써, 유럽 철도 회랑에서 중단 없는 자산 데이터 수집의 실현을 뒷받침했습니다. 이전에는 수동 LiDAR 스캔을 수행하기 위해 주말 운행 중단을 계획했던 교통 기관도, 현재는 정상 운행 중에 차량에 의존하지 않는 페이로드를 도입하여 점검 주기를 단축하고 안전 위험을 줄이고 있습니다. 자율 주행식 도로 청소차에 대한 유사한 통합을 통해 독일과 캐나다의 도시 지역에서 디지털 트윈 프로그램을 위한 야간 연석 수준 매핑이 가능해졌으며, 크로스 플랫폼 호환성이 장비 제조업체의 수익원이 되고 있음이 입증되었습니다.
정부의 디지털 트윈 의무화
영국의 ‘내셔널 디지털 트윈 이니셔티브(National Digital Twin Initiative)’와 같은 국가 프로그램에서는 센티미터 단위의 정밀도를 지닌 3D 데이터 입력을 의무화하는 데이터 기준이 마련되었습니다. 이에 따라 각 지자체는 도시 규모의 디지털 트윈을 구축하기 위해 도로, 교량, 공공 건축물에 대한 고밀도 모바일 LiDAR 도입을 위탁했고, 이를 통해 수년에 걸친 서비스 계약이 체결되며 최첨단 센서 장비의 조달도 촉진되었습니다. 라이더와 GIS 분석을 결합한 웁살라시의 생물 다양성 회랑 계획은 규제에 의한 지원이 어떻게 동적이고 갱신 가능한 공간 데이터 세트에 대한 즉각적인 수요로 이어졌는지를 보여주었습니다. 따라서 모바일 매핑 시스템 시장은 장기적인 인프라 회복력 목표와 연계된 예측 가능한 공공 부문 자금 지원의 혜택을 받았습니다.
시스템 도입 및 구축에 드는 높은 비용
최고급 모바일 매핑 패키지의 가격은 여전히 25만-75만 달러에 달하며, 이 가격대는 소규모 토목 건설 회사에게는 여전히 감당하기 어려운 수준이었습니다. 2022년에 실시된 말레이시아의 도로 설계 조사에서는 기술적 이점이 분명함에도 불구하고 LiDAR 입찰이 연기된 주된 이유로 자본 지출(Capex)이 꼽혔습니다. 자금 조달의 장벽은 라틴아메리카와 아프리카에서 더욱 높아졌습니다. 이 지역에서는 현지 은행이 전문적인 지리 공간 하드웨어를 위한 자산 담보 리스를 제공하는 경우가 거의 없었습니다. 각 벤더사는 ‘매핑-어-서비스(MaaS)’ 방식의 구독 서비스로 대응했으나, 모바일 매핑 시스템 시장의 잠재적 수요를 가로막는 가장 큰 걸림돌로 초기 투자 문제가 여전히 남아 있었습니다.
부문 분석
2025년, 하드웨어 부문은 모바일 매핑 시스템 시장 점유율의 50.60%를 차지하며, 자본 집약적인 센서 제품군에 대한 기존의 높은 의존도를 여실히 드러냈습니다. 고급 차량용 장비의 경우 3.6 MHz 레이저 스캐너와 72 MP 파노라마 카메라가 결합된 반면, 라이카의 BLK2GO와 같은 핸드헬드형 장치에서는 LiDAR와 비주얼 SLAM이 1kg의 본체에 통합되었습니다. 그러나 센서의 소형화와 솔리드 스테이트 기술의 혁신으로 단가가 하락하면서, 교체 주기가 단축되고 모듈식 업그레이드가 촉진되었습니다.
조직들이 복잡한 데이터 처리를 외부에 위탁하게 되면서, 서비스 분야는 2031년까지 20.10%라는 가장 높은 연평균 성장률(CAGR)을 달성했습니다. AI가 탑재된 클라우드 플랫폼은 원시 포인트 클라우드 데이터를 CAD 호환 결과물로 변환하여 내부 운영 비용을 절감했습니다. 이 모델로 인해 수익원이 하드웨어 마진에서 지속적인 분석 수익으로 전환되면서 모바일 매핑 시스템 시장의 구조적 변화가 가속화되었습니다. 신흥국에서 종량제 서비스의 이용 기회가 확대됨에 따라, 서비스와 관련된 모바일 매핑 시스템 시장 규모는 확대될 것으로 전망됩니다.
2025년에는 차량 탑재형 플랫폼이 모바일 매핑 시스템 시장의 61.30%를 차지했습니다. 이는 규정 속도에서 끊김 없는 데이터 수집을 통해 생산성을 극대화할 수 있는 고속도로나 철도 연선에서 선호되었습니다. SUV에 탑재된 듀얼 헤드 스캐너는 한 번의 주행으로 노면 손상과 도로변 자산을 모두 포착하여 교통 기관 전체의 예산을 통합했습니다.
연평균 성장률(CAGR) 21.10%로 확대되고 있는 드론 탑재형 페이로드는 수직 갱도, 절벽, 재해 지역에서 LiDAR를 통한 신속한 측정을 가능하게 했습니다. 경량 솔리드 스테이트 센서로 인해 비행 지속 시간이 연장되었고, 탑재된 AI가 식생을 실시간으로 필터링함으로써 후속 공정의 작업 부담을 경감시켰습니다. 철도 전용 트롤리 및 백팩형 유닛은 틈새 시장의 요구를 충족시키면서, 향후 모바일 매핑 시스템 시장의 성장을 뒷받침할 다양한 기기 구성에 전반적으로 기여했습니다.
지역별 분석
2025년, 북미는 모바일 매핑 시스템 시장의 37.40%를 차지했습니다. 연방 정부의 인프라 자금과 견조한 국방 분야의 ISR(정보·감시·정찰) 예산이 센서 수요의 꾸준한 확대를 뒷받침했습니다. 파일럿 프로그램을 통해 주 전역에 걸친 모바일 LiDAR 투자 1달러당 2달러의 수익이 입증되면서 예산 배정이 더욱 강화되었습니다. 생태계의 성숙도, 풍부한 숙련된 인력, 그리고 국내 벤더들의 적극적인 연구 개발이 이 지역의 리더십을 유지했습니다.
아시아태평양은 중국과 인도의 스마트 시티 지출, 일본의 회복력 계획, 그리고 한국의 자율주행차용 매핑 회랑에 힘입어 18.90%라는 가장 높은 연평균 성장률(CAGR)을 기록했습니다. 2025년에는 인기 있는 기기 비교 포털 사이트의 전 세계 트래픽 중 거의 절반이 아시아태평양 사용자에 의해 발생했으며, 이는 높은 참여도를 보여 주었고 드론 및 차량 시스템 주문으로 이어졌습니다. 저비용 센서 덕분에 지방 자치 단체에서의 초급 수준 도입이 확산되면서 모바일 매핑 시스템 시장 규모가 확대되었습니다.
유럽, 중동 및 아프리카, 남미에서는 수요 동향에 편차가 나타났습니다. 유럽의 지속가능성 관련 규제는 독일 도시 지역의 트럭 교통용 라이더(LiDAR) 등 환경 모니터링 프로젝트를 촉진했습니다. 중동에서는 파이프라인 및 메가시티 관련 사업이 우선시되었으며, 남미에서는 브라질과 칠레의 광산이 매출을 지탱했습니다. 아프리카는 여전히 발전 단계에 있지만, 남아프리카공화국의 인프라 조사 분야에서 성장세가 두드러졌습니다. 모든 지역에서 모바일 매핑과 클라우드, IoT, AI의 통합이 산업 전반에 걸친 활용 사례를 뒷받침하며, 전 세계 모바일 매핑 시스템 시장의 성장세를 견인했습니다.
기타 혜택:
- 엑셀 형식 시장 예측(ME) 시트
- 3개월간의 애널리스트 지원
자주 묻는 질문
목차
제1장 서론
제2장 조사 방법
제3장 주요 요약
제4장 시장 구도
제5장 시장 규모와 성장 예측
제6장 경쟁 구도
제7장 시장 기회와 향후 전망
LSH 26.08.25According to Mordor Intelligence, the mobile mapping system market size was valued at USD 43.4 billion in 2025 and estimated to grow from USD 51.19 billion in 2026 to reach USD 116.86 billion by 2031, at a CAGR of 17.95% during the forecast period (2026-2031).
This report is Segmented by Component (Hardware, Software, and Services), Mounting Type (Vehicle Mounted, Railway Mounted, and More), Application (Imaging Services, Aerial Mobile Mapping, and More), End-User Verticals (Government, Oil and Gas, Mining, Military, and More), and Geography (North America, Europe, South America, and More). The Market Forecasts are Provided in Terms of Value (USD).
Global Mobile Mapping System Market Trends and Insights
Integration with All Kinds of Vehicles
The ability to mount sensors on railcars, trucks, autonomous shuttles, and even boats widened the mobile mapping system market scope. Deutsche Bahn certified Trimble's MX9 platform for 100 km/h rail surveys in 2022, validating non-stop asset capture for European rail corridors. Transportation agencies that previously scheduled weekend closures for manual LiDAR scans now deploy vehicle-independent payloads during regular service, accelerating inspection cycles and reducing safety risks. Similar integrations on autonomous road sweepers enabled night-time curb-level mapping for urban digital-twin programs in Germany and Canada, demonstrating how cross-platform compatibility has become a revenue driver for equipment makers.
Government Digital-Twin Mandates
National programs such as the United Kingdom's National Digital Twin initiative established compulsory data standards that require centimeter-grade 3D inputs. Municipalities responded by commissioning high-density mobile LiDAR of roadways, bridges, and public buildings to populate city-scale twins, spawning multi-year service contracts and stimulating procurement of modern sensor rigs. Uppsala's biodiversity corridor planning, which combined LiDAR with GIS analytics, showed how regulatory push translated into immediate demand for dynamic, update-ready spatial datasets. The mobile mapping system market, therefore, benefited from predictable public-sector funding streams tied to long-range infrastructure resilience goals.
High Cost of System Acquisition and Deployment
Top-tier mobile mapping packages still commanded USD 250,000-750,000, a threshold that remained prohibitive for small civil-engineering firms. A Malaysian road-design study in 2022 highlighted cap-ex as the main reason LiDAR bidding was deferred despite clear technical gains. Financing hurdles were sharper in Latin America and Africa, where local banks rarely offered asset-backed leasing for specialized geospatial hardware. Vendors responded with "mapping-as-a-service" subscriptions, yet up-front investment persisted as the most significant drag on addressable demand within the mobile mapping system market.
Other drivers and restraints analyzed in the detailed report include:
- Declining Solid-State LiDAR Costs
- AI-Powered Automatic Feature Extraction
- Skilled-Operator Shortage
For complete list of drivers and restraints, kindly check the Table Of Contents.
Segment Analysis
The hardware segment accounted for 50.60% of the mobile mapping system market share in 2025, underscoring its past reliance on capital-intensive sensor suites. Premium vehicle rigs paired 3.6 MHz laser scanners with 72 MP panoramic cameras, while handheld units such as Leica's BLK2GO blended LiDAR with visual SLAM in one-kilogram packages. However, shrinking sensor footprints and solid-state innovations compressed unit costs, allowing more frequent refresh cycles and fostering modular upgrades.
The services segment achieved the fastest 20.10% CAGR through 2031 as organizations outsourced complex data processing. AI-enabled cloud platforms converted raw point clouds into CAD-ready deliverables, lowering internal overheads. This model shifted profit pools from hardware margins toward recurring analytics revenue, accelerating a structural transition in the mobile mapping system market. The mobile mapping system market size attached to services is projected to widen as pay-per-use offerings broaden access in emerging economies.
Vehicle-mounted platforms controlled 61.30% of the mobile mapping system market in 2025, favored for highway and rail corridors where uninterrupted acquisition at posted speeds maximized productivity. Dual-head scanners on SUVs captured both pavement distress and roadside assets during a single pass, consolidating budgets across transportation agencies.
Drone-based payloads, expanding at 21.10% CAGR, opened vertical mines, cliff faces, and disaster zones to rapid LiDAR coverage. Lighter solid-state sensors extended flight endurance while onboard AI filtered vegetation in real time, reducing downstream workload. Railway-specific trolleys and backpack units addressed niche needs yet collectively contributed to a diversified equipment mix underpinning future mobile mapping system market size momentum.
Complete Report Scope:
- By Component
- Hardware
- Software
- Services
- By Mounting Type
- Vehicle Mounted
- Railway Mounted
- Drone Mounted
- Others
- By Application
- Imaging Services
- Aerial Mobile Mapping
- Emergency Response Planning
- Internet Applications
- Facility Management
- Satellite
- By End-user Verticals
- Government
- Oil and Gas
- Mining
- Military
- Other End-user Verticals
- By Region
- North America
- United States
- Canada
- Mexico
- Europe
- United Kingdom
- Germany
- France
- Italy
- Rest of Europe
- Asia-Pacific
- China
- Japan
- India
- South Korea
- Rest of Asia-Pacific
- Middle East
- Israel
- Saudi Arabia
- United Arab Emirates
- Turkey
- Rest of Middle East
- Africa
- South Africa
- Egypt
- Rest of Africa
- South America
- Brazil
- Argentina
- Rest of South America
- North America
Geography Analysis
North America accounted for 37.40% of the mobile mapping system market in 2025. Federal infrastructure funding and strong defense ISR budgets nurtured steady sensor demand. Pilot programs demonstrated a USD 2 return for every USD 1 invested in statewide mobile LiDAR, reinforcing budget allocations. Ecosystem maturity, abundant skilled labor, and aggressive R and D by domestic vendors sustained the region's leadership.
Asia-Pacific recorded the fastest 18.90% CAGR, driven by smart-city spending in China and India, Japan's resilience planning, and South Korea's autonomous-vehicle mapping corridors. Nearly half of global traffic on popular equipment-comparison portals originated from Asia-Pacific users in 2025, signaling high engagement that translated into orders for both drone and vehicle systems. Lower-cost sensors broadened entry-level uptake among provincial agencies, expanding the mobile mapping system market footprint.
Europe, the Middle East, Africa, and South America presented mixed demand profiles. European mandates around sustainability spurred environmental monitoring projects such as truck-traffic lidar in German cities. The Middle East prioritized pipeline and megacity initiatives, while Brazilian and Chilean mines underpinned South American sales. Africa remained nascent but showed momentum in South African infrastructure surveys. Across all regions, integration of mobile mapping with cloud, IoT, and AI underpinned cross-vertical use cases, lifting the global mobile mapping system market momentum.
- Leica Geosystems AG (Hexagon AB)
- Trimble Inc.
- Topcon Corporation
- Teledyne Optech Inc.
- RIEGL Laser Measurement Systems GmbH
- Zoller+Frohlich GmbH
- NavVis GmbH
- GeoSLAM Ltd.
- Kaarta Inc.
- Mandli Communications Inc.
- Applanix Corporation
- Siteco Informatica Srl
- YellowScan
- Fugro N.V.
- Cyclomedia Technology BV
- Imajing SAS
- Velodyne Lidar Inc.
- Ouster Inc.
- SureStar Technology Co., Ltd.
- Innoviz Technologies Ltd.
- Hesai Technology Co., Ltd.
- RoboSense (Suteng Innovation Technology Co., Ltd.)
- OxTS Ltd.
Additional Benefits:
- The market estimate (ME) sheet in Excel format
- 3 months of analyst support
TABLE OF CONTENTS
1 INTRODUCTION
- 1.1 Study Assumptions and Market Definition
- 1.2 Scope of the Study
2 RESEARCH METHODOLOGY
3 EXECUTIVE SUMMARY
4 MARKET LANDSCAPE
- 4.1 Market Overview
- 4.2 Market Drivers
- 4.2.1 Integration with All Kinds of Vehicles
- 4.2.2 Government Digital-Twin Mandates
- 4.2.3 Declining Solid-State LiDAR Costs
- 4.2.4 AI-Powered Automatic Feature Extraction
- 4.2.5 Autonomous Robots and Drone Adoption
- 4.2.6 Defense ISR Modernization Budgets
- 4.3 Market Restraints
- 4.3.1 High Cost of System Acquisition and Deployment
- 4.3.2 Skilled-Operator Shortage
- 4.3.3 Data-Privacy and Surveillance Regulations
- 4.3.4 Construction-Sector Cap-ex Cyclicality
- 4.4 Supply Chain Analysis
- 4.5 Regulatory Landscape
- 4.6 Technological Outlook
- 4.7 Porter's Five Forces Analysis
- 4.7.1 Bargaining Power of Suppliers
- 4.7.2 Bargaining Power of Consumers
- 4.7.3 Threat of New Entrants
- 4.7.4 Threat of Substitutes
- 4.7.5 Intensity of Competitive Rivalry
5 MARKET SIZE AND GROWTH FORECASTS (VALUE)
- 5.1 By Component
- 5.1.1 Hardware
- 5.1.2 Software
- 5.1.3 Services
- 5.2 By Mounting Type
- 5.2.1 Vehicle Mounted
- 5.2.2 Railway Mounted
- 5.2.3 Drone Mounted
- 5.2.4 Others
- 5.3 By Application
- 5.3.1 Imaging Services
- 5.3.2 Aerial Mobile Mapping
- 5.3.3 Emergency Response Planning
- 5.3.4 Internet Applications
- 5.3.5 Facility Management
- 5.3.6 Satellite
- 5.4 By End-user Verticals
- 5.4.1 Government
- 5.4.2 Oil and Gas
- 5.4.3 Mining
- 5.4.4 Military
- 5.4.5 Other End-user Verticals
- 5.5 By Region
- 5.5.1 North America
- 5.5.1.1 United States
- 5.5.1.2 Canada
- 5.5.1.3 Mexico
- 5.5.2 Europe
- 5.5.2.1 United Kingdom
- 5.5.2.2 Germany
- 5.5.2.3 France
- 5.5.2.4 Italy
- 5.5.2.5 Rest of Europe
- 5.5.3 Asia-Pacific
- 5.5.3.1 China
- 5.5.3.2 Japan
- 5.5.3.3 India
- 5.5.3.4 South Korea
- 5.5.3.5 Rest of Asia-Pacific
- 5.5.4 Middle East
- 5.5.4.1 Israel
- 5.5.4.2 Saudi Arabia
- 5.5.4.3 United Arab Emirates
- 5.5.4.4 Turkey
- 5.5.4.5 Rest of Middle East
- 5.5.5 Africa
- 5.5.5.1 South Africa
- 5.5.5.2 Egypt
- 5.5.5.3 Rest of Africa
- 5.5.6 South America
- 5.5.6.1 Brazil
- 5.5.6.2 Argentina
- 5.5.6.3 Rest of South America
- 5.5.1 North America
6 COMPETITIVE LANDSCAPE
- 6.1 Market Concentration
- 6.2 Strategic Moves
- 6.3 Market Share Analysis
- 6.4 Company Profiles (includes Global Level Overview, Market Level Overview, Core Segments, Financials as available, Strategic Information, Market Rank/Share for key companies, Products and Services, and Recent Developments)
- 6.4.1 Leica Geosystems AG (Hexagon AB)
- 6.4.2 Trimble Inc.
- 6.4.3 Topcon Corporation
- 6.4.4 Teledyne Optech Inc.
- 6.4.5 RIEGL Laser Measurement Systems GmbH
- 6.4.6 Zoller+Frohlich GmbH
- 6.4.7 NavVis GmbH
- 6.4.8 GeoSLAM Ltd.
- 6.4.9 Kaarta Inc.
- 6.4.10 Mandli Communications Inc.
- 6.4.11 Applanix Corporation
- 6.4.12 Siteco Informatica Srl
- 6.4.13 YellowScan
- 6.4.14 Fugro N.V.
- 6.4.15 Cyclomedia Technology BV
- 6.4.16 Imajing SAS
- 6.4.17 Velodyne Lidar Inc.
- 6.4.18 Ouster Inc.
- 6.4.19 SureStar Technology Co., Ltd.
- 6.4.20 Innoviz Technologies Ltd.
- 6.4.21 Hesai Technology Co., Ltd.
- 6.4.22 RoboSense (Suteng Innovation Technology Co., Ltd.)
- 6.4.23 OxTS Ltd.
7 MARKET OPPORTUNITIES AND FUTURE OUTLOOK
- 7.1 White-space and Unmet-need Assessment


