

|
시장보고서
상품코드
2113668
디지털 병리학 : 시장 점유율 분석, 산업 동향 및 통계 데이터, 성장 예측(2026-2031년)Digital Pathology - Market Share Analysis, Industry Trends & Statistics, Growth Forecasts (2026 - 2031) |
||||||
 Mordor Intelligence
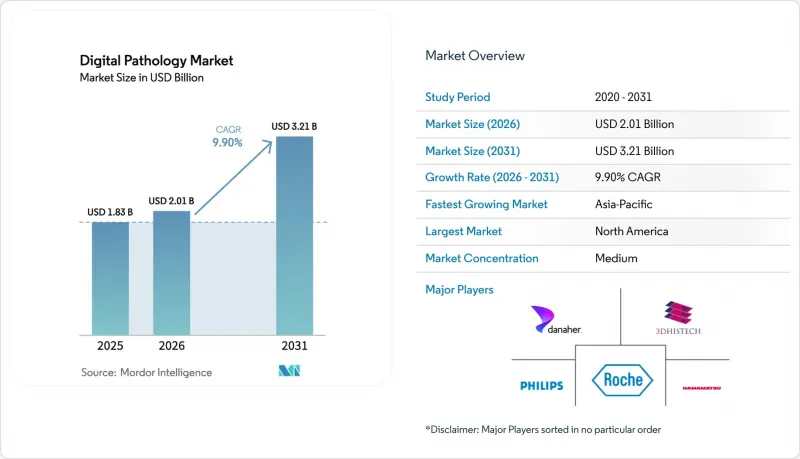
Mordor Intelligence에 의하면, 디지털 병리학 시장 규모는 2025년 18억 3,000만 달러로 평가되었습니다. 2026년에는 20억 1,000만 달러로 확대되어 2031년까지 32억 1,000만 달러에 이를 것으로 예측되며, 2026년부터 2031년에 걸쳐 CAGR 9.90%로 성장할 전망입니다.
본 보고서는 제품별(전체 슬라이드 이미징 스캐너, 영상 분석·AI 소프트웨어 등), 이미징 기술별(명시야, 형광), 용도별(질환 진단, 교육·연수 등), 최종 사용자별(병원 등), 도입 형태별(On-Premise, 클라우드/SaaS), 지역별(북미, 유럽 등)로 분류되어 있습니다. 시장 규모 및 예측은 금액(달러) 기준으로 제시되어 있습니다.
세계의 디지털 병리학 시장 동향 및 인사이트
병리 전문의 인력 부족이 자동화를 가능하게 하는 디지털 워크플로우의 보급을 가속화하고 있습니다.
2024년에 발표된 인력 모델에 따르면, 2030년까지 미국에서는 5,900명의 병리 전문의가 부족할 것으로 예측되며, 이는 현재 병리 전문의 수의 18%에 해당합니다. 2025년에는 영국 컨설턴트 직위의 40%가 6개월 이상 공석으로 남아 있었습니다. 디지털 플랫폼을 통해 한 명의 전문의가 유리 슬라이드를 우편으로 보내지 않고도 여러 병원의 사례를 검토할 수 있게 되어, 처리 능력이 실질적으로 두 배로 늘어납니다. 2025년 미국 병리학자 협회(College of American Pathologists)의 연구에 따르면, AI를 활용한 사전 선별 검사를 통해 진단 일치율을 유지하면서 일상적인 생검에 소요되는 시간이 대폭 단축된 것으로 확인되었습니다. 그 결과, 병원들은 신규 채용에 할당하던 자금을 의사의 연간 급여보다 비용이 저렴한 스캐너 및 알고리즘 구독 서비스로 전환하고 있습니다.
대규모 종양학·면역요법 임상시험에서는 영상 기반 바이오마커 평가가 필수적입니다.
2025년에는 면역종양학 분야의 임상시험용 의약품 신청 건수가 1,847건으로 증가했으며, 그중 68%에서 PD-L1, 종양 돌연변이 부하 또는 면역세포 밀도의 디지털 정량화가 요구되었습니다. 수동 채점에서는 PD-L1의 관찰자 간 변동성이 20%를 초과하는 반면, 검증된 AI 알고리즘은 변동성을 5% 미만으로 억제하여 규제상의 정확도 기준을 충족합니다. 로슈는 2025년에 자사의 후기 단계 종양학 연구의 82%에서 디지털 플랫폼을 통해 슬라이드 심사를 일원화했다고 밝혔습니다. 계약 연구 기관(CRO)도 이러한 변화에 발맞추어 지역 거점에 스캐너를 설치함으로써 전 세계 각지의 시설이 이미지를 단일 저장소에 업로드할 수 있게 하고, 병원의 예산 주기에 좌우되지 않는 수요를 확보하고 있습니다.
중규모 및 공공 검사 기관의 스캐너, 스토리지, IT 비용 부담
40배 확대 기능이 있는 WSI 스캐너의 가격은 15만-40만 달러이며, 슬라이드 1만 장당 약 50테라바이트의 데이터를 생성합니다. 이를 처리하려면 10만-20만 달러 규모의 엔터프라이즈급 스토리지에 더해 지속적인 클라우드 이용료가 필요합니다. 지역 병원은 이익률이 낮아, CPT 88360에 따른 45달러의 환급만으로는 투자 자금을 회수할 수 없어 투자 회수 기간이 장기화되고 있습니다. 인도의 지역 병원에서는 2024-25 회계연도에 모든 진단 업무에 대해 고작 500만 루피(6만 달러)만 예산을 편성해 놓았기 때문에 보조금 지원 없이는 WSI 도입이 어렵습니다. 현재 각 벤더사는 리스나 슬라이드당 과금 방식을 제공하고 있지만, 구매 결정에 있어 초기 비용 제약이 지배적인 지역에서는 도입 진전이 여전히 더딘 상황입니다.
부문 분석
전체 슬라이드 이미징 스캐너는 2025년 매출의 43.5%를 차지했으며, 이는 디지털화된 워크플로우를 시작하기 전에 필요한 하드웨어 투자를 반영한 것입니다. ‘이미지 분석·AI 소프트웨어’는 자동화된 정량화 도구 없이는 원본 이미지의 임상적 가치가 제한적이라는 점을 검사실이 인식하고 있기 때문에 제품군 중 가장 높은 연평균 성장률(CAGR) 10.21%를 나타낼 것으로 예측됩니다. Philips는 2025년에 구독 모델로 전환하여, IntelliSite 스캐너와 알고리즘을 월 8,000달러에 번들로 제공함으로써, 기존에 35만 달러를 초과하던 초기 비용을 절감했습니다. 또한, 미국 병리학자 협회(College of American Pathologists)가 진단 영상의 10년간 보관을 의무화하고 있어 멀티페타바이트 규모의 아카이브가 필요해졌으며, 통신 및 스토리지 시스템도 꾸준히 확대되고 있습니다.
바코드 라벨러와 로봇 로더를 포함한 슬라이드 관리 시스템 및 부속품은 기술자의 작업 시간을 단축시킵니다. 라이카(Leica)사에 따르면, GT 450 DX와 400매 수용 로더를 조합하면 1매당 처리 시간이 45초에서 8초로 단축된다고 합니다. AI 기업들이 알고리즘을 스캐너의 펌웨어에 직접 통합하는 사례가 늘어나면서, 하드웨어와 소프트웨어 수익원의 경계가 모호해지고 있습니다. 이러한 융합은 벤더의 포지셔닝을 복잡하게 만들지만, 사용자 경험을 향상시키고 디지털 병리학 시장의 가치 제안을 강화하고 있습니다.
명시야 이미징은 2025년 매출의 85.1%를 차지했습니다. 이는 1차 진단의 대부분이 헤마톡실린-에오신 염색에 의존하고 있으며, FDA 승인 과정에서 여전히 명시야 플랫폼이 중시되고 있기 때문입니다. 형광 이미징은 다중 면역형광법 및 공간 오믹스 분석에 대한 수요로 인해 2031년까지 연평균 성장률(CAGR) 10.55%로 성장할 것으로 전망됩니다. 최대 100종의 단백질을 프로파일링하는 Akoya사의 ‘PhenoCycler’는 도입 대수가 2024년 87대에서 2025년 142대로 확대되었으며, 그 대부분은 학술 기관이나 제약 기업의 연구개발 거점에 도입되었습니다. 형광 스캐너의 가격은 25만-60만 달러로 고가이지만, 보조금이나 임상시험 예산을 통해 추가 비용이 충당되는 경우가 많아 도입이 지속되고 있습니다.
명시야 모드와 형광 모드를 전환할 수 있는 하이브리드 스캐너는 연구소 내 장비 통합을 촉진하고 있습니다. 벤타나(Ventana)사의 ‘DP 200’은 2025년 11월 듀얼 모드를 통한 1차 진단에 대해 FDA 승인을 획득하며, 통합 워크플로우에 대한 규제 당국의 지지를 보여주었습니다. 공초점 및 라이트 시트 플랫폼은 3D 재구성을 가능하게 하지만, 체적 이미징의 진단 경로가 아직 정의되지 않아 여전히 연구 용도로만 제한되고 있습니다.
지역별 분석
북미는 2025년 매출의 47.8%를 차지했으며, FDA의 명확한 지침, CPT에 의한 보험 적용, 그리고 NIH의 데이터 세트에 대한 자금 지원의 혜택을 받았습니다. 2017년부터 2024년에 걸쳐 Philips의 IntelliSite, 라이카의 Aperio AT2, 하마마츠 포토닉스의 NanoZoomer가 승인됨에 따라 규정 준수 관련 불확실성이 해소되고 도입이 가속화되었습니다. CMS는 2024년에 CPT 88360을 도입하여 디지털 진료 1건당 45달러를 지급했습니다. 이는 소폭이지만 매우 중요한 원동력이 되었습니다. NIH의 Bridge2AI 프로그램은 2025년에 표준화된 데이터 세트에 1억 5,000만 달러를 투자하여 알고리즘 연구 개발을 촉진했습니다. 캐나다 온타리오주는 2025년에 12개 지역 병원을 중앙 원격 병리학 허브에 연결하여 소요 시간을 38% 단축했습니다.
유럽도 이에 발맞추어 강력한 규제 추진을 진행하고 있습니다. EU의 의료기기 규정에서는 2027년 중반까지 AI 소프트웨어의 CE-IVD 인증을 의무화하고 있으며, 이에 따라 병원들은 조기에 워크플로우 검증을 진행하도록 권장받고 있습니다. 영국은 2025년과 2028년까지 NHS(국민건강서비스) 산하 모든 트러스트의 병리 검사 디지털화를 위해 1억 8,000만 파운드를 지원하기로 결정했습니다. 독일 보건부는 2025년에 대학 병원을 대상으로 5,000만 유로 규모의 지원 프로그램을 시작했으며, 한편 프랑스 규제 당국은 임상 사용을 위해 7개의 AI 알고리즘을 승인했는데, 이는 유럽에서 가장 많은 건수입니다.
아시아태평양은 11.21%라는 가장 높은 연평균 성장률(CAGR)을 기록하고 있습니다. 중국의 ‘건강 중국 2030’ 계획에서는 현(縣) 단위 원격 병리 진단 네트워크 구축이 의무화되었으며, 23억 위안 상당의 스캐너 도입에 자금이 투입되고 있습니다. 인도의 ‘아유슈만 바라트 디지털 미션’에서는 5,000개 병원에 150억 루피가 지원되었습니다. 일본은 2025년 4월부터 AI 지원 진단에 대해 1건당 8,000엔(55달러)의 보험 적용을 시작하여 미국의 지급률을 상회했습니다. 호주는 2025년에 전국적인 진료 지침을 공표하고, 병원에 대해 명확한 규정 준수 로드맵을 제시했습니다. 중동 및 아프리카 및 남미는 인프라 격차로 인해 뒤처지고 있습니다. 아랍에미리트(UAE)는 2025년, 전국적 도입의 실현 가능성을 검증하기 위해 8개 병원에서 디지털 병리학의 시범 운영을 실시했습니다. 남아프리카공화국의 국립보건검사국은 2024년 원격 병리 진단을 통해 지방 진료소를 네트워크로 연결했으나, 통신 대역폭 부족으로 어려움을 겪고 있습니다. 브라질은 2025년, 사망률이 높은 지역에 중점을 두고 50개 암 센터에 장비를 도입하기 위해 1억 2,000만 레알(2,400만 달러)을 투자했습니다.
기타 혜택 :
- Excel 형식 시장 예측(ME) 시트
- 3개월간의 애널리스트 지원
자주 묻는 질문
목차
제1장 서론
제2장 분석 방법
제3장 주요 요약
제4장 시장 구도
제5장 시장 규모 및 성장률 예측
제6장 경쟁 구도
제7장 시장 기회 및 향후 전망
KTH 26.08.26According to Mordor Intelligence, the digital pathology market size is expected to increase from USD 1.83 billion in 2025 to USD 2.01 billion in 2026 and reach USD 3.21 billion by 2031, growing at a CAGR of 9.90% over 2026-2031.
This report is Segmented by Product (Whole Slide Imaging Scanners, Image Analysis & AI Software, and More), Imaging Technique (Brightfield, Fluorescence), Application (Disease Diagnosis, Education & Training, and More), End User (Hospitals, and More), Deployment (On-Premise, Cloud/SaaS), and Geography (North America, Europe, and More). The Market Sizes and Forecasts are Provided in Terms of Value (USD).
Global Digital Pathology Market Trends and Insights
Pathologist Workforce Shortages Accelerate Automation-Enabled Digital Workflows
Workforce models published in 2024 predicted the United States will be short 5,900 pathologists by 2030, equal to 18% of present capacity . Forty percent of consultant positions in the United Kingdom stayed vacant for more than six months in 2025. Digital platforms let one specialist review cases from several hospitals without shipping glass slides, effectively multiplying throughput. A 2025 College of American Pathologists study confirmed that AI-guided prescreening shortened routine biopsy turnaround time significantly with high diagnostic concordance. Hospitals are therefore redirecting capital from new hires to scanners and algorithm subscriptions that cost less than annual physician salaries.
Large Oncology/Immunotherapy Trials Mandate Image-Based Biomarker Assessment
Investigational new drug filings in immuno-oncology climbed to 1,847 in 2025, and 68% required digital quantification of PD-L1, tumor mutational burden, or immune-cell density. Manual scoring shows inter-observer variability exceeding 20% for PD-L1, whereas validated AI algorithms push variability below 5%, satisfying regulatory precision thresholds. Roche revealed that 82% of its late-stage oncology studies centralized slide review on digital platforms in 2025. Contract research organizations have mirrored this shift, installing scanners at regional hubs so international sites upload images to a single repository, insulating demand from hospital budget cycles.
High Scanner, Storage & IT Costs for Mid-Tier/Public Labs
A 40X WSI scanner costs USD 150,000-400,000 and generates roughly 50 terabytes per 10,000 slides, demanding enterprise storage of another USD 100,000-200,000 plus recurring cloud fees. Community hospitals operate on thin margins and cannot recoup capital through the USD 45 CPT 88360 reimbursement, prolonging payback periods. District hospitals in India budgeted only INR 5 million (USD 60,000) for all diagnostics in fiscal 2024-25, making WSI unattainable without grant support. Vendors now offer leasing and pay-per-slide pricing, but take-up remains slow where upfront cash constraints dominate purchasing.
Other drivers and restraints analyzed in the detailed report include:
- Government Healthcare-Digitization & National AI Grants/Fast-Tracks
- Growth of Companion Diagnostics Needs Quantitative Tissue-Image Analytics
- Lack of Universal Interoperability Across Scanners, LIS & AI Ecosystems
For complete list of drivers and restraints, kindly check the Table Of Contents.
Segment Analysis
Whole Slide Imaging Scanners generated 43.5% of 2025 revenue, reflecting the prerequisite hardware investment before any digitized workflow begins. Image Analysis & AI Software is expected to grow at a 10.21% CAGR, the fastest among products, as laboratories recognize that raw images have limited clinical value without automated quantification tools. Philips shifted to a subscription model in 2025, bundling its IntelliSite scanner and algorithms for USD 8,000 per month, lowering upfront costs that previously exceeded USD 350,000. Communication & Storage Systems also expand steadily because the College of American Pathologists mandates 10-year retention of diagnostic images, prompting multi-petabyte archives.
Slide Management Systems & Accessories, including barcode labelers and robotic loaders, reduce technician touch-time. Leica reports its GT 450 DX paired with a 400-slide loader drops handling from 45 seconds to 8 seconds per slide. AI firms increasingly embed algorithms directly into scanner firmware, blurring hardware and software revenue streams. This convergence complicates vendor positioning but enhances user experience, strengthening the digital pathology market value proposition.
Brightfield imaging accounted for 85.1% of 2025 revenue because most primary diagnoses rely on hematoxylin-and-eosin staining, and FDA approvals still emphasize brightfield platforms. Fluorescence imaging should grow at a 10.55% CAGR through 2031 on demand from multiplex immunofluorescence and spatial-omics assays. Akoya's PhenoCycler, which profiles up to 100 proteins, expanded placements from 87 in 2024 to 142 in 2025, mostly at academic and pharma R&D sites. Fluorescence scanners command premiums of USD 250,000-600,000, yet grant funding and trial budgets often cover incremental costs, sustaining adoption.
Hybrid scanners that toggle between brightfield and fluorescence modes help laboratories consolidate equipment. Ventana's DP 200 won FDA clearance in November 2025 for dual-mode primary diagnosis, signaling regulatory endorsement of integrated workflows. Confocal and light-sheet platforms enable 3D reconstruction but remain confined to research because diagnostic pathways for volumetric imaging have not been defined.
Complete Report Scope:
- By Product
- Whole Slide Imaging Scanners
- Image Analysis & AI Software
- Communication & Storage Systems
- Slide Management Systems & Accessories
- By Imaging Technique
- Brightfield
- Fluorescence
- By Application
- Disease Diagnosis
- Drug Discovery & Companion Diagnostics
- Telepathology & Consultation
- Education & Training
- Quality Assurance & Archiving
- By End User
- Hospital & Reference Laboratories
- Pharmaceutical & Biotechnology Companies & CROs
- Diagnostic Centers
- Other End Users
- By Deployment Model
- On-premise
- Cloud-based / SaaS
- By Geography
- North America
- United States
- Canada
- Mexico
- Europe
- Germany
- United Kingdom
- France
- Italy
- Spain
- Russia
- Rest of Europe
- Asia-Pacific
- China
- Japan
- India
- South Korea
- Australia
- Rest of APAC
- Middle East & Africa
- GCC
- South Africa
- Rest of Middle East & Africa
- South America
- Brazil
- Argentina
- Rest of South America
- North America
Geography Analysis
North America captured 47.8% of 2025 revenue and benefits from FDA clarity, CPT reimbursement, and NIH dataset funding. Clearance of Philips IntelliSite, Leica Aperio AT2, and Hamamatsu NanoZoomer between 2017 and 2024 ended compliance uncertainty, accelerating procurement. CMS introduced CPT 88360 in 2024, providing USD 45 per digital consultation, a modest but critical catalyst. The NIH Bridge2AI program invested USD 150 million in standardized datasets during 2025, fueling algorithm R&D. Canada's Ontario province linked 12 community hospitals to a central telepathology hub in 2025, cutting turnaround time by 38%.
Europe follows with strong regulatory push. The EU Medical Device Regulation requires CE-IVD certification for AI software by mid-2027, prompting hospitals to validate workflows early. The United Kingdom committed GBP 180 million in 2025 to digitize pathology across all NHS trusts by 2028. Germany's health ministry opened a EUR 50 million grant program in 2025 for university hospitals, while France's regulator approved seven AI algorithms for clinical use, the highest in Europe.
Asia-Pacific posts the fastest 11.21% CAGR. China's Healthy China 2030 plan mandates county-level telepathology links and funds scanner rollouts worth RMB 2.3 billion. India's Ayushman Bharat Digital Mission awarded INR 15 billion for 5,000 hospitals. Japan began reimbursing AI-assisted diagnosis at JPY 8,000 (USD 55) per case in April 2025, outpacing U.S. payment rates. Australia published national practice guidelines in 2025, giving hospitals a clear compliance roadmap. Middle East & Africa and South America lag due to infrastructure gaps. The UAE piloted digital pathology at eight hospitals in 2025 to test nationwide feasibility. South Africa's National Health Laboratory Service connected rural clinics via telepathology in 2024 but struggles with bandwidth. Brazil invested BRL 120 million (USD 24 million) in 2025 to equip 50 cancer centers, focusing on high-mortality regions.
- 3DHistech
- Aiforia Technologies Oy
- Akoya Biosciences Inc.
- Danaher Corp. (Leica Biosystems)
- DeepBio Inc.
- F. Hoffmann-La Roche Ltd (Ventana)
- Hamamatsu Photonics
- Huron Digital Pathology Inc.
- Indica Labs Inc.
- Inspirata Inc.
- Koninklijke Philips
- Mikroscan Technologies
- Nikon Corp.
- Olympus Corp.
- OptraSCAN Inc.
- Paige AI Inc.
- PathAI Inc.
- Proscia
- Sectra
- Visiopharm
- XIFIN Inc.
Additional Benefits:
- The market estimate (ME) sheet in Excel format
- 3 months of analyst support
TABLE OF CONTENTS
1 Introduction
- 1.1 Study Assumptions & Market Definition
- 1.2 Scope of the Study
2 Research Methodology
3 Executive Summary
4 Market Landscape
- 4.1 Market Overview
- 4.2 Market Drivers
- 4.2.1 Pathologist Workforce Shortages Accelerate Automation-Enabled Digital Workflows
- 4.2.2 Large Oncology/Immunotherapy Trials Mandate Image-Based Biomarker Assessment
- 4.2.3 Government Healthcare-Digitization & National AI Grants/Fast-Tracks
- 4.2.4 Growth Of Companion Diagnostics Needs Quantitative Tissue-Image Analytics
- 4.2.5 FDA Synthetic-Tissue Dataset Pilot Speeds Algorithm Approvals
- 4.2.6 Spatial-Omics Integration Drives High-Plex Imaging Demand
- 4.3 Market Restraints
- 4.3.1 High Scanner, Storage & IT Costs for Mid-Tier/Public Labs
- 4.3.2 Lack Of Universal Interoperability Across Scanners, LIS & AI Ecosystems
- 4.3.3 Volatile Global Glass-Slide Supply Constrained CAPEX Planning
- 4.3.4 Data-Center Carbon-Footprint/ESG Limits Long-Term Cloud Storage
- 4.4 Supply-Chain Analysis
- 4.5 Regulatory Landscape
- 4.6 Technological Outlook
- 4.7 Porter's Five Forces
- 4.7.1 Threat of New Entrants
- 4.7.2 Bargaining Power of Buyers
- 4.7.3 Bargaining Power of Suppliers
- 4.7.4 Threat of Substitutes
- 4.7.5 Intensity of Competitive Rivalry
5 Market Size & Growth Forecasts (Value, USD Million)
- 5.1 By Product
- 5.1.1 Whole Slide Imaging Scanners
- 5.1.2 Image Analysis & AI Software
- 5.1.3 Communication & Storage Systems
- 5.1.4 Slide Management Systems & Accessories
- 5.2 By Imaging Technique
- 5.2.1 Brightfield
- 5.2.2 Fluorescence
- 5.3 By Application
- 5.3.1 Disease Diagnosis
- 5.3.2 Drug Discovery & Companion Diagnostics
- 5.3.3 Telepathology & Consultation
- 5.3.4 Education & Training
- 5.3.5 Quality Assurance & Archiving
- 5.4 By End User
- 5.4.1 Hospital & Reference Laboratories
- 5.4.2 Pharmaceutical & Biotechnology Companies & CROs
- 5.4.3 Diagnostic Centers
- 5.4.4 Other End Users
- 5.5 By Deployment Model
- 5.5.1 On-premise
- 5.5.2 Cloud-based / SaaS
- 5.6 By Geography
- 5.6.1 North America
- 5.6.1.1 United States
- 5.6.1.2 Canada
- 5.6.1.3 Mexico
- 5.6.2 Europe
- 5.6.2.1 Germany
- 5.6.2.2 United Kingdom
- 5.6.2.3 France
- 5.6.2.4 Italy
- 5.6.2.5 Spain
- 5.6.2.6 Russia
- 5.6.2.7 Rest of Europe
- 5.6.3 Asia-Pacific
- 5.6.3.1 China
- 5.6.3.2 Japan
- 5.6.3.3 India
- 5.6.3.4 South Korea
- 5.6.3.5 Australia
- 5.6.3.6 Rest of APAC
- 5.6.4 Middle East & Africa
- 5.6.4.1 GCC
- 5.6.4.2 South Africa
- 5.6.4.3 Rest of Middle East & Africa
- 5.6.5 South America
- 5.6.5.1 Brazil
- 5.6.5.2 Argentina
- 5.6.5.3 Rest of South America
- 5.6.1 North America
6 Competitive Landscape
- 6.1 Market Concentration
- 6.2 Market Share Analysis
- 6.3 Company Profiles {(includes Global level Overview, Market level overview, Core Segments, Financials as available, Strategic Information, Market Rank/Share, Products & Services, Recent Developments)}
- 6.3.1 3DHISTECH Ltd.
- 6.3.2 Aiforia Technologies Oy
- 6.3.3 Akoya Biosciences Inc.
- 6.3.4 Danaher Corp. (Leica Biosystems)
- 6.3.5 DeepBio Inc.
- 6.3.6 F. Hoffmann-La Roche Ltd (Ventana)
- 6.3.7 Hamamatsu Photonics K.K.
- 6.3.8 Huron Digital Pathology Inc.
- 6.3.9 Indica Labs Inc.
- 6.3.10 Inspirata Inc.
- 6.3.11 Koninklijke Philips N.V.
- 6.3.12 Mikroscan Technologies Inc.
- 6.3.13 Nikon Corp.
- 6.3.14 Olympus Corp.
- 6.3.15 OptraSCAN Inc.
- 6.3.16 Paige AI Inc.
- 6.3.17 PathAI Inc.
- 6.3.18 Proscia Inc.
- 6.3.19 Sectra AB
- 6.3.20 Visiopharm A/S
- 6.3.21 XIFIN Inc.
7 Market Opportunities & Future Outlook
- 7.1 White-space & Unmet-need Assessment


