
|
시장보고서
상품코드
2113673
디지털 물류 : 시장 점유율 분석, 업계 동향 및 통계, 성장 예측(2026-2031년)Digital Logistics - Market Share Analysis, Industry Trends & Statistics, Growth Forecasts (2026 - 2031) |
||||||
 Mordor Intelligence
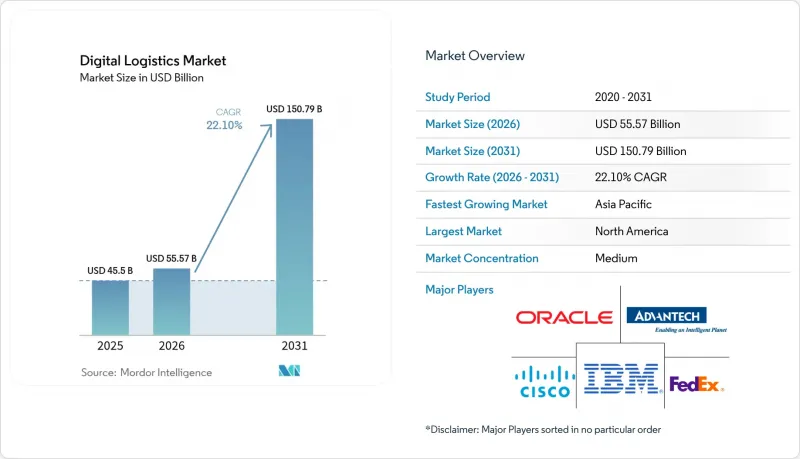
Mordor Intelligence에 의하면, 2026년 디지털 물류 시장 규모는 555억 7,000만 달러로 추정되고 2025년 455억 달러에서 확대해, 2031년에는 1,507억 9,000만 달러에 이를 것으로 예측됩니다.
2026년부터 2031년까지 연평균 성장률(CAGR) 22.1%로 성장할 것으로 전망됩니다.
본 보고서는 유형(솔루션 및 서비스), 도입 형태(클라우드 기반 및 On-Premise형), 시스템/유형(재고 관리, 창고 관리 시스템(WMS), 차량 관리 등), 최종 사용자 산업 분야(소매 및 전자상거래, 제조, 자동차, 제약, 생명과학 등) 및 지역별로 분류되어 있습니다. 시장 전망은 금액(달러) 기준으로 제시되어 있습니다.
세계의 디지털 물류 시장 동향 및 인사이트
북미의 실시간 IoT 차량 텔레매틱스 확대
현재 커넥티드 텔레매틱스 장치는 엔진 상태, 운전자의 운전 행동 및 화물 데이터를 실시간으로 전송하고 있으며, 이를 통해 예측 유지보수가 가능해져 가동 중단 시간을 30% 단축하고 연료 소비량을 15-20% 절감하고 있습니다. 물류 사업자들은 이러한 이점을 활용하여 서비스 수준을 향상시키면서 배출량을 줄이는 보증이 포함된 고부가가치 배송 서비스를 제공합니다. 2032년까지 IoT 물류에 대한 지출이 1,147억 달러를 넘어설 것으로 예상되는 가운데, 특히 지속가능성을 차별화 요인으로 삼고자 하는 운송 사업자들에게 차량 텔레매틱스는 경영진의 최우선 과제가 되고 있습니다.
유럽 3PL 업체들의 AI 기반 예측형 창고 분석 도입
유럽의 각 3PL 기업들은 머신러닝 알고리즘과 컴퓨터 비전을 결합하여 창고의 디지털 트윈을 구축하고, 적재율을 저하시키지 않으면서 재고를 20-30% 줄이고 있습니다. 시나리오 모델링을 통해 운영자는 인력 부족으로 인한 병목 현상을 미연에 방지하고, 피킹 경로 재설정을 몇 시간이 아닌 몇 분 만에 완료할 수 있습니다. 이러한 기능들은 수요 예측과 주문 이행(fulfillment)을 결합한 새로운 부가가치형 계약을 뒷받침하는 기반이 되어, 3PL 각사의 이익률 향상에 기여하고 있습니다.
아프리카 전역의 5G 회랑에 대한 투자 부족
주요 운송 회랑 중 5G 통신 영역이 커버되는 곳은 불과 7%에 불과하여, 국경을 넘는 운송에서 실시간 가시성이 제한되고 있습니다. 통관 절차에는 평균 48-72시간이 소요되는데, 이는 통신 인프라가 잘 갖춰진 지역의 4-6시간에 비해 긴 시간으로, 체류 시간을 늘리고 재고 보유 비용을 증가시키고 있습니다. 이 격차를 해소하려면 약 47억 달러가 필요한 것으로 추산되지만, 이 금액은 현재 민관 차원의 자금 조달 규모를 상회합니다. 그럼에도 불구하고, 시범 회랑에서는 생산성 향상이 나타나기 시작하고 있습니다.
부문 분석
디지털 물류 서비스는 2025년 매출의 32.65%를 차지했으나, 연평균 성장률(CAGR)은 23.55%로 높아 전문 지식의 외주화에 대한 수요가 증가하고 있음을 보여줍니다. 사내에 충분한 인력을 보유하지 못한 기업들은 시스템 통합, 데이터 정제, 지속적인 최적화를 총괄하기 위해 매니지드 서비스 계약을 점점 더 늘리고 있습니다. 솔루션은 여전히 2025년 매출의 나머지 67.35%를 차지하며 많은 혁신 로드맵의 기반이 되었지만, 구매자들은 현재 모놀리식 제품군이 아닌 모듈성과 개방형 API를 기대하고 있습니다. 벤더의 성공은 견고한 핵심 플랫폼과 콜드체인 검증 및 통관 대행과 같은 전문 기능을 지원하는 엄선된 파트너 생태계를 결합하는 데 달려 있습니다. 중견 기업의 도입 사례는 이러한 변화를 여실히 보여주고 있으며, 현재 72%가 자본 지출(CAPEX)을 피하고 ROI를 가속화하기 위해 소프트웨어를 직접 소유하기보다 서비스 계약을 선호하고 있습니다. Tech Mahindra와 같은 벤더들은 로우코드 액셀러레이터와 AI 툴킷을 번들로 제공하여, 고객이 분기 단위가 아닌 며칠 단위로 워크플로우를 재구성할 수 있도록 하고 있습니다. 규제, 수요 패턴, 지속가능성 목표가 진화함에 따라 이러한 유연성은 매우 중요합니다. 벤더들은 모듈 분리 및 ‘사용량 기반 과금’형 비즈니스 모델을 제공함으로써 이에 대응하고 있으며, 디지털 물류 시장의 다양화가 지속될 것임을 보장하고 있습니다.
2025년, 클라우드 플랫폼은 디지털 물류 시장의 57.60%를 차지했으며, 2031년까지 연평균 성장률(CAGR) 22.93%를 나타낼 것으로 예측됩니다. 확장성, 신속한 도입, 그리고 전 세계적인 접근성 덕분에 클라우드 아키텍처는 옴니채널 물류 네트워크에서 기본 선택지가 되었습니다. 기업들은 On-Premise 방식에 비해 도입 주기가 35% 단축되고 총 소유 비용(TCO)이 42% 감소했다고 보고하여, 전환의 경제적 타당성을 입증하고 있습니다. 과거에는 보안이 도입의 장벽이 되었지만, 엔터프라이즈급 암호화, 제로 트러스트 프레임워크 및 소버린 클라우드 옵션 덕분에 우려 사항의 대부분이 해소되었습니다. 데이터 상주 규정이 적용되는 규제가 엄격한 산업에서는 여전히 하이브리드 모델이 채택되고 있지만, 엣지에서 클라우드로 이어지는 아키텍처를 통해 거버넌스를 희생하지 않고도 실시간 처리 수요를 충족할 수 있게 되었습니다. 클라우드 도입률은 북미가 67%로 선두를 달리고 있으며, 유럽이 63%로 그 뒤를 잇고 있습니다. 대역폭 향상과 하이퍼스케일러의 신규 리전 개설에 힘입어 신흥 시장도 빠르게 추격하고 있습니다. On-Premise 구축은 초저지연이 필요한 로봇 공학이나 독자적인 레거시 하드웨어와 같은 틈새 이용 사례에서는 계속해서 활용될 전망이지만, 디지털 물류 시장 전체에서 차지하는 점유율은 꾸준히 축소될 것으로 예측됩니다.
지역별 분석
2025년, 북미는 디지털 물류 시장 매출의 37.55%를 차지했습니다. 높은 전자상거래 보급률, 5G의 광범위한 확산, 그리고 풍부한 벤처 자금이 SaaS 제공업체, 로봇 공학 기업, 프레이트테크 스타트업으로 구성된 활기찬 생태계를 조성하고 있습니다. 물류 사업자 10곳 중 8곳이 2025년까지 최소 한 가지 워크플로우에 AI를 도입할 계획이며, 규제 당국도 자율주행 트럭의 시범 운행을 위한 기반을 착실히 마련하고 있습니다.
아시아태평양은 성장의 원동력이며, 2031년까지 연평균 성장률(CAGR) 23.58%로 확대되고 있습니다. 중국, 인도, 동남아시아는 온라인 소비의 급증과 야심 찬 국가 물류 회랑을 통해 이러한 성장 궤도를 뒷받침하고 있습니다. 크로스보더 판매업체들은 관세 포함 모델과 스마트 로커의 혜택을 누리고 있지만, 데이터 규격의 불일치가 비용을 상승시켜 중소기업 시장 진입을 가로막고 있습니다. 도시 지역의 교통 체증을 배경으로 마이크로 풀필먼트 확충과 이륜차를 이용한 배송이 진행되는 한편, 외딴 섬에서는 인프라 격차를 해소하기 위해 드론이 도입되고 있습니다. 유럽에서는 선진적인 인프라와 정책 주도형 지속가능성이 융합되고 있습니다. 탄소 배출량에 연동된 도로 통행료나 저배출 구역 도입으로 인해, 경로 최적화 소프트웨어와 전기 라스트 마일 배송 차량에 대한 수요가 증가하고 있습니다. 이 지역의 제3자 물류(3PL) 기업들은 인력 부족과 인건비 급등에 대처하기 위해 예측형 창고 분석 도입을 선도하고 있습니다. 중동에서는 석유 의존에서 벗어나기 위해 정부 펀드를 스마트 항만 및 철도망 구축에 투자하고 있습니다. 아프리카의 잠재력은 여전히 5G와 세관 현대화에 좌우되는 반면, 남미에서는 인력 부족에 직면해 있어 이로 인해 창고 관리 시스템(WMS) 도입 비용이 40%나 상승하고 있습니다.
기타 혜택 :
- 엑셀 형식 시장 예측(ME) 시트
- 3개월간의 애널리스트 지원
자주 묻는 질문
목차
제1장 서론
제2장 조사 방법
제3장 주요 요약
제4장 시장 구도
제5장 시장 규모 및 성장 예측
제6장 경쟁 구도
제7장 시장 기회 및 향후 전망
KTH 26.08.26According to Mordor Intelligence, digital logistics market size in 2026 is estimated at USD 55.57 billion, growing from 2025 value of USD 45.5 billion with 2031 projections showing USD 150.79 billion, growing at 22.1% CAGR over 2026-2031.
This report is Segmented by Type (Solutions, and Services), Deployment Mode (Cloud-Based, and On-Premise), System / Type (Inventory Management, Warehouse Management System (WMS), Fleet Management, and More), End-User Vertical (Retail and E-Commerce, Manufacturing, Automotive, Pharmaceuticals, and Life Sciences and More), and Geography. The Market Forecasts are Provided in Terms of Value (USD).
Global Digital Logistics Market Trends and Insights
Expansion of real-time IoT fleet telematics in North America
Connected telematics devices now stream engine health, driver behavior, and cargo data in real-time, enabling predictive maintenance that cuts downtime by 30% and fuel consumption by 15-20%. Logistics providers translate these gains into premium, guaranteed delivery windows that raise service levels while shrinking emissions. With IoT logistics spending expected to top USD 114.7 billion by 2032, fleet telematics has become a boardroom priority, particularly for carriers seeking to differentiate on sustainability.
AI-powered predictive warehouse analytics adoption by European 3PLs
European 3PLs combine machine-learning algorithms and computer vision to create digital twins of warehouses, unlocking inventory reductions of 20-30% without compromising fill rates. Scenario modelling helps operators pre-empt labor bottlenecks and reroute pick paths in minutes rather than hours. These capabilities underpin new value-added contracts that bundle demand forecasting with fulfillment, helping 3PLs move up the margin curve.
Under-investment in 5G corridors across Africa
Only 7% of key transport corridors have 5G coverage, limiting real-time visibility for cross-border hauls. Customs clearance averages 48-72 hours, compared to 4-6 hours in well-connected regions, which prolongs dwell times and increases inventory carry costs. Closing the gap requires an estimated USD 4.7 billion, a figure that exceeds current public-private commitments, though pilot corridors are starting to demonstrate productivity uplifts.
Other drivers and restraints analyzed in the detailed report include:
- Surge in same-day e-commerce fulfillment across Asia
- National green-freight digitalization incentives (Middle East)
- Fragmented data standards blocking cross-border APAC trade
For complete list of drivers and restraints, kindly check the Table Of Contents.
Segment Analysis
Digital logistics services contributed 32.65% to 2025 revenue, but their stronger 23.55% CAGR points to a growing preference for outsourced expertise. Companies short on in-house talent increasingly contract managed services to orchestrate system integration, data cleansing, and continuous optimization. Solutions still generate the remaining 67.35% of 2025 revenue and anchor many transformation roadmaps, yet buyers now expect modularity and open APIs rather than monolithic suites. Vendor success hinges on coupling a robust core platform with curated partner ecosystems that address specialized functions such as cold-chain validation or customs brokerage. Mid-market adopters illustrate the shift; 72% now favor service contracts over direct software ownership to avoid capex and accelerate ROI. Providers such as Tech Mahindra bundle low-code accelerators and AI toolkits, allowing clients to reconfigure workflows in days rather than quarters. This flexibility is crucial as regulations, demand patterns, and sustainability targets evolve. Solution vendors respond by unbundling modules and offering pay-as-you-scale commercial models, ensuring the digital logistics market continues to diversify.
Cloud platforms accounted for a 57.60% share of the digital logistics market in 2025 and are expected to grow at a 22.93% CAGR through 2031. Scalability, rapid deployment, and global accessibility make cloud architectures the default choice for omnichannel logistics networks. Companies report deployment cycles 35% faster and total cost of ownership 42% lower than on-premise alternatives, underscoring the economic rationale for migration. Security once hindered adoption, but enterprise-grade encryption, zero-trust frameworks, and sovereign cloud options have alleviated most concerns. Hybrid models persist in highly regulated verticals where data-residency rules apply, yet edge-to-cloud architectures now satisfy real-time processing demands without relinquishing governance. North America leads with 67% cloud adoption, closely followed by Europe at 63%. Emerging markets are catching up as bandwidth improves and hyperscalers launch new regional zones. On-premise deployments will continue to serve niche use cases involving ultra-low-latency robotics or proprietary legacy hardware, but their share of the digital logistics market size is projected to contract steadily.
Complete Report Scope:
- By Component
- Solutions
- Services
- By Deployment Mode
- Cloud-based
- On-premise
- By System / Type
- Inventory Management
- Warehouse Management System (WMS)
- Fleet Management
- Data Management and Analytics
- Tracking and Monitoring
- Other Types
- By End-user Vertical
- Retail and E-commerce
- Manufacturing
- Automotive
- Pharmaceuticals and Life Sciences
- Food and Beverage
- Oil and Gas and Energy
- Consumer Packaged Goods
- Other End-user Verticals
- By Geography
- North America
- United States
- Canada
- Mexico
- South America
- Brazil
- Argentina
- Rest of South America
- Europe
- United Kingdom
- Germany
- France
- Spain
- Italy
- Rest of Europe
- Asia-Pacific
- China
- India
- Japan
- Australia
- South Korea
- Rest of Asia-Pacific
- Middle East and Africa
- Middle East
- Saudi Arabia
- United Arab Emirates
- Turkey
- Rest of Middle East
- Africa
- South Africa
- Kenya
- Rest of Africa
- Middle East
- North America
Geography Analysis
North America commanded 37.55% of the digital logistics market revenue in 2025. Deep e-commerce penetration, widespread 5G rollouts and abundant venture funding nurture a vibrant ecosystem of SaaS providers, robotics firms and freight-tech start-ups. Eight in ten logistics operators plan to embed AI in at least one workflow by 2025, while regulators steadily open corridors for autonomous trucking trials.
Asia-Pacific is the growth engine, expanding at a 23.58% CAGR through 2031. China, India, and Southeast Asia underpin this trajectory with surging online consumption and ambitious national logistics corridors. Cross-border sellers benefit from duty-paid models and smart lockers, yet fragmented data standards inflate costs and curb small-business participation. Urban congestion prompts micro-fulfillment build-outs and two-wheel deliveries, whereas remote islands adopt drones to bridge infrastructure gaps. Europe blends advanced infrastructure with policy-driven sustainability. Carbon-linked road tolls and low-emission zones amplify demand for routing software and electric last-mile fleets. The region's 3PLs pioneer predictive warehouse analytics to counter labor shortages and rising wage bills. The Middle East channels sovereign funds into smart ports and rail links to diversify beyond oil. Africa's potential remains tied to 5G and customs modernization, while South America contends with talent deficits that inflate WMS implementation costs by 40%.
- SAP SE
- IBM Corporation
- Oracle Corporation
- Honeywell International Inc.
- Advantech Co. Ltd.
- Blue Yonder (Formerly JDA Software)
- Manhattan Associates Inc.
- Korber Supply Chain (HighJump)
- Tech Mahindra Ltd.
- Infosys Ltd.
- HCL Technologies Ltd.
- Amazon Web Services (AWS)
- DHL Group
- FedEx Corp.
- Cisco Systems Inc.
- Trimble Inc.
- Verizon Communications Inc.
- Bosch Software Innovations GmbH
- Maersk Digital
- Vinculum Group
- Hexaware Technologies Ltd.
Additional Benefits:
- The market estimate (ME) sheet in Excel format
- 3 months of analyst support
TABLE OF CONTENTS
1 INTRODUCTION
- 1.1 Study Assumptions and Market Definition
- 1.2 Scope of the Study
2 RESEARCH METHODOLOGY
3 EXECUTIVE SUMMARY
4 MARKET LANDSCAPE
- 4.1 Market Overview
- 4.2 Market Drivers
- 4.2.1 Expansion of Real-time IoT Fleet Telematics in North America
- 4.2.2 AI-powered Predictive Warehouse Analytics Adoption by European 3PLs
- 4.2.3 Surge in Same-day E-commerce Fulfilment Across Asia
- 4.2.4 National Green-Freight Digitalization Incentives (Middle East)
- 4.2.5 Automotive-OEM Direct-to-Consumer Digital Logistics Programs
- 4.2.6 Post-COVID Pharma Cold-Chain Digitization Mandates in Europe
- 4.3 Market Restraints
- 4.3.1 Under-investment in 5G Corridors across Africa
- 4.3.2 Fragmented Data-standards Blocking Cross-Border APAC Trade
- 4.3.3 Cyber-insurance Premium Spikes for Cloud-Logistics Platforms
- 4.3.4 Skilled-WMS-Talent Shortage in Latin America
- 4.4 Value Chain Analysis
- 4.5 Regulatory or Technological Outlook
- 4.6 Porter's Five Forces Analysis
- 4.6.1 Bargaining Power of Suppliers
- 4.6.2 Bargaining Power of Consumers
- 4.6.3 Threat of New Entrants
- 4.6.4 Intensity of Competitive Rivalry
- 4.6.5 Threat of Substitute Products
5 MARKET SIZE AND GROWTH FORECASTS (VALUE)
- 5.1 By Component
- 5.1.1 Solutions
- 5.1.2 Services
- 5.2 By Deployment Mode
- 5.2.1 Cloud-based
- 5.2.2 On-premise
- 5.3 By System / Type
- 5.3.1 Inventory Management
- 5.3.2 Warehouse Management System (WMS)
- 5.3.3 Fleet Management
- 5.3.4 Data Management and Analytics
- 5.3.5 Tracking and Monitoring
- 5.3.6 Other Types
- 5.4 By End-user Vertical
- 5.4.1 Retail and E-commerce
- 5.4.2 Manufacturing
- 5.4.3 Automotive
- 5.4.4 Pharmaceuticals and Life Sciences
- 5.4.5 Food and Beverage
- 5.4.6 Oil and Gas and Energy
- 5.4.7 Consumer Packaged Goods
- 5.4.8 Other End-user Verticals
- 5.5 By Geography
- 5.5.1 North America
- 5.5.1.1 United States
- 5.5.1.2 Canada
- 5.5.1.3 Mexico
- 5.5.2 South America
- 5.5.2.1 Brazil
- 5.5.2.2 Argentina
- 5.5.2.3 Rest of South America
- 5.5.3 Europe
- 5.5.3.1 United Kingdom
- 5.5.3.2 Germany
- 5.5.3.3 France
- 5.5.3.4 Spain
- 5.5.3.5 Italy
- 5.5.3.6 Rest of Europe
- 5.5.4 Asia-Pacific
- 5.5.4.1 China
- 5.5.4.2 India
- 5.5.4.3 Japan
- 5.5.4.4 Australia
- 5.5.4.5 South Korea
- 5.5.4.6 Rest of Asia-Pacific
- 5.5.5 Middle East and Africa
- 5.5.5.1 Middle East
- 5.5.5.1.1 Saudi Arabia
- 5.5.5.1.2 United Arab Emirates
- 5.5.5.1.3 Turkey
- 5.5.5.1.4 Rest of Middle East
- 5.5.5.2 Africa
- 5.5.5.2.1 South Africa
- 5.5.5.2.2 Kenya
- 5.5.5.2.3 Rest of Africa
- 5.5.5.1 Middle East
- 5.5.1 North America
6 COMPETITIVE LANDSCAPE
- 6.1 Market Concentration
- 6.2 Strategic Moves
- 6.3 Market Share Analysis
- 6.4 Company Profiles (includes Global level Overview, Market level overview, Core Segments, Financials as available, Strategic Information, Market Rank/Share, Products and Services, Recent Developments)
- 6.4.1 SAP SE
- 6.4.2 IBM Corporation
- 6.4.3 Oracle Corporation
- 6.4.4 Honeywell International Inc.
- 6.4.5 Advantech Co. Ltd.
- 6.4.6 Blue Yonder (Formerly JDA Software)
- 6.4.7 Manhattan Associates Inc.
- 6.4.8 Korber Supply Chain (HighJump)
- 6.4.9 Tech Mahindra Ltd.
- 6.4.10 Infosys Ltd.
- 6.4.11 HCL Technologies Ltd.
- 6.4.12 Amazon Web Services (AWS)
- 6.4.13 DHL Group
- 6.4.14 FedEx Corp.
- 6.4.15 Cisco Systems Inc.
- 6.4.16 Trimble Inc.
- 6.4.17 Verizon Communications Inc.
- 6.4.18 Bosch Software Innovations GmbH
- 6.4.19 Maersk Digital
- 6.4.20 Vinculum Group
- 6.4.21 Hexaware Technologies Ltd.
7 MARKET OPPORTUNITIES AND FUTURE OUTLOOK
- 7.1 White-space and Unmet-need Assessment