

|
시장보고서
상품코드
2113711
시추액 및 완성액 : 시장 점유율 분석, 업계 동향 및 통계, 성장 예측(2026-2031년)Drilling And Completion Fluids - Market Share Analysis, Industry Trends & Statistics, Growth Forecasts (2026 - 2031) |
||||||
 Mordor Intelligence
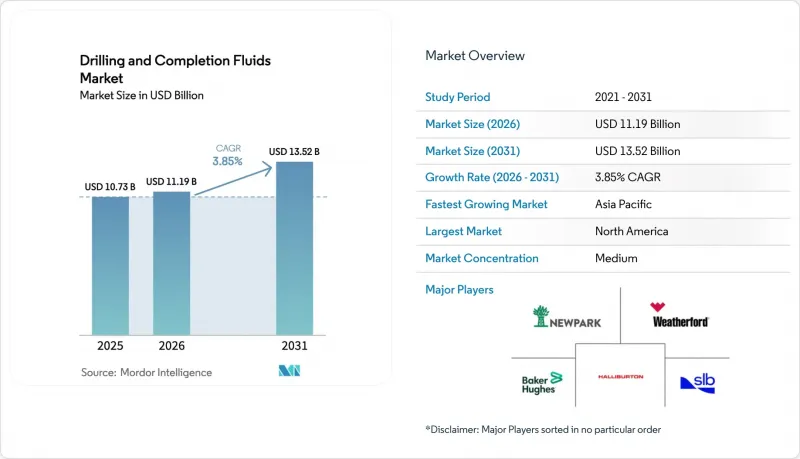
시추액 및 완성액 시장 규모는 2025년 107억 3,000만 달러로 평가되었습니다. 2026년에는 111억 9,000만 달러로 확대되고 2026년부터 2031년에 걸쳐 CAGR 3.85%로 성장을 지속하여, 2031년까지 135억 2,000만 달러에 이를 것으로 예측됩니다.
본 보고서는 유체 유형(수성, 유성, 합성, 공기, 기타), 시추 단계(시추용 유체, 완공·개수용 유체), 유정 유형(전통형 및 비전통형), 용도(육상 및 해상), 그리고 지역(북미, 유럽, 아시아태평양, 남미, 중동 및 아프리카)별로 분류되어 있습니다.
세계의 시추액 및 완성액 시장 동향과 인사이트
심해 및 초심해 시추 프로젝트가 유체 사양을 재정의
심해 유정에서는 유정당 3,000-5,000 배럴의 유체가 소비되며, 고압·고온(HPHT) 조건이 적용됩니다. 따라서 페트로브라스의 프레솔트 프로그램에서 볼 수 있듯이 저류층 압력이 1만 5,000 psi에 달하는 경우, 18 lb/gal을 초과하는 ECD를 달성하려면 세슘 포메이트 염수와 혼합된 합성 머드가 필요합니다. 에퀴놀(Equinor)의 요한 카스트버그(Johan Kastberg) 북극 프로젝트에서는 디젤계 시멘트 사용 금지 조치 하에서 합성계 시스템을 채택함으로써 비생산 시간을 18% 단축했습니다. 토탈에너지(TotalEnergies)는 Mero 4 프로젝트에서 셰일 억제 효과를 유지하면서 브라질의 시추 잔해물 규제를 충족하기 위해 내부 올레핀계 합성 유체를 채택했습니다. 이러한 고사양 유정은 유정당 유체 가치를 높여, 수는 적지만 수익성이 높은 해양 프로젝트에 수요를 집중시키고 있습니다. 나미비아 및 수리남으로의 시추 장비 신속 이동으로 인해, 예측 기간 동안 이러한 추세가 더욱 강화될 것으로 보입니다.
비전통적 저류층의 확대가 마찰 저감제 및 점토 안정제 수요를 견인
퍼미안 분지의 1만 2,000피트를 초과하는 연장 리치 측정구에서는 폴리아크릴아미드계 마찰 저감제를 사용하여 펌프 압력과 토크를 줄이고 있습니다. 아르헨티나의 바카 무에르타에서는 캡슐화된 폴리머를 함유한 염화칼륨 기반 시멘트가 사용되어, 벤토나이트 기반 시스템에 비해 유정 불안정으로 인한 사고를 22% 감소시켰습니다. 중국석유천연가스그룹(CNPC)은 오르도스 타이트 샌드층에서 유체 손실을 5mL/30분 미만으로 억제하는 나노 실리카계 실란트를 첨가함으로써 시추 속도를 15% 향상시켰습니다. 이러한 화학 기술의 개선은 완공 유체에서도 볼 수 있으며, 점도 저감제 및 계면활성제가 프로판트의 수송 효율과 회수율을 향상시키고 있습니다.
원유 가격 변동이 업스트림 부문의 자본 배분을 압박
2025년 브렌트 원유 가격은 평균 78달러/배럴로, 2024년의 84달러/배럴에서 하락했습니다. 이로 인해 콘코Philips가 2025년 3분기 실적 설명회에서 지적한 바와 같이, 퍼미안 분지의 여러 독립 기업들은 시추 장비의 9%를 가동 중단하고, 가격이 배럴당 80달러를 넘을 때까지 완공 작업을 연기하게 되었습니다. 국제에너지기구(IEA) 보고서에 따르면, 업스트림 부문의 설비 투자액은 2019년 실질 수준보다 15% 낮은 상태를 유지했으며, 그중에서도 재량적 시추 프로젝트의 감축 폭이 가장 컸다고 합니다. 서아프리카에서는 재정적 압박으로 인해 앙골라와 나이지리아의 시추 계획이 연기됨에 따라 가동 중인 시추 장비 수가 11% 감소했고, 이로 인해 시추용 유체 수주가 직접적으로 감소했습니다. 시추용 유체는 시추 비용의 불과 4%-7%만을 차지하기 때문에 사업자가 경비 절감을 단행할 때 가장 먼저 삭감되거나 중단되는 항목 중 하나입니다.
부문별 분석
합성계 시추 유체는 해양 시장에서 점유율을 확대하고 있으며, 2031년까지 연평균 성장률(CAGR) 5.8%를 나타낼 것으로 예측되어, 시추·마감 유체 시장 전체를 상회하는 속도로 성장할 것으로 전망됩니다. 수성 제품은 2025년 매출의 57.1%를 차지했으며, 합성 제품보다 40%-50% 저렴하기 때문에 육상 셰일층에서 선호되었습니다. 규제 당국이 절삭 부스러기에 대한 규제를 강화함에 따라 유성 진흙 용액 시장 점유율은 줄어들고 있는 반면, 공압식 유체는 사용량이 3% 미만으로 틈새 시장 수준에 머물러 있습니다. 베이커 휴즈의 ‘SYN-TEQ’와 같은 내부 올레핀계 시스템은 2025년 멕시코만 하부 제3기 지층 유정에서 350°F의 유정 바닥 온도를 견뎌냈습니다. 슈렘베르제(Schlumberger)의 ‘RHELIANT’와 같은 신흥 나노 제제는 중동의 롱 리치(Long Reach) 유정에서 윤활성을 24% 향상시켰습니다. 이러한 진전은 사양 주도형 수요가 프리미엄 유체 카테고리에 가치를 집중시키고 있음을 여실히 보여줍니다.
수성 기술도 진화하고 있습니다. 할리버튼의 ‘Baracarb’ 블렌드는 북미 육상 시추 구간의 18%에서 유성 진흙과 동등한 셰일 억제 성능을 달성하는 동시에 폐기 처리 비용을 절감했습니다. 비용이 최적화된 폴리머 패키지를 통해 육상 운영사는 ROP를 희생하지 않고도 희석률을 낮출 수 있어, 활동이 활발한 분지에서 지속적인 우위를 확보하고 있습니다. 전반적으로, 해양 HPHT 프로젝트 증가로 인해 수성 시스템이 판매량의 기반을 형성하고 규제 당국의 공감을 불러일으키는 지속가능성 스토리를 제공하는 한편, 합성 유체는 시추액 및 완성액 시장의 성장 동력으로 계속 자리매김할 것이 확실합니다.
시추 유체는 2025년 수요의 70.5%를 차지했지만, 완공 및 개량용 유체는 운영사의 우선순위에서 저류층과의 접촉 품질이 순수한 시추 속도를 능가함에 따라 4.9%라는 더 높은 연평균 성장률(CAGR)을 보일 것으로 예측됩니다. 옥시덴탈(Occidental)사가 울프캠프(Wolf Camp)층의 완공 작업에 사용한 포르메이트계 브라인은 초기 생산량을 11% 끌어올렸으며, 배럴당 가격을 30%-40% 인상할 정당한 근거가 되었습니다. 다단식 수압 파쇄에서는 밀도 제어 요건이 엄격해지기 때문에 파쇄 형상 관리에는 고품질의 염수나 섬유를 배합한 시스템이 필수적입니다. 웨더포드(Weatherford)사의 ‘Frac-Pac’ 유체는 2025년에 230개 유정에서 실시간 파쇄 매핑을 가능하게 하여, 유체와 파쇄를 통합한 워크플로우의 추세를 강화하고 있습니다.
그럼에도 불구하고 시추 유체의 혁신은 계속되고 있습니다. 뉴파크(Newpark)사의 ‘에볼루션(Evolution)’ 생분해성 폴리머 시스템은 멕시코만 연안의 셰일 유정에서 희석량을 19% 줄이고, 첨가제 단가가 상승했음에도 불구하고 유체 총 비용을 절감했습니다. 시추와 완공 워크플로우의 경계가 모호해짐에 따라, 두 유체 단계를 모두 포함하는 장기 단일 공급업체 계약이 촉진되고 있으며, 유정의 전체 수명 주기에 걸친 종합적인 유체 엔지니어링의 가치가 높아지고 있습니다.
지역별 분석
북미 시장 규모에서의 우위는 퍼미안 분지에 뿌리를 두고 있지만, 캐나다와 알래스카의 신흥 타이트 오일 생산 지역에서도 시추 비용과 배출량을 줄이기 위해 디지털 유체 시스템이 도입되고 있습니다. 아시아태평양의 현지화가 급증하면서 공급망의 단축으로의 전환이 시사되고 있으며, 유럽과 미국의 서비스 기업들은 공장을 건설하거나 시장 점유율을 양보할 것인지의 선택에 직면해 있습니다. 유럽의 유체 수요는 점점 더 합성 유체로 전환되고 있으며, 2025년 노르웨이 유정의 89%에서는 더욱 엄격해진 배출 규제 하에 수성 또는 합성 혼합물이 사용되었습니다. 남미의 프레솔트층 유정은 유정당 유체 비용이 세계 최고 수준이기 때문에 브라질의 블렌딩 거점에 대한 공급업체들의 투자가 지속되고 있습니다. 중동에서는 탄산염암 저류층의 무결성을 유지하기 위한 고압·고H2S 함유 완공용 브라인에 대해 여전히 높은 가격이 지불되고 있습니다. 아프리카의 전망은 앙골라와 나이지리아에서 보류되었던 탐사 활동을 재개하기 위한 재정 개혁에 달려 있습니다. 이러한 개혁이 없으면 유체 수요가 다른 개척 분지에 비해 부진할 위험이 있습니다.
기타 혜택 :
- 엑셀 형식 시장 예측(ME) 시트
- 3개월간의 애널리스트 지원
자주 묻는 질문
목차
제1장 서론
제2장 조사 방법
제3장 주요 요약
제4장 시장 구도
제5장 시장 규모 및 성장 예측
제6장 경쟁 구도
제7장 시장 기회 및 향후 전망
KTH 26.08.26According to Mordor Intelligence, the drilling and completion fluids market size is expected to grow from USD 10.73 billion in 2025 to USD 11.19 billion in 2026 and is forecast to reach USD 13.52 billion by 2031 at 3.85% CAGR over 2026-2031.
This report is Segmented by Fluid Base (Water-Based, Oil-Based, Synthetic-Based, Pneumatic, and Other Bases), Drilling Stage (Drilling Fluids and Completion and Work-Over Fluids), Well Type (Conventional and Unconventional), Application (Onshore and Offshore), and Geography (North America, Europe, Asia-Pacific, South America, and Middle East and Africa).
Global Drilling And Completion Fluids Market Trends and Insights
Deep-Water And Ultra-Deep-Water Campaigns Reshape Fluid Specifications
Deep-water wells consume 3,000-5,000 barrels of fluid each and impose HPHT conditions that demand synthetic muds blended with cesium formate brines to achieve ECDs above 18 lb/gal, as seen in Petrobras' pre-salt programs, where reservoir pressure reaches 15,000 psi. Equinor's Johan Castberg Arctic project showed synthetic systems trimmed non-productive time by 18% under discharge bans on diesel-based mud. TotalEnergies adopted internal-olefin synthetic fluids on Mero 4 to satisfy Brazilian cuttings rules while maintaining shale inhibition. These high-spec wells elevate per-well fluid value and concentrate demand in fewer, but more lucrative, offshore campaigns. Rapid rig mobilization to Namibia and Suriname is expected to reinforce this pattern through the forecast period.
Unconventional Reservoir Expansion Drives Friction-Reducer And Clay-Stabilizer Demand
Extended-reach laterals exceeding 12,000 ft in the Permian Basin rely on polyacrylamide friction reducers to cut pump pressure and torque. Argentina's Vaca Muerta uses potassium-chloride muds with encapsulating polymers that lowered wellbore-instability incidents by 22% versus bentonite systems. CNPC achieved 15% faster footage in Ordos tight sand by adding nano-silica sealants that kept fluid loss below 5 mL/30 min. These chemistry upgrades also appear in completion fluids, where viscosity breakers and surfactants improve proppant transport and recovery factors.
Oil Price Volatility Compresses Upstream Capital Allocation
Brent averaged USD 78/bbl in 2025, down from USD 84/bbl in 2024, prompting several Permian independents to park 9% of rigs and defer completions until prices exceed USD 80/bbl, as noted by ConocoPhillips in its Q3 2025 call. The IEA reported upstream capex remaining 15% below 2019 real-terms levels, with discretionary drilling projects bearing the sharpest cuts. West Africa's active rig count slipped 11% after Angolan and Nigerian programs were postponed under fiscal stress, directly trimming fluid orders. Because fluids make up only 4%-7% of well cost, they are among the first line items downgraded or canceled when operators retrench.
Other drivers and restraints analyzed in the detailed report include:
- Environmental Regulations Accelerate Synthetic And Water-Based Fluid Adoption
- Digital Optimization Platforms Enable Real-Time Fluid Adjustments
- Discharge Regulations Force Costly Fluid Substitutions
For complete list of drivers and restraints, kindly check the Table Of Contents.
Segment Analysis
Synthetic-based fluids captured a growing offshore share and are projected to register a 5.8% CAGR to 2031, outpacing the overall drilling and completion fluids market. Water-based products held 57.1% of 2025 revenue, favored in onshore shale where they undercut synthetic prices by 40%-50%. Oil-based muds are retreating as regulators tighten cuttings rules, while pneumatic fluids stay niche at <3% volume. Internal-olefin systems, such as Baker Hughes' SYN-TEQ, handled 350 °F bottom-hole temperatures in Gulf of Mexico lower tertiary wells during 2025. Emerging nano-formulations like Schlumberger's RHELIANT improved lubricity by 24% on Middle East extended-reach wells. These advances underscore how specification-driven demand is concentrating value in premium fluid categories.
Water-based technology also evolves: Halliburton's Baracarb blend attained shale inhibition parity with oil-based muds across 18% of North America's land footage while eliminating disposal fees. Cost-optimized polymer packages allow land operators to trim dilution rates without sacrificing ROP, supporting continued dominance in high-activity basins. Overall, escalating offshore HPHT projects ensure synthetic fluids remain the growth engine of the drilling and completion fluids market, even as water-based systems anchor volume and offer a sustainability narrative that resonates with regulators.
Drilling fluids retained 70.5% of 2025 demand, yet completion and work-over fluids are positioned for a faster 4.9% CAGR as reservoir contact quality eclipses pure drilling speed in operator priorities. Formate-based brines used by Occidental in Wolfcamp completions lifted initial production 11%, justifying 30%-40% higher barrel pricing. Multi-stage hydraulic fracturing intensifies density-control requirements, making premium brines and fiber-laden systems indispensable for fracture geometry management. Weatherford's Frac-Pac fluids enabled real-time fracture mapping on 230 wells in 2025, reinforcing the trend toward integrated fluid-frac workflows.
Drilling fluid innovation nevertheless continues: Newpark's Evolution biodegradable polymer system cut dilution 19% on Gulf Coast shale wells, lowering total fluid cost despite higher additive unit prices. Blurring lines between drilling and completion workflows encourages long-term, single-provider contracts that bundle both fluid phases, reinforcing the value of holistic fluid engineering throughout the well life cycle.
Complete Report Scope:
- By Fluid Base
- Water-based
- Oil-based
- Synthetic-based
- Pneumatic (air, mist, foam)
- Other Bases (ester, glycol, nano-fluids)
- By Drilling Stage
- Drilling Fluids
- Completion and Work-over Fluids
- By Well Type
- Conventional
- Unconventional
- By Application
- Onshore
- Offshore
- By Geography
- North America
- United States
- Canada
- Mexico
- Europe
- United Kingdom
- Norway
- Russia
- Ukraine
- Rest of Europe
- Asia-Pacific
- China
- India
- ASEAN Countries
- Australia
- Rest of Asia-Pacific
- South America
- Brazil
- Argentina
- Colombia
- Rest of South America
- Middle East and Africa
- Saudi Arabia
- United Arab Emirates
- Qatar
- Nigeria
- Algeria
- Rest of Middle East and Africa
- North America
Geography Analysis
North America's market size advantage is anchored in the Permian Basin, but emerging tight-oil plays in Canada and Alaska also deploy digital fluid systems to cut well costs and emissions. Asia-Pacific's localization surge signals a shift toward shorter supply chains, compelling Western service companies either to build plants or cede share. Europe's fluid demand is increasingly synthetic; 89% of 2025 Norwegian wells used water-based or synthetic formulations under stricter discharge rules. South America's pre-salt wells carry some of the highest fluid spend per hole worldwide, explaining sustained vendor investment in Brazilian blending hubs. The Middle East continues to pay premiums for HP high-H2S completion brines that preserve carbonate reservoir integrity. Africa's outlook will hinge on fiscal reforms that can reignite shelved exploration in Angola and Nigeria; without them, fluid demand risks under-performance relative to other frontier basins.
- Baker Hughes Company
- Schlumberger Limited
- Halliburton Company
- Weatherford International plc
- Newpark Resources Inc.
- TETRA Technologies Inc.
- National Oilwell Varco Inc.
- CES Energy Solutions Corp.
- Chevron Phillips Chemical Co. LLC
- M-I SWACO (SLB)
- Scomi Energy Services Bhd
- AES Drilling Fluids LLC
- Anchor Drilling Fluids USA
- Flotek Industries Inc.
- Gumpro Drilling Fluids Pvt Ltd
- Oilfield Chemical Co. Baker Petrolite
- Petrochem Performance Chemicals Ltd
- Q'Max Solutions Inc.
- IMDEX Limited (AMC Drilling Fluids)
- Valence Drilling Fluids LLC
Additional Benefits:
- The market estimate (ME) sheet in Excel format
- 3 months of analyst support
TABLE OF CONTENTS
1 Introduction
- 1.1 Study Assumptions & Market Definition
- 1.2 Scope of the Study
2 Research Methodology
3 Executive Summary
4 Market Landscape
- 4.1 Market Overview
- 4.2 Global Onshore & Offshore Active Rig Count
- 4.3 Historic & Forecast Upstream CAPEX - Onshore vs Offshore
- 4.4 Major Upcoming Upstream Projects
- 4.5 Market Drivers
- 4.5.1 Rising deep-water and ultra-deep-water drilling campaigns
- 4.5.2 Expansion of unconventional (shale & tight) reservoirs
- 4.5.3 Environmental push toward low-toxicity, water-based and synthetic fluids
- 4.5.4 Digitally enabled drilling fluid optimization & real-time rheology control
- 4.5.5 Circular-economy models for recycling and re-conditioning spent mud
- 4.5.6 National oil company (NOC) localization programs driving regional fluid manufacturing
- 4.6 Market Restraints
- 4.6.1 Volatile crude-oil price cycles delaying drilling budgets
- 4.6.2 Stringent discharge regulations on oil-based mud cuttings
- 4.6.3 Supply chain tightness of specialty polymer & barite additives
- 4.6.4 Rising adoption of managed-pressure drilling that lowers fluid volumes
- 4.7 Supply-Chain Analysis
- 4.8 Technological Outlook
- 4.9 Regulatory Landscape
- 4.10 Porter's Five Forces
- 4.10.1 Bargaining Power of Suppliers
- 4.10.2 Bargaining Power of Buyers
- 4.10.3 Threat of New Entrants
- 4.10.4 Threat of Substitutes
- 4.10.5 Competitive Rivalry
5 Market Size & Growth Forecasts
- 5.1 By Fluid Base
- 5.1.1 Water-based
- 5.1.2 Oil-based
- 5.1.3 Synthetic-based
- 5.1.4 Pneumatic (air, mist, foam)
- 5.1.5 Other Bases (ester, glycol, nano-fluids)
- 5.2 By Drilling Stage
- 5.2.1 Drilling Fluids
- 5.2.2 Completion and Work-over Fluids
- 5.3 By Well Type
- 5.3.1 Conventional
- 5.3.2 Unconventional
- 5.4 By Application
- 5.4.1 Onshore
- 5.4.2 Offshore
- 5.5 By Geography
- 5.5.1 North America
- 5.5.1.1 United States
- 5.5.1.2 Canada
- 5.5.1.3 Mexico
- 5.5.2 Europe
- 5.5.2.1 United Kingdom
- 5.5.2.2 Norway
- 5.5.2.3 Russia
- 5.5.2.4 Ukraine
- 5.5.2.5 Rest of Europe
- 5.5.3 Asia-Pacific
- 5.5.3.1 China
- 5.5.3.2 India
- 5.5.3.3 ASEAN Countries
- 5.5.3.4 Australia
- 5.5.3.5 Rest of Asia-Pacific
- 5.5.4 South America
- 5.5.4.1 Brazil
- 5.5.4.2 Argentina
- 5.5.4.3 Colombia
- 5.5.4.4 Rest of South America
- 5.5.5 Middle East and Africa
- 5.5.5.1 Saudi Arabia
- 5.5.5.2 United Arab Emirates
- 5.5.5.3 Qatar
- 5.5.5.4 Nigeria
- 5.5.5.5 Algeria
- 5.5.5.6 Rest of Middle East and Africa
- 5.5.1 North America
6 Competitive Landscape
- 6.1 Market Concentration
- 6.2 Strategic Moves (M&A, Partnerships, PPAs)
- 6.3 Market Share Analysis (Market Rank/Share for key companies)
- 6.4 Company Profiles (includes Global level Overview, Market level overview, Core Segments, Financials as available, Strategic Information, Products & Services, and Recent Developments)
- 6.4.1 Baker Hughes Company
- 6.4.2 Schlumberger Limited
- 6.4.3 Halliburton Company
- 6.4.4 Weatherford International plc
- 6.4.5 Newpark Resources Inc.
- 6.4.6 TETRA Technologies Inc.
- 6.4.7 National Oilwell Varco Inc.
- 6.4.8 CES Energy Solutions Corp.
- 6.4.9 Chevron Phillips Chemical Co. LLC
- 6.4.10 M-I SWACO (SLB)
- 6.4.11 Scomi Energy Services Bhd
- 6.4.12 AES Drilling Fluids LLC
- 6.4.13 Anchor Drilling Fluids USA
- 6.4.14 Flotek Industries Inc.
- 6.4.15 Gumpro Drilling Fluids Pvt Ltd
- 6.4.16 Oilfield Chemical Co. Baker Petrolite
- 6.4.17 Petrochem Performance Chemicals Ltd
- 6.4.18 Q'Max Solutions Inc.
- 6.4.19 IMDEX Limited (AMC Drilling Fluids)
- 6.4.20 Valence Drilling Fluids LLC
7 Market Opportunities & Future Outlook
- 7.1 White-space & Unmet-Need Assessment


