|
시장보고서
상품코드
2113795
촉매 재생 : 시장 점유율 분석, 업계 동향 및 통계, 성장 예측(2026-2031년)Catalyst Regeneration - Market Share Analysis, Industry Trends & Statistics, Growth Forecasts (2026 - 2031) |
||||||
 Mordor Intelligence
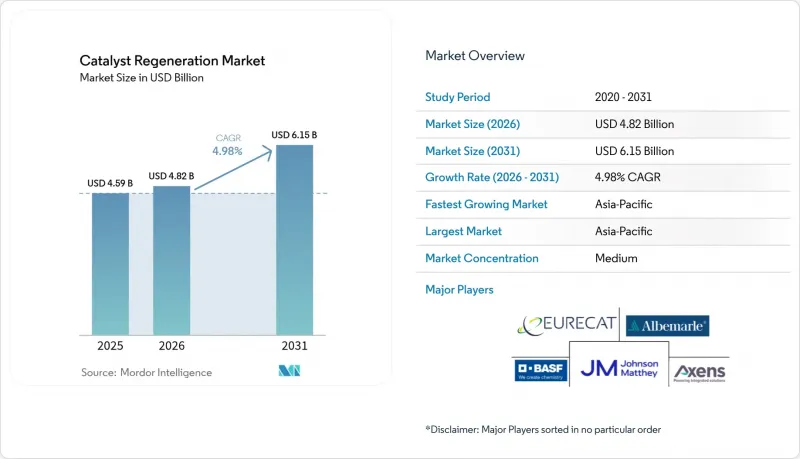
Mordor Intelligence에 의하면, 촉매 재생 시장 규모는 2025년에 45억 9,000만 달러로 평가되었습니다. 2026년 48억 2,000만 달러에서 2031년까지 61억 5,000만 달러에 이를 것으로 예상되며, 예측 기간(2026-2031년) CAGR은 4.98%를 나타낼 전망입니다.
본 보고서는 방식별(엑시투 및 인시투), 용도별(정유시설 및 석유화학 단지, 환경, 에너지 및 전력, 기타 용도), 지역별(아시아태평양, 북미, 유럽, 남미, 중동 및 아프리카)로 분류되어 있습니다. 시장 예측은 금액(달러)으로 표시되어 있습니다.
세계의 촉매 재생 시장 동향 및 인사이트
정유시설 및 석유화학 플랜트의 배출에 관한 엄격한 환경 규제
각국 및 각 지역의 규제 당국은 허용 배출 한도를 엄격하게 적용하고 있으며, 이로 인해 촉매 재활용의 경제성이 변화하고 있습니다. 미국 환경보호청(EPA)이 개정한 유해 대기 오염 물질 기준에 따라 독성 물질 배출량이 연간 2,200 쇼트톤 감소하여, 연간 1억 달러 이상의 금전적 가치를 지닌 건강상의 이점이 발생할 것으로 전망됩니다. 캘리포니아주의 저탄소 연료 기준(LCFS)에서는 2030년까지 연료 주기의 탄소 강도를 30%, 2045년까지 90% 감축할 것을 요구하고 있으며, 라이프사이클 회계 규정을 준수하기 위해 재생 촉매에 대한 수요가 증가하고 있습니다. EU의 산업 배출 지침에서는 폐기물 처리 분야의 ‘최적 이용 기술(BAT)’에 촉매 재생이 포함되어 있으며, 규정 준수를 중시하는 관점에서 매립 처분보다 재생이 우선시되는 경향이 더욱 강해지고 있습니다. 아시아 전역에서도 유사한 규제안이 마련되고 있어, 이러한 움직임의 영향이 급속히 확산될 것으로 확실시되고 있습니다.
신규 촉매에 대한 비용 압박 심화
팔라듐, 백금, 로듐의 가격 변동으로 인해 신규 촉매 조달은 리스크가 높은 예산 항목이 되었습니다. 학술적 평가에 따르면, 경미한 오염 상태의 수소화 처리용 촉매를 재생함으로써 신규 공급 비용의 절반 이하로 기준 활성도의 80% 이상을 회복할 수 있는 것으로 나타났습니다. Gulf Chemical and Metallurgical Corporation이 운영하는 금속 회수 시설에서는 사용 후 촉매의 99%를 정기적으로 판매 가능한 몰리브덴 및 니켈 스트림으로 전환하고 있으며, 이는 정제 업체에게 순환형 가치가 주는 이점을 여실히 보여줍니다. 처리량이 막대한 아시아태평양의 허브에서는 비용 절감 효과가 배가되므로, 시설 관리자들은 수년에 걸친 재생 계약을 체결하고 있습니다.
금속 오염 촉매의 회수율 저하
중질 원유에 포함된 바나듐, 니켈, 철은 활성 부위에 비가역적으로 결합하여 재생 수율을 저하시킵니다. 실험실 연구에 따르면, 바나듐 함량이 5 wt.%를 초과하면 기공 막힘이나 상 변화로 인해 수소 탈황 활성이 절반 이하로 떨어지는 것으로 나타났습니다. 개량형 탈금속 처리에서는 니켈의 최대 89.2%를 제거할 수 있지만, 대부분의 경우 골격의 안정성이 저하되어 재사용 주기가 제한됩니다. 따라서 잔여물을 원료로 사용하는 운영자는 부분적인 회수 비용과 신규 촉매 구입 비용을 비교 검토한 후, 경우에 따라 폐기를 선택하기도 합니다.
부문 분석
2025년, 오프사이트 시설은 신규 활성도의 80-90%를 회복할 수 있는 견고한 열처리 및 화학 처리 라인의 강점을 활용하여 촉매 재생 시장의 72.60% 점유율을 차지했습니다. 주요 서비스 제공업체는 금속 추출에 앞서 다단식 가마에서 탄화수소, 탄소, 황을 제거하고, 정제 설비에 원활하게 통합될 수 있는 도로 운송용 드럼에 재생된 촉매를 채워 현장에 반송하고 있습니다.
공정 설비 내부에서 직접 이루어지는 인시추(in-situ) 재생은 오존 산화 기술의 성숙에 따라 연평균 성장률(CAGR) 5.72%의 성장세를 보이고 있습니다. 연속 촉매 개질 설비 운영자들은 저온 산화를 통해 반응기에 가해지는 금속적 스트레스가 완화되어 용기의 수명을 연장하는 동시에 가동 중단 시간을 대폭 줄일 수 있다는 점을 높이 평가했습니다. 조기 도입 기업들은 재료를 외부로 보내는 경우와 비교해 10일간의 턴어라운드 시간 단축 효과를 보고하고 있으며, 이는 촉매 재생 시장의 톤당 비용을 15% 가까이 절감하고 있습니다.
지역별 분석
아시아태평양은 높은 정제 능력, 석유 화학 산업과의 긴밀한 연계, 그리고 진보적인 재활용 규제 덕분에 2025년에는 세계 수요의 42.10%를 차지했습니다. 2031년까지 연평균 성장률(CAGR) 5.45%를 나타낼 것으로 예측되는 지역적 성장에 힘입어, 촉매 재생 시장은 아시아태평양(APAC)을 중심으로 계속해서 견조한 추세를 보일 전망입니다. 일본의 재활용 업체들은 오염된 촉매, 폐배터리, 전자 스크랩을 고순도의 팔라듐 및 바나듐으로 변환하는 통합 시설을 운영하며, 국내에서 안정적인 원료 공급을 확보하고 있습니다. 인도에서는 그린필드형 통합 정유시설가 국경을 넘는 폐기물 수송을 피하기 위해 부지 내 재생 라인에 설비 투자를 할당하고 있습니다.
북미는 규제 확실성과 디지털 분야에서의 리더십의 혜택을 누리고 있습니다. 미국 멕시코만 연안의 정유시설에서는 가동 데이터를 클라우드 기반 알고리즘으로 전송하여 최적의 연소 시간을 제안받고 있습니다. 한편, 캐나다의 수소화 분해 플랜트에서는 금속 환매 가격을 보장하는 폐쇄형 계약에 따라 재활용된 코발트-몰리브덴(Co-Mo) 시스템이 공급되고 있습니다. 탄소세 크레딧이 제2의 수익원이 되어, 대륙 중부의 독립 정유업체들이 규제 준수 정산 마감 직전에 재생 일정을 수립하도록 촉진하고 있습니다.
유럽에서는 엄격한 환경 규제와 공정 기술 수출 간의 균형이 이루어지고 있습니다. 프랑스와 독일의 라이선스 제공 기업들은 공급과 재생이 결합된 패키지를 제공하고 있으며, 중동 고객들은 유럽 허브를 경유한 ‘크래들 투 크래들(Cradle-to-Cradle)’형 서비스를 이용할 수 있습니다. 그린 수소 및 e-연료에 대한 EU의 자금 지원으로 인해 지역 내 수요는 더욱 증가하고 있습니다. 이는 특수 반응 장치가 선택성을 유지하기 위해 정밀한 재생 주기가 필요한 맞춤형 촉매 등급으로 전환되고 있기 때문입니다.
기타 혜택 :
- 엑셀 형식 시장 예측(ME) 시트
- 3개월간의 애널리스트 지원
자주 묻는 질문
목차
제1장 서론
제2장 조사 방법
제3장 주요 요약
제4장 시장 구도
제5장 시장 규모 및 성장 예측
제6장 경쟁 구도
제7장 시장 기회 및 향후 전망
KTH 26.08.26According to Mordor Intelligence, the catalyst regeneration market size was valued at USD 4.59 billion in 2025 and estimated to grow from USD 4.82 billion in 2026 to reach USD 6.15 billion by 2031, at a CAGR of 4.98% during the forecast period (2026-2031).
This report is Segmented by Method (Ex-Situ and In-Situ), Application (Refineries and Petrochemical Complexes, Environmental, Energy and Power, and Other Applications), and Geography (Asia-Pacific, North America, Europe, South America, and Middle-East and Africa). The Market Forecasts are Provided in Terms of Value (USD).
Global Catalyst Regeneration Market Trends and Insights
Strict Environmental Regulations on Refinery and Petrochemical Emissions
National and regional regulators are tightening allowable emission limits, changing the economics of catalyst reuse. The U.S. Environmental Protection Agency's updated hazardous-air-pollutant standards will cut toxic releases by 2,200 short tons a year and deliver monetized health benefits exceeding USD 100 million annually. California's Low Carbon Fuel Standard requires a 30% reduction in fuel-cycle carbon intensity by 2030 and 90% by 2045, elevating demand for regenerated catalysts to comply with lifecycle accounting rules. The EU's Industrial Emissions Directive embeds catalyst regeneration in Best Available Techniques for waste treatment, reinforcing a compliance-driven preference for regeneration over landfill. Across Asia, similar limits are being drafted, ensuring the driver's influence spreads rapidly.
Rising Cost Pressure of Fresh Catalysts
Volatile prices for palladium, platinum, and rhodium have turned fresh catalyst procurement into a high-risk budget item. Academic assessments show that regenerating lightly fouled hydroprocessing catalysts recovers more than 80% of baseline activity at less than half the cost of a new supply. Metal-recovery facilities operated by Gulf Chemical and Metallurgical Corporation routinely convert 99% of spent catalyst into sellable molybdenum and nickel streams, illustrating the circular-value upside for refiners. In volume-heavy APAC hubs, the savings multiply, prompting facility managers to lock in multi-year regeneration contracts.
Lower Recovery on Metal-Poisoned Catalysts
Vanadium, nickel, and iron from heavy crudes bind irreversibly to active sites, curtailing regeneration yields. Laboratory work shows vanadium loads above 5 wt.% slash hydrodesulfurization activity by more than half because of pore blockage and phase changes. Although modified demetallization treatments strip up to 89.2% of nickel, they often damage framework stability, limiting reuse cycles. Operators running resid feeds therefore weigh the cost of partial recovery against fresh catalyst outlay, sometimes opting for disposal.
Other drivers and restraints analyzed in the detailed report include:
- Carbon-Intensity Mandates Favouring Regenerated Catalysts
- On-Site Ozone-Oxidation Breakthroughs Cut Downtime
- Lack of Global Lab Test-Method Standards
For complete list of drivers and restraints, kindly check the Table Of Contents.
Segment Analysis
Ex-situ facilities captured 72.60% of the catalyst regeneration market share in 2025 on the strength of robust thermal and chemical treatment trains capable of restoring 80-90% of fresh activity. Leading service providers remove hydrocarbons, carbon, and sulfur in staged kilns before metal extraction, delivering regenerated volumes back to the site in road-approved drums that slot seamlessly into refining units.
In-situ regeneration, applied directly inside process equipment, is gaining 5.72% CAGR momentum as ozone-oxidation technology matures. Continuous catalytic reformer operators appreciate that low-temperature oxidation curbs metallurgical stress on reactors, extending vessel life while slashing downtime. Early adopters report 10-day turnaround savings compared with sending material off-site and cutting the catalyst regeneration market cost per tonne by nearly 15%.
Complete Report Scope:
- By Method
- Ex-Situ
- In-Situ
- By Application
- Refineries and Petrochemical Complexes
- Environmental
- Energy and Power
- Other Application (Plastics Pyrolysis, Speciality)
- By Geography
- Asia-Pacific
- China
- Japan
- India
- South Korea
- ASEAN Countries
- Rest of Asia-Pacific
- North America
- United States
- Canada
- Mexico
- Europe
- Germany
- United Kingdom
- France
- Italy
- Spain
- Russia
- NORDIC Countries
- Rest of Europe
- South America
- Brazil
- Argentina
- Rest of South America
- Middle-East and Africa
- Saudi Arabia
- South Africa
- Rest of Middle-East and Africa
- Asia-Pacific
Geography Analysis
Asia-Pacific carried 42.10% of global demand in 2025 thanks to high refining capacity, deep petrochemical integration, and progressive recycling regulations. Regional growth of 5.45% CAGR through 2031 keeps the catalyst regeneration market firmly centered on APAC. Japanese recyclers run integrated facilities that convert fouled catalyst, spent batteries, and electronic scrap into high-purity palladium and vanadium, ensuring secure domestic raw-material flows. In India, greenfield integrated refineries earmark capex for on-site regeneration trains to avoid cross-border waste shipments.
North America benefits from regulatory certainty and digital leadership. Refineries on the U.S. Gulf Coast stream operating-data feeds to cloud-based algorithms that recommend optimal burn times, while Canadian hydrocrackers receive recycled Co-Mo systems delivered under closed-loop contracts that guarantee metals buy-back pricing. Carbon-tax credits add a second revenue line, nudging mid-continental independent refiners to schedule regeneration just before compliance reconciliation dates.
Europe balances stringent environmental oversight with process-technology exports. French and German licensors bundle supply-and-regeneration packages, allowing clients in the Middle East to receive cradle-to-cradle service routed through European hubs. EU funding for green hydrogen and e-fuels further boosts regional demand as specialty reactors switch to tailored catalyst grades that require precise regeneration cycles to maintain selectivity.
- Advanced Catalyst Systems
- Albemarle Corporation
- AMETEK Inc.
- Axens
- BASF
- CORMETECH
- EBINGER Katalysatorservice GmbH & Co. KG
- Eurecat
- EvoNik Industries AG
- Honeywell International Inc.
- Johnson Matthey
- NIPPON KETJEN Co. Ltd.
- Topsoe A/S
- W.R. Grace and Co.
- Yokogawa Cororation. of America
Additional Benefits:
- The market estimate (ME) sheet in Excel format
- 3 months of analyst support
TABLE OF CONTENTS
1 Introduction
- 1.1 Study Assumptions and Market Definition
- 1.2 Scope of the Study
2 Research Methodology
3 Executive Summary
4 Market Landscape
- 4.1 Market Overview
- 4.2 Market Drivers
- 4.2.1 Strict Environmental Regulations on Refinery And Petrochemical Emissions
- 4.2.2 Rising Cost-Pressure of Fresh Catalysts
- 4.2.3 Carbon-Intensity Mandates Favouring Regenerated Catalysts
- 4.2.4 On-Site Ozone-Oxidation Breakthroughs Cut Downtime
- 4.2.5 Predictive Analytics Enabling Condition-Based Regeneration
- 4.3 Market Restraints
- 4.3.1 Lower Recovery on Metal-Poisoned Catalysts
- 4.3.2 Lack of Global Lab Test-Method Standards
- 4.3.3 Rise of Single-Use Nano-Catalysts in Select Processes
- 4.4 Value Chain Analysis
- 4.5 Porter's Five Forces
- 4.5.1 Bargaining Power of Suppliers
- 4.5.2 Bargaining Power of Buyers
- 4.5.3 Threat of New Entrants
- 4.5.4 Threat of Substitutes
- 4.5.5 Degree of Competition
5 Market Size and Growth Forecasts (Value)
- 5.1 By Method
- 5.1.1 Ex-Situ
- 5.1.2 In-Situ
- 5.2 By Application
- 5.2.1 Refineries and Petrochemical Complexes
- 5.2.2 Environmental
- 5.2.3 Energy and Power
- 5.2.4 Other Application (Plastics Pyrolysis, Speciality)
- 5.3 By Geography
- 5.3.1 Asia-Pacific
- 5.3.1.1 China
- 5.3.1.2 Japan
- 5.3.1.3 India
- 5.3.1.4 South Korea
- 5.3.1.5 ASEAN Countries
- 5.3.1.6 Rest of Asia-Pacific
- 5.3.2 North America
- 5.3.2.1 United States
- 5.3.2.2 Canada
- 5.3.2.3 Mexico
- 5.3.3 Europe
- 5.3.3.1 Germany
- 5.3.3.2 United Kingdom
- 5.3.3.3 France
- 5.3.3.4 Italy
- 5.3.3.5 Spain
- 5.3.3.6 Russia
- 5.3.3.7 NORDIC Countries
- 5.3.3.8 Rest of Europe
- 5.3.4 South America
- 5.3.4.1 Brazil
- 5.3.4.2 Argentina
- 5.3.4.3 Rest of South America
- 5.3.5 Middle-East and Africa
- 5.3.5.1 Saudi Arabia
- 5.3.5.2 South Africa
- 5.3.5.3 Rest of Middle-East and Africa
- 5.3.1 Asia-Pacific
6 Competitive Landscape
- 6.1 Market Concentration
- 6.2 Strategic Moves
- 6.3 Market Share(%)/Ranking Analysis
- 6.4 Company Profiles {(includes Global level Overview, Market level overview, Core Segments, Financials as available, Strategic Information, Market Rank/Share for key companies, Products and Services, and Recent Developments)}
- 6.4.1 Advanced Catalyst Systems
- 6.4.2 Albemarle Corporation
- 6.4.3 AMETEK Inc.
- 6.4.4 Axens
- 6.4.5 BASF
- 6.4.6 CORMETECH
- 6.4.7 EBINGER Katalysatorservice GmbH & Co. KG
- 6.4.8 Eurecat
- 6.4.9 EvoNik Industries AG
- 6.4.10 Honeywell International Inc.
- 6.4.11 Johnson Matthey
- 6.4.12 NIPPON KETJEN Co. Ltd.
- 6.4.13 Topsoe A/S
- 6.4.14 W.R. Grace and Co.
- 6.4.15 Yokogawa Cororation. of America
7 Market Opportunities and Future Outlook
- 7.1 White-space and Unmet-Need Assessment