

|
시장보고서
상품코드
2113836
데이터 수집(DAQ) : 시장 점유율 분석, 업계 동향 및 통계, 성장 예측(2026-2031년)Data Acquisition (DAQ) - Market Share Analysis, Industry Trends & Statistics, Growth Forecasts (2026 - 2031) |
||||||
 Mordor Intelligence
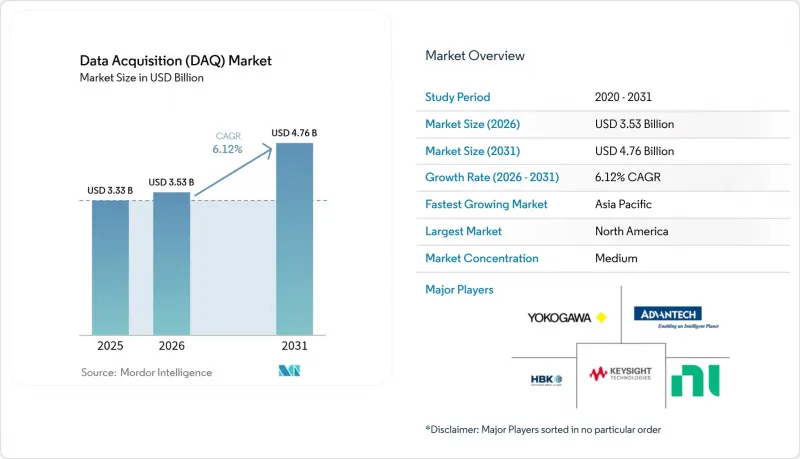
Mordor Intelligence에 의하면, 세계의 데이터 수집(DAQ) 시장 규모는 2025년 33억 3,000만 달러로 평가되었습니다. 2026년에는 35억 3,000만 달러로 확대되어 2026-2031년에 걸쳐 CAGR 6.12%로 성장을 지속하여, 2031년에는 47억 6,000만 달러에 이를 것으로 예측됩니다.
본 보고서는 채널 수별(32 미만, 32-128, 128 초과), 제품 유형별(하드웨어, 기타), 샘플링 속도별(100kS/s 이하, 100kS/s 초과), 인터페이스별(이더넷/LAN, 기타), 용도별(설계 검증·기능 검사, 기타), 최종 사용자 산업별(자동차·E-모빌리티, 기타), 지역별(북미, 기타)로 분류되어 있습니다. 시장 예측은 금액(달러) 기준으로 제시되어 있습니다.
세계의 데이터 수집(DAQ) 시장 동향 및 인사이트
타임 센시티브 네트워킹(TSN)이 결정론적 이더넷을 실현
TSN 도입으로 동기화 오류가 서브 마이크로초 수준까지 감소하고, 고가의 전용 타이밍 하드웨어가 불필요해짐에 따라 미사일, 위성, 고속 기계 검사 분야의 시스템 총비용이 15-20% 절감되었습니다. 항공우주 부문의 조기 도입 기업들로부터 측정 정밀도가 40% 향상되었습니다는 보고가 있었으며, 이를 통해 엔지니어들은 기존에 별도로 운영되던 아날로그, 디지털, 타이밍 버스를 하나의 견고한 네트워크 내에 통합할 수 있게 되었습니다. TSN 스위치를 센서 노드에 직접 내장한 각 OEM 업체들은 플러그 앤 플레이를 통해 실험실 확장이 가능한, 정밀하게 동기화된 턴키 방식의 랙을 제공했습니다.
엣지 지원 DAQ가 예측 유지보수를 혁신
계측의 에지로 이동한 머신 러닝 루틴 덕분에 이상 감지 지연 시간이 수 초에서 수 밀리초로 단축되어, 기존에는 가동 중단 1시간당 최대 10만 달러의 비용이 발생하던 반도체 포토리소그래피 결함을 미연에 방지할 수 있었습니다. 한국의 팹에서는 진동, 음향, 온도 센서를 임베디드 프로세서에 연결하고, 로컬에서 FFT 및 엔벨로프 감지 루틴을 실행하여 플래그가 지정된 이벤트만 클라우드로 전송하는 시스템을 도입한 결과, 예기치 않은 가동 중단이 38% 감소한 것으로 확인되었습니다. 이 모델을 통해 대역폭 비용이 대폭 절감되었으며, On-Premise 방화벽 내에서 독자적인 공정 데이터가 보호되었습니다.
PXIe로 인한 설비 투자 예산 압박
노후된 PCI 랙을 PXIe 섀시로 교체할 때, 소프트웨어 재작성, 지그 개조, 직원 재교육 등의 비용을 합산하면 시설당 25만 달러를 초과하는 경우가 많았습니다. 많은 대학 및 중소기업의 연구실에서는 인증 일정을 확보하기 위해 6개월 동안 병렬 시스템을 가동하여, 마이그레이션 기간 동안의 유지보수 비용을 사실상 두 배로 늘려버렸습니다. 그 결과, 일부 기관은 업그레이드를 연기하게 되어 장비의 노후화 및 새로운 운영 체제에 대한 드라이버 지원 제한이라는 위험을 감수해야 했습니다.
부문 분석
2025년, 32-128채널 등급은 데이터 수집 시장의 46.85%를 차지했습니다. 연구실에서는 확장성과 관리하기 쉬운 배선의 균형이 잘 잡혀 있으며, 다축 진동 검사, 내구성 검사, EMI 평가에 적합하기 때문에 이 ‘최적의 범위’가 선호되었습니다. 그러나 기가팩토리의 확산으로 인해 128채널을 초과하는 랙은 연평균 성장률(CAGR) 8.52%라는 급속한 성장을 이루었습니다. 배터리 셀 성형 라인에서는 수백 장의 32채널 카드를 광섬유로 연결된 아일랜드에 통합하고, 1만 노드에 걸친 전압과 온도를 모니터링함으로써 0.1%의 허용 오차 내에서 열 폭주를 확실하게 감지했습니다.
분산형 아키텍처에 대한 수요가 장비 설계를 완전히 바꾸어 놓았습니다. 각 벤더는 ‘랙당 노드 수’ 방식의 배선 체계를 채택하고, 신호 품질 저하를 억제하기 위해 ADC를 센서 근처에 내장했습니다. 소규모(32채널 이하) 박스는 교육용 실험실이나 휴대용 현장 키트 내에서 여전히 활발히 사용되고 있었지만, 제품 검증 범위가 폭과 깊이를 더해감에 따라 그 시장 점유율은 전반적으로 하락했습니다. 예측 기간 동안, 자동 감지 펌웨어와 핫스왑 지원 백플레인을 번들로 제공하는 공급업체는 데이터 수집 시장에서 채널 밀도의 급증에 최대한 활용할 수 있는 위치에 있습니다.
2025년, 데이터 수집 시장에서 하드웨어가 69.80%를 차지했지만, 사용자가 머신러닝 알고리즘을 FPGA 리소스에 직접 통합하는 분석 스택 라이선스를 취득함에 따라 소프트웨어 매출은 9.22%라는 견실한 성장세를 보였습니다. 드래그 앤 드롭 방식의 DSP 라이브러리를 통합함으로써 엔지니어는 카드 상에서 데이터 필터링, 리샘플링, 동향 분석을 수행할 수 있게 되었으며, 호스트 CPU 사이클 수를 70% 절감할 수 있게 되었습니다.
서비스 부문도 확대되었습니다. 항공우주 산업의 주요 기업들은 센서 선정, 랙 레이아웃, API 맞춤 설정을 포함한 시스템 통합 프로젝트를 벤더의 전문 서비스 부서에 아웃소싱했습니다. 이러한 변화로 인해 기존 하드웨어 전문 기업들은 지속적인 배포 업데이트를 제공하는 구독형 소프트웨어 모듈로 사업을 전환해야만 했습니다. 시간이 지남에 따라 가치는 보드 수준의 기능에서 구성 가능한 IP 코어로 이동했으며, 데이터 수집 시장에서 차별화의 핵심으로서 소프트웨어의 입지가 확고해졌습니다.
지역별 분석
북미는 항공우주 대기업, 방위 산업 주요 계약업체, 자동차 대기업 3곳이 TSN 및 고밀도 PXI 시스템의 조기 도입을 주도함에 따라 2025년 매출의 32.90%를 차지했습니다. NASA의 우주 발사 시스템(SLS) 텔레메트리 스테이션은 20만 개 이상의 이더넷 채널을 실시간으로 처리하며 해당 지역의 연구 개발 역량을 입증했습니다. 대규모 연방 예산 덕분에 신속한 업데이트 주기가 가능해졌으며, 이로 인해 해당 지역의 리더십이 확고해졌습니다.
아시아태평양은 2031년까지 9.36%라는 가장 높은 연평균 성장률(CAGR)을 기록했습니다. 중국의 배터리 기가팩토리 건설과 한국의 반도체 생산 확대에 따라 각 거점에서 수천 장의 채널 카드가 소비되었습니다. 한편, 인도의 로켓 발사 의지가 높아짐에 따라 14grms를 초과하는 진동 스펙트럼을 견딜 수 있는 견고한 DAQ 크레이트가 필요하게 되었습니다. 각국 정부는 스마트 제조에 대한 인센티브를 투입하여 엣지 대응 무선 노드에 대한 수요를 자극하는 동시에, 현지 벤더들을 세계 데이터 수집 시장으로 끌어올렸습니다.
유럽에서는 독일의 자동차 연구 개발과 유럽 우주국(ESA)의 우주 프로젝트를 중심으로 견고한 시장 기반을 유지했습니다. 슈투트가르트 연구소 내의 디지털 트윈 검사대에서는 동기화된 DAQ 스트림과 가상 엔진이 융합되어 프로토타입 개발 주기가 단축되었습니다. ‘엑소마르스(ExoMars)’ 로버에는 -80°C에서 +70°C의 온도 변동을 견딜 수 있는 전자 기기가 요구되어, 유럽 공급업체들은 방사선 내성 설계로 전환해야만 했습니다. 북해 지역의 재생에너지 의무화로 인해, 내식성이 뛰어난 장거리 DAQ 케이블 및 무선 브리지의 수주가 더욱 가속화되었습니다.
기타 혜택
- 엑셀 형식 시장 예측(ME) 시트
- 3개월간의 애널리스트 지원
자주 묻는 질문
목차
제1장 서론
제2장 조사 방법
제3장 주요 요약
제4장 시장 구도
제5장 시장 규모 및 성장 예측
제6장 경쟁 구도
제7장 시장 기회 및 향후 전망
KTH 26.08.26According to Mordor Intelligence, the global data acquisition (DAQ) market size is expected to grow from USD 3.33 billion in 2025 to USD 3.53 billion in 2026 and is forecast to reach USD 4.76 billion by 2031 at 6.12% CAGR over 2026-2031.
This report is Segmented by Channel Count ( 128), by Offering (Hardware, and More), by Sampling Speed ( <= 100 KS/S and > 100 KS/S), by Interface (Ethernet/LAN, and More), by Application (Design Validation and Functional Test, and More), by End-User Industry ( Automotive and E-Mobility, and More), and by Geography (Nort America, and More). The Market Forecasts are Provided in Terms of Value (USD).
Global Data Acquisition (DAQ) Market Trends and Insights
Time-Sensitive Networking unlocks deterministic Ethernet
TSN deployments reduced synchronization errors to sub-microsecond levels and eliminated costly dedicated timing hardware, cutting total system expense by 15-20% for missile, satellite, and high-speed machinery tests. Early adopters in aerospace reported measurement-accuracy gains of 40%, allowing engineers to consolidate previously separate analog, digital, and timing buses inside one hardened network. OEMs that embedded TSN switches directly into sensor nodes delivered turnkey, tightly synchronized racks ready for plug-and-play lab expansion.
Edge-enabled DAQ transformed predictive maintenance
Machine-learning routines pushed to the measurement edge shortened anomaly-detection latency from seconds to milliseconds, stopping semiconductor photolithography faults that historically cost up to USD 100,000 per downtime hour. South Korean fabs documented 38% drops in unexpected stoppages after installing vibration, acoustic, and thermal sensors wired into embedded processors that executed local FFT and envelope-detection routines, forwarding only flagged events to the cloud. The model slashed bandwidth costs and safeguarded proprietary process data behind on-premise firewalls.
Upgrading to PXIe stretched capital budgets
Replacing aging PCI racks with PXIe chassis often topped USD 250,000 per facility once software rewrites, fixture retrofits, and staff retraining were tallied. Many universities and SME labs ran parallel systems for six months to safeguard certification schedules, effectively doubling maintenance overhead during switchover windows. Consequently, some institutions deferred upgrades, risking obsolescence and limited driver support for newer operating systems.
Other drivers and restraints analyzed in the detailed report include:
- Digital-twin integration reshaped automotive validation
- Gigafactory channel explosion drove high-density architectures
- Vendor-locked protocols hampered multi-site integration
For complete list of drivers and restraints, kindly check the Table Of Contents.
Segment Analysis
The 32-128 channel class captured 46.85% of the Data Acquisition market share in 2025. Laboratories favored this sweet spot because it balanced scalability with manageable cabling, suiting multi-axis vibration, durability, and EMI evaluations. Gigafactory rollouts, however, catapulted racks exceeding 128 channels to an 8.52% CAGR. Battery cell formation lines stitched hundreds of 32-channel cards into fiber-linked islands to monitor voltage and temperature across 10,000 nodes, ensuring thermal run-away detection at 0.1% tolerance.
Demand for distributed architectures re-shaped equipment design. Vendors adopted "node-per-rack" wiring schemes, embedding ADCs close to sensors to cut signal-integrity losses. Smaller (<32 channel) boxes still thrived inside educational labs and portable field kits, yet their overall slice fell as product validation expanded breadth and depth. Over the forecast, suppliers bundling auto-discovery firmware and hot-swap backplanes are best positioned to ride the surge in channel density within the Data Acquisition market.
Hardware accounted for 69.80% of the Data Acquisition market in 2025, yet software revenues climbed at a healthy 9.22% pace as users licensed analytics stacks that injected machine-learning algorithms straight into FPGA resources. Incorporating drag-and-drop DSP libraries lets engineers filter, resample, and trend data on the card, trimming host-CPU cycles by 70%.
Service lines also swelled. Aerospace primes outsourced system-integration projects covering sensor selection, rack layout, and API customization to vendors' professional-services arms. The shift nudged legacy hardware-only firms to pivot toward subscription-oriented software modules delivering continuous deployment updates. Over time, value migrated from board-level features to configurable IP cores, cementing software as the pivot point for differentiation within the Data Acquisition market.
Complete Report Scope:
- By Channel Count
- < 32
- 32 - 128
- > 128
- By Offering
- Hardware
- Software
- Services
- By Sampling Speed
- <= 100 kS/s (Low-Speed)
- > 100 kS/s (High-Speed)
- By Interface
- USB
- Ethernet / LAN
- PCI / PXI / PXIe
- Wireless
- By Application
- Design Validation and Functional Test
- Manufacturing and End-of-Line Test
- Asset Condition Monitoring
- Field and Lab RandD
- Environmental and Structural Monitoring
- By End-User Industry
- Automotive and E-Mobility
- Aerospace and Defense
- Energy and Power (Including Renewables)
- Water and Waste Treatment
- Semiconductor and Electronics
- Education and Research Institutes
- Chemicals, Paper and Pulp
- Other End-User Industries
- By Geography
- North America
- United States
- Canada
- Mexico
- South America
- Brazil
- Argentina
- Rest of South America
- Europe
- Germany
- United Kingdom
- France
- Rest of Europe
- Asia-Pacific
- China
- Japan
- South Korea
- India
- Rest of Asia-Pacific
- Middle East and Africa
- Middle East
- Saudi Arabia
- United Arab Emirates
- Turkey
- Rest of Middle East
- Africa
- South Africa
- Nigeria
- Rest of Africa
- Middle East
- North America
Geography Analysis
North America commanded 32.90% of 2025 revenue because its aerospace giants, defense primes, and big-three automakers drove early adoption of TSN and high-density PXI systems. NASA's Space Launch System telemetry station processed over 200,000 Ethernet channels in real time, showcasing local research and development prowess. Large federal budgets enabled rapid refresh cycles, cementing regional leadership.
Asia-Pacific clocked the fastest 9.36% CAGR to 2031. China's battery-gigafactory build-out and South Korea's semiconductor expansions consumed thousands of channel cards per site, while India's growing rocket-launch ambitions required rugged DAQ crates that withstand vibration spectra above 14 g rms. Governments funneled incentives into smart manufacturing, spurring demand for edge-enabled wireless nodes and pushing local vendors into the global Data Acquisition market.
Europe maintained a robust footprint anchored by German automotive research and development and ESA space projects. Digital-twin benches inside Stuttgart labs fused synchronized DAQ streams with virtual engines, trimming prototype cycles. The ExoMars rover called for electronics that survived -80 °C to +70 °C temperature swings, pushing European suppliers toward radiation-hardened designs. Renewable-energy mandates in the North Sea further accelerated orders for corrosion-proof, long-haul DAQ cabling and wireless bridges.
- National Instruments (NI) Corporation
- Keysight Technologies Inc.
- Yokogawa Electric Corporation
- HBK (Hottinger Bruel & Kjaer) A/S
- Advantech Co. Ltd.
- Dewesoft d.o.o
- Dewetron Inc.
- HIOKI E.E. Corp.
- Imc Test & Measurement GmbH
- ADLINK Technology Inc.
- Spectrum Instrumentation GmbH
- Measurement Computing (MCC) Corporation
- Elsys AG
- GaGe (DynamicSignals LLC)
- Microstar Labs Inc.
- Bustec Solutions Ltd.
- Data-Translation GmbH
- DATAQ Instruments Inc.
- Graphtec Corporation
- OROS S.A.
- Curtiss-Wright Corporation
- Siemens AG
- Pico Technology Ltd.
- Ametek Inc.
- Rohde & Schwarz GmbH & Co. KG
- Intrepid Control Systems Inc.
Additional Benefits:
- The market estimate (ME) sheet in Excel format
- 3 months of analyst support
TABLE OF CONTENTS
1 INTRODUCTION
- 1.1 Study Assumptions and Market Definition
- 1.2 Scope of the Study
2 RESEARCH METHODOLOGY
3 EXECUTIVE SUMMARY
4 MARKET LANDSCAPE
- 4.1 Market Overview
- 4.2 Market Drivers
- 4.2.1 Growing Adoption of Time-Sensitive Networking (TSN) in DAQ Architectures
- 4.2.2 Edge-Deployed DAQ Accelerating Predictive Maintenance in Asia-Pacific Manufacturing
- 4.2.3 Rapid Integration of DAQ with Digital Twins in Automotive Test Benches
- 4.2.4 Demand for High-Channel-Count DAQ in Battery Gigafactories
- 4.2.5 Adoption of Rugged Modular DAQ for Space Launch Facilities
- 4.2.6 Proliferation of Low-Cost USB DAQ in Vocational STEM Programs
- 4.3 Market Restraints
- 4.3.1 Capital-Intensive Migration from Legacy PCI to PXIe Platforms
- 4.3.2 Limited Inter-operability Standards Among Vendor-Proprietary DAQ Protocols
- 4.3.3 Data-Governance Compliance Costs in Multi-Country Aerospace Testing
- 4.3.4 Shortage of DAQ-Savvy Test Engineers in High-Growth EV Clusters
- 4.4 Industry Value Chain Analysis
- 4.5 Regulatory and Technological Outlook
- 4.6 Porter's Five Forces
- 4.6.1 Threat of New Entrants
- 4.6.2 Bargaining Power of Buyers
- 4.6.3 Bargaining Power of Suppliers
- 4.6.4 Threat of Substitutes
- 4.6.5 Intensity of Competitive Rivalry
- 4.7 Distribution Channel Analysis
- 4.7.1 Distributors
- 4.7.2 System Integrators
- 4.7.3 Direct Sales
- 4.8 Technology Snapshot
- 4.8.1 Evolution of DAQ Connectivity Technologies
- 4.8.2 Impact of TSN and Edge Computing
- 4.8.3 Shift Toward Integrated Software-Driven Platforms
- 4.9 Impact of Macroeconomic Factors on the Market
5 MARKET SIZE AND GROWTH FORECASTS (VALUE)
- 5.1 By Channel Count
- 5.1.1 < 32
- 5.1.2 32 - 128
- 5.1.3 > 128
- 5.2 By Offering
- 5.2.1 Hardware
- 5.2.2 Software
- 5.2.3 Services
- 5.3 By Sampling Speed
- 5.3.1 <= 100 kS/s (Low-Speed)
- 5.3.2 > 100 kS/s (High-Speed)
- 5.4 By Interface
- 5.4.1 USB
- 5.4.2 Ethernet / LAN
- 5.4.3 PCI / PXI / PXIe
- 5.4.4 Wireless
- 5.5 By Application
- 5.5.1 Design Validation and Functional Test
- 5.5.2 Manufacturing and End-of-Line Test
- 5.5.3 Asset Condition Monitoring
- 5.5.4 Field and Lab RandD
- 5.5.5 Environmental and Structural Monitoring
- 5.6 By End-User Industry
- 5.6.1 Automotive and E-Mobility
- 5.6.2 Aerospace and Defense
- 5.6.3 Energy and Power (Including Renewables)
- 5.6.4 Water and Waste Treatment
- 5.6.5 Semiconductor and Electronics
- 5.6.6 Education and Research Institutes
- 5.6.7 Chemicals, Paper and Pulp
- 5.6.8 Other End-User Industries
- 5.7 By Geography
- 5.7.1 North America
- 5.7.1.1 United States
- 5.7.1.2 Canada
- 5.7.1.3 Mexico
- 5.7.2 South America
- 5.7.2.1 Brazil
- 5.7.2.2 Argentina
- 5.7.2.3 Rest of South America
- 5.7.3 Europe
- 5.7.3.1 Germany
- 5.7.3.2 United Kingdom
- 5.7.3.3 France
- 5.7.3.4 Rest of Europe
- 5.7.4 Asia-Pacific
- 5.7.4.1 China
- 5.7.4.2 Japan
- 5.7.4.3 South Korea
- 5.7.4.4 India
- 5.7.4.5 Rest of Asia-Pacific
- 5.7.5 Middle East and Africa
- 5.7.5.1 Middle East
- 5.7.5.1.1 Saudi Arabia
- 5.7.5.1.2 United Arab Emirates
- 5.7.5.1.3 Turkey
- 5.7.5.1.4 Rest of Middle East
- 5.7.5.2 Africa
- 5.7.5.2.1 South Africa
- 5.7.5.2.2 Nigeria
- 5.7.5.2.3 Rest of Africa
- 5.7.5.1 Middle East
- 5.7.1 North America
6 COMPETITIVE LANDSCAPE
- 6.1 Market Concentration
- 6.2 Strategic Moves
- 6.3 Market Share Analysis
- 6.4 Company Profiles (includes Global-level Overview, Market-level Overview, Core Segments, Financials, Strategic Information, Market Rank/Share, Products and Services, Recent Developments)
- 6.4.1 National Instruments (NI) Corporation
- 6.4.2 Keysight Technologies Inc.
- 6.4.3 Yokogawa Electric Corporation
- 6.4.4 HBK (Hottinger Bruel & Kjaer) A/S
- 6.4.5 Advantech Co. Ltd.
- 6.4.6 Dewesoft d.o.o
- 6.4.7 Dewetron Inc.
- 6.4.8 HIOKI E.E. Corp.
- 6.4.9 Imc Test & Measurement GmbH
- 6.4.10 ADLINK Technology Inc.
- 6.4.11 Spectrum Instrumentation GmbH
- 6.4.12 Measurement Computing (MCC) Corporation
- 6.4.13 Elsys AG
- 6.4.14 GaGe (DynamicSignals LLC)
- 6.4.15 Microstar Labs Inc.
- 6.4.16 Bustec Solutions Ltd.
- 6.4.17 Data-Translation GmbH
- 6.4.18 DATAQ Instruments Inc.
- 6.4.19 Graphtec Corporation
- 6.4.20 OROS S.A.
- 6.4.21 Curtiss-Wright Corporation
- 6.4.22 Siemens AG
- 6.4.23 Pico Technology Ltd.
- 6.4.24 Ametek Inc.
- 6.4.25 Rohde & Schwarz GmbH & Co. KG
- 6.4.26 Intrepid Control Systems Inc.
7 MARKET OPPORTUNITIES AND FUTURE OUTLOOK
- 7.1 White-space and Unmet-Need Assessment


