|
시장보고서
상품코드
2113960
상업용 로봇 : 시장 점유율 분석, 업계 동향 및 통계, 성장 예측(2026-2031년)Commercial Robotics - Market Share Analysis, Industry Trends & Statistics, Growth Forecasts (2026 - 2031) |
||||||
 Mordor Intelligence
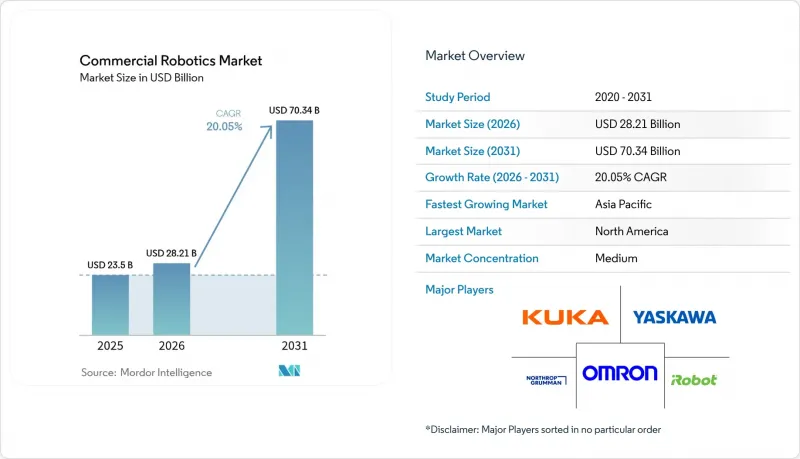
Mordor Intelligence에 의하면, 상업용 로봇 시장 규모는 2025년 235억 달러로 평가되었습니다. 2026년에는 282억 1,000만 달러로 확대되어 2026년부터 2031년에 걸쳐 CAGR 20.05%로 성장을 지속하여, 2031년에는 703억 4,000만 달러에 이를 것으로 예측됩니다.
본 보고서는 구성 요소(하드웨어, 소프트웨어, 서비스), 로봇 유형(드론/UAV, 필드 로봇, 의료용 로봇 등), 용도(의료 및 헬스케어,방위 및 보안, 농림업, 해양·오프쇼어 등), 모빌리티(고정형 로봇, 이동형 지상 로봇 등), 지역별로 분류되어 있습니다. 시장 예측은 금액(달러) 기준으로 제시되어 있습니다.
세계의 상업용 로봇 시장 동향 및 인사이트
AI, 엣지 컴퓨팅, 로봇공학의 기술적 융합
상업용 로봇 시장은 클라우드 지연을 상쇄하고, 즉각적인 내비게이션 판단을 가능하게 하며, 생성적 작업 계획을 지원하는 기기 내 AI 추론의 혜택을 받고 있습니다. 아마존은 75만 대 이상의 창고 로봇을 운영하고 있으며, 비전 모델과 로컬 처리를 결합하여 25%의 효율 향상을 실현하고 있습니다. 존 디어(John Deere)의 2세대 자율 주행 스택은 엣지 AI가 작물 줄 사이를 센티미터 단위로 조향할 수 있게 하여, 불규칙한 밭에서의 가동 시간을 향상시킨다는 것을 보여줍니다. 고급 동작 모델이 성숙해짐에 따라, 로봇은 규칙 기반 동작에서 자기 학습형 루틴으로 전환되며, 자본 설비를 업그레이드 가능한 디지털 자산으로 변모시키고 있습니다. 이러한 전환으로 소프트웨어의 가치가 높아지고, 상업용 로봇 시장은 ‘플랫폼 경제’로 추진됩니다. 이 플랫폼 경제에서는 알고리즘 개선을 통해 기계적 개조 없이도 이미 도입된 장비의 성능이 향상됩니다.
심화되는 노동력 부족과 임금 인플레이션
인구 통계학적 변화로 인해 노동력 풀이 축소되는 가운데, 제조업체들은 생산 라인 인력 확보에 어려움을 겪고 있습니다. 2030년까지 구인 미충족으로 인해 미국 공장에서 200만 명의 노동자가 사라질 가능성이 있으며, 그 결과 2021년 이후 자동화를 위한 자본 재분배 규모가 약 550억 달러에 달할 것으로 예측됩니다. 로보틱스는 반복적이고 위험한 작업을 경감시켜 생산량을 유지하면서 직원들의 이직률을 낮춥니다. 산업용 로봇 1대당 하드웨어 가격이 1만 856달러까지 하락함에 따라, 중규모 공장의 투자 회수 기간은 현재 평균 1-3년입니다. 구독형 자금 조달 모델로 인해 진입 장벽은 더욱 낮아졌습니다. 그 결과, 상업용 로봇 시장은 일자리를 빼앗는 위협이 아니라 노동력을 보완하는 도구로 자리매김하고 있으며, 인력과 생산성을 동시에 확보해야 하는 기업의 과제와 부합합니다.
로봇 시스템의 높은 초기 비용
도입 및 교육 비용을 포함하면 총 도입 예산은 여전히 10만 달러를 상회하고 있어, 이로 인해 중소기업의 도입이 지연되고 있습니다. ‘Robot-as-a-Service(RaaS)’ 계약에서는 장비, 소프트웨어, 유지보수를 월정액 요금에 포함시켜 자본 비용 부담을 분산시킵니다. 테넌트사가 브레인 코퍼레이션과 체결한 3,200만 달러 규모의 계약은 이미 가동 중인 6,500대의 자율형 청소 유닛의 기반이 되고 있으며, 시설 관리 분야에서의 구독 모델의 유효성을 입증하고 있습니다. 모듈식 설계와 표준화된 인터페이스는 엔지니어링 공수 절감을 목적으로 하고 있지만, 특히 통합업체 네트워크가 미비한 신흥국에서는 생태계를 구성하는 도구들이 아직 발전 단계에 있습니다.
부문 분석
2025년 매출의 65.90%를 하드웨어가 차지했으며, 이는 각 로봇 플랫폼의 물리적 핵심을 이루는 액추에이터, 드라이브, 센서 페이로드의 자본 집약성을 여실히 보여줍니다. 반면, 소프트웨어는 연평균 성장률(CAGR) 21.45%로 성장을 지속하고, 있으며, 이는 기업들이 지능에 의해 정의되는 가치로 전환하고 있음을 반영합니다. 현재 ABB 포트폴리오의 80% 이상에는 실시간 경로 계획, 동적 힘 제어, 디지털 트윈 기반 시뮬레이션을 가능하게 하는 AI 기능이 통합되어 있습니다. 서비스 부문은 나머지 매출을 차지하고 있지만, 도입 기반이 성숙해짐에 따라 그 비중은 확대되고 있습니다.
소프트웨어의 성장은 전략적 전환을 보여줍니다. 하드웨어 부품이 상품화되는 가운데, 알고리즘 스택이 차별화의 열쇠를 쥐고 있습니다. 아마존의 촉각 센서가 탑재된 로봇 ‘Vulcan’은 과거 인간 피킹 작업자가 담당하던 재고 관리 단위(SKU)의 75%를 이동시키고 있는데, 이는 첨단 조작 소프트웨어 없이는 불가능한 위업입니다. 그 결과, 상업용 로봇 시장에서의 소프트웨어 시장 규모는 2020년대 후반에 기계 제조 비용을 넘어설 것으로 예측되며, 이는 공급업체 간의 힘의 균형을 바꾸고 구독 기반의 수익화를 가능하게 할 것입니다.
드론은 2025년 매출의 37.45%를 차지하며, 시야 밖 비행을 허용하는 FAA 파트 108 규정에 따라 승인된 점검, 매핑, 라스트 마일 배송 서비스에 힘입어 성장했습니다. 의료 플랫폼은 연평균 성장률(CAGR) 20.95%로 가장 빠른 성장세를 보였으며, 병원들은 최소 침습 수술에 대한 수요를 충족하기 위해 추가적인 다빈치(da Vinci) 시스템을 도입하고 있습니다. 인튜이티브 서지컬(Intuitive Surgical)은 시스템 기반이 15% 확대됨에 따라 2025년 1분기에 22억 5,000만 달러의 매출을 기록했습니다.
이러한 카테고리의 변화는 의료 분야에서 정확성을 추구하는 경향과 인구 동학에 기인한 노인 돌봄 수요 증가를 여실히 보여주고 있습니다. 한편, 현장용 로봇은 농업 및 건설 분야에서 점차 확산되고 있는 반면, 자율주행 차량은 구조화된 산업용 통로에서 주류를 이루고 있습니다. 포트폴리오의 다각화는 상업용 로봇 시장이 단일 카테고리의 지배가 아닌, 다중 모드 플랫폼의 성장에 의존해 나갈 것임을 시사합니다.
지역별 분석
북미는 2025년에도 국방 지출 및 대규모 자율 주행 차량 군단을 활용하는 하이퍼스케일 전자상거래(EC)의 도입에 힘입어 매출 점유율 36.10%로 1위를 유지했습니다. 자금 지원을 받은 연구 프로그램과 벤처 캐피탈의 집적이 상용화 주기를 가속화하여, 파일럿 프로젝트에서 공장 규모의 본격적인 도입으로의 신속한 전환을 가능하게 하고 있습니다. 실리콘밸리에서의 기술 수출은 캐나다 및 멕시코에서의 플랫폼 표준화를 더욱 뒷받침하고 있습니다.
아시아태평양은 2031년까지 연평균 성장률(CAGR) 20.95%라는 가장 급격한 성장 궤도를 보이고 있습니다. 중국이 약 1,380억 달러의 투자를 약속함에 따라 산업용 로봇 공급망이 활성화되었고, 2020년부터 2023년에 걸쳐 국내 공급업체의 점유율이 30%에서 47%로 상승했습니다. 일본과 한국의 국가 계획에서는 휴머노이드 로봇 및 산업용 로봇에 총 10억 달러 이상이 배정되어 있으며, 민관 협력을 통해 상용화가 추진되고 있습니다. 동남아시아 전역의 급속한 도시화와 임금 상승은 생산성 향상을 목표로 하는 현지 제조업체들의 도입을 더욱 촉진하고 있습니다.
유럽은 성숙한 시장임에도 불구하고 혁신이 활발한 시장으로, 확립된 자동차 산업의 자동화와 엄격한 안전 기준이 융합되어 있습니다. 이 지역의 배출량 감축 계획인 ‘Fit for 55’는 에너지 소비와 폐기물 배출량을 최적화하는 서비스 로봇을 뒷받침하고 있습니다. 중동 및 아프리카 및 남미는 여전히 시장이 미성숙한 상태이며, 시스템 통합사업자의 부족과 자금 조달 제약에 직면해 있습니다. 그럼에도 불구하고, 항만 자동화 프로젝트와 광업용 로봇이 점차 시범 도입 수주를 촉진하고 있어 장기적인 수요의 조짐이 보입니다.
기타 혜택 :
- 엑셀 형식 시장 예측(ME) 시트
- 3개월간의 애널리스트 지원
자주 묻는 질문
목차
제1장 서론
제2장 조사 방법
제3장 주요 요약
제4장 시장 구도
제5장 시장 규모 및 성장 예측
제6장 경쟁 구도
제7장 시장 기회 및 향후 전망
KTH 26.08.26According to Mordor Intelligence, the commercial robotics market size is expected to grow from USD 23.50 billion in 2025 to USD 28.21 billion in 2026 and is forecast to reach USD 70.34 billion by 2031 at 20.05% CAGR over 2026-2031.
This report is Segmented by Component (Hardware, Software, and Services), Type of Robot (Drones/UAVs, Field Robots, Medical Robots, and More), Application (Medical and Healthcare, Defense and Security, Agriculture and Forestry, Marine and Offshore, and More), Mobility (Stationary Robots, Mobile Ground Robots, and More) and Geography. The Market Forecasts are Provided in Terms of Value (USD).
Global Commercial Robotics Market Trends and Insights
Technological Convergence of AI, Edge Computing and Robotics
The commercial robotics market benefits from on-device AI inference that offsets cloud latency, enables split-second navigation choices, and supports generative task planning. Amazon operates more than 750,000 warehouse robots that deliver 25% efficiency gains by pairing vision models with local processing. John Deere's second-generation autonomy stack illustrates how edge AI permits centimeter-level steering in crop rows, enhancing uptime in unstructured fields. As advanced motion models mature, robots shift from rules-based motion to self-learning routines, turning capital equipment into upgradeable digital assets. This shift elevates software value and propels the commercial robotics market toward platform economics where algorithm improvements lift installed-base capability without mechanical retrofits.
Rising Labor Shortages and Wage Inflation
Manufacturers struggle to staff production lines as demographic shifts shrink labor pools. Vacancies could remove 2 million workers from U.S. factories by 2030, leading to an estimated USD 55 billion redirection of capital toward automation since 2021. Robotics mitigates repetitive and hazardous tasks, improving retention while sustaining throughput. As hardware prices have fallen to USD 10,856 per industrial robot, payback periods for mid-sized plants now average 1-3 years. Subscription financing models further lower entry barriers. Consequently, the commercial robotics market is positioned as a labor-augmentation tool rather than a displacement threat, aligning with corporate mandates to secure talent and productivity simultaneously.
High Up-front Cost of Robotic Systems
Total deployment budgets still top USD 100,000 once integration and training are included, delaying adoption for smaller firms. Robot-as-a-Service contracts help flatten capital curves by bundling equipment, software, and maintenance into monthly fees. Tennant's USD 32 million agreement with Brain Corp underpins 6,500 autonomous cleaning units already in service, proving subscription models in facility care. Modular designs and standardized interfaces aim to trim engineering hours, but ecosystem tooling remains nascent, especially in emerging economies where integrator networks are thin.
Other drivers and restraints analyzed in the detailed report include:
- Expansion of E-commerce Boosting Warehouse Robotics
- Increased Government and Defense Spend on Unmanned Systems
- Cyber-security Vulnerabilities in Connected Robots
For complete list of drivers and restraints, kindly check the Table Of Contents.
Segment Analysis
Hardware generated 65.90% of 2025 revenue, underscoring the capital intensity of actuators, drives, and sensor payloads that form each robotic platform's physical backbone. Yet software posted a 21.45% CAGR, reflecting enterprise migration toward intelligence-defined value. Over 80% of ABB's portfolio now bundles AI features that enable real-time path planning, dynamic force control, and digital twin-based simulation. Services contributed residual revenue but are widening as installed bases mature.
Software gains illustrate a strategic pivot. As hardware components commoditize, algorithm stacks dictate differentiation. Amazon's tactile-sensor-equipped Vulcan robot moves 75% of stock-keeping units once reserved for human pickers, a feat impossible without advanced gripping software. Consequently, the commercial robotics market size for software is projected to outpace mechanical build spend by late decade, reshaping supplier power balances and enabling subscription monetization.
Drones accounted for 37.45% of 2025 turnover, buoyed by inspection, mapping, and last-mile delivery services authorized under FAA Part 108 rules that permit beyond-visual-line-of-sight flights.Medical platforms posted the swiftest rise at 20.95% CAGR, with hospitals installing additional da Vinci systems to satisfy minimally invasive procedure demand. Intuitive Surgical recorded USD 2.25 billion Q1 2025 revenue on a 15% system-base expansion.
The category shift underscores healthcare's appetite for precision and demographic-driven eldercare requirements. Meanwhile, field robots demonstrate traction in agriculture and construction, while autonomous guided vehicles dominate structured industrial pathways. Portfolio diversity signals that the commercial robotics market will rely on multi-modal platform growth rather than single-category dominance.
Complete Report Scope:
- By Component
- Hardware
- Software
- Services
- By Type of Robot
- Drones / UAVs
- Field Robots
- Medical Robots
- Autonomous Guided Robots
- Other Types
- By Application
- Medical and Healthcare
- Defense and Security
- Agriculture and Forestry
- Marine and Offshore
- Warehousing and Logistics
- Other Applications
- By Mobility
- Stationary Robots
- Mobile Ground Robots
- Aerial Robots
- Marine / Underwater Robots
- By Geography
- North America
- United States
- Canada
- Mexico
- Europe
- Germany
- United Kingdom
- France
- Italy
- Spain
- Rest of Europe
- Asia-Pacific
- China
- Japan
- India
- South Korea
- Australia
- Rest of Asia-Pacific
- South America
- Brazil
- Argentina
- Rest of South America
- Middle East and Africa
- Middle East
- Saudi Arabia
- United Arab Emirates
- Turkey
- Rest of Middle East
- Africa
- South Africa
- Egypt
- Nigeria
- Rest of Africa
- Middle East
- North America
Geography Analysis
North America retained 36.10% revenue leadership in 2025, driven by defense outlays and hyperscale e-commerce deployments that utilize extensive autonomous fleets. Funded research programs and venture capital clusters accelerate commercialization cycles, enabling rapid transition from pilot projects to full plant-scale installations. Technology exports from Silicon Valley further support platform standardization in Canada and Mexico.
Asia-Pacific posts the steepest trajectory at 20.95% CAGR through 2031. China's pledge to inject nearly USD 138 billion backs industrial robot supply chains, raising indigenous supplier share from 30% to 47% between 2020 and 2023. National plans in Japan and South Korea collectively allocate more than USD 1 billion for humanoid and manufacturing-grade robots, channeling public-private partnerships into commercialization. Rapid urbanization and wage escalations across Southeast Asia further cultivate adoption among local manufacturers seeking productivity gains.
Europe remains a mature but innovation-active market, combining established automotive automation with stringent safety standards. The region's fit-for-55 emissions plan favors service robots that optimize energy and waste footprints. Middle East and Africa and South America remain nascent, constrained by integrator scarcity and limited financing. Nonetheless, port automation projects and mining robots are slowly catalyzing pilot orders that foreshadow longer-term demand.
- ABB Ltd.
- FANUC Corp.
- KUKA AG
- Yaskawa Electric Corp.
- Mitsubishi Electric Corp.
- Northrop Grumman Corp.
- Omron Adept Technologies Inc.
- iRobot Corp.
- Honda Motor Co. Ltd.
- Alphabet Inc. (Intrinsic X)
- Boston Dynamics Inc.
- DJI Technology Co. Ltd.
- Teradyne Inc. (Universal Robots and Mobile Industrial Robots)
- Amazon Robotics (Amazon.com Inc.)
- Intuitive Surgical Inc.
- AgEagle Aerial Systems Inc.
- SANY Heavy Industry Co. Ltd.
- Insitu Inc. (Boeing)
- Baidu Apollo Robotics
- Kraken Robotics Inc.
Additional Benefits:
- The market estimate (ME) sheet in Excel format
- 3 months of analyst support
TABLE OF CONTENTS
1 INTRODUCTION
- 1.1 Study Assumptions and Market Definition
- 1.2 Scope of the Study
2 RESEARCH METHODOLOGY
3 EXECUTIVE SUMMARY
4 MARKET LANDSCAPE
- 4.1 Market Overview
- 4.2 Market Drivers
- 4.2.1 Technological convergence of AI, edge computing and robotics
- 4.2.2 Rising labor shortages and wage inflation
- 4.2.3 Expansion of e-commerce boosting warehouse robotics
- 4.2.4 Increased government and defense spend on unmanned systems
- 4.2.5 Eldercare service-robot adoption in super-aging economies
- 4.2.6 Regulatory fast-tracking of inspection robots for critical infrastructure
- 4.3 Market Restraints
- 4.3.1 High up-front cost of robotic systems
- 4.3.2 Cyber-security vulnerabilities in connected robots
- 4.3.3 Supply-chain risk for rare-earth permanent-magnet materials
- 4.3.4 Shortage of skilled integrators and maintenance technicians
- 4.4 Value Chain Analysis
- 4.5 Regulatory Landscape
- 4.6 Technological Outlook
- 4.7 Porter's Five Forces Analysis
- 4.7.1 Bargaining Power of Suppliers
- 4.7.2 Bargaining Power of Buyers
- 4.7.3 Threat of New Entrants
- 4.7.4 Threat of Substitutes
- 4.7.5 Intensity of Competitive Rivalry
- 4.8 Assessment of the Impact of Macroeconomic Trends on the Market
5 MARKET SIZE AND GROWTH FORECASTS (VALUE)
- 5.1 By Component
- 5.1.1 Hardware
- 5.1.2 Software
- 5.1.3 Services
- 5.2 By Type of Robot
- 5.2.1 Drones / UAVs
- 5.2.2 Field Robots
- 5.2.3 Medical Robots
- 5.2.4 Autonomous Guided Robots
- 5.2.5 Other Types
- 5.3 By Application
- 5.3.1 Medical and Healthcare
- 5.3.2 Defense and Security
- 5.3.3 Agriculture and Forestry
- 5.3.4 Marine and Offshore
- 5.3.5 Warehousing and Logistics
- 5.3.6 Other Applications
- 5.4 By Mobility
- 5.4.1 Stationary Robots
- 5.4.2 Mobile Ground Robots
- 5.4.3 Aerial Robots
- 5.4.4 Marine / Underwater Robots
- 5.5 By Geography
- 5.5.1 North America
- 5.5.1.1 United States
- 5.5.1.2 Canada
- 5.5.1.3 Mexico
- 5.5.2 Europe
- 5.5.2.1 Germany
- 5.5.2.2 United Kingdom
- 5.5.2.3 France
- 5.5.2.4 Italy
- 5.5.2.5 Spain
- 5.5.2.6 Rest of Europe
- 5.5.3 Asia-Pacific
- 5.5.3.1 China
- 5.5.3.2 Japan
- 5.5.3.3 India
- 5.5.3.4 South Korea
- 5.5.3.5 Australia
- 5.5.3.6 Rest of Asia-Pacific
- 5.5.4 South America
- 5.5.4.1 Brazil
- 5.5.4.2 Argentina
- 5.5.4.3 Rest of South America
- 5.5.5 Middle East and Africa
- 5.5.5.1 Middle East
- 5.5.5.1.1 Saudi Arabia
- 5.5.5.1.2 United Arab Emirates
- 5.5.5.1.3 Turkey
- 5.5.5.1.4 Rest of Middle East
- 5.5.5.2 Africa
- 5.5.5.2.1 South Africa
- 5.5.5.2.2 Egypt
- 5.5.5.2.3 Nigeria
- 5.5.5.2.4 Rest of Africa
- 5.5.5.1 Middle East
- 5.5.1 North America
6 COMPETITIVE LANDSCAPE
- 6.1 Market Concentration
- 6.2 Strategic Moves
- 6.3 Market Share Analysis
- 6.4 Company Profiles (includes Global level Overview, Market level overview, Core Segments, Financials as available, Strategic Information, Market Rank/Share for key companies, Products and Services, and Recent Developments)
- 6.4.1 ABB Ltd.
- 6.4.2 FANUC Corp.
- 6.4.3 KUKA AG
- 6.4.4 Yaskawa Electric Corp.
- 6.4.5 Mitsubishi Electric Corp.
- 6.4.6 Northrop Grumman Corp.
- 6.4.7 Omron Adept Technologies Inc.
- 6.4.8 iRobot Corp.
- 6.4.9 Honda Motor Co. Ltd.
- 6.4.10 Alphabet Inc. (Intrinsic X)
- 6.4.11 Boston Dynamics Inc.
- 6.4.12 DJI Technology Co. Ltd.
- 6.4.13 Teradyne Inc. (Universal Robots and Mobile Industrial Robots)
- 6.4.14 Amazon Robotics (Amazon.com Inc.)
- 6.4.15 Intuitive Surgical Inc.
- 6.4.16 AgEagle Aerial Systems Inc.
- 6.4.17 SANY Heavy Industry Co. Ltd.
- 6.4.18 Insitu Inc. (Boeing)
- 6.4.19 Baidu Apollo Robotics
- 6.4.20 Kraken Robotics Inc.
7 MARKET OPPORTUNITIES AND FUTURE OUTLOOK
- 7.1 White-space and Unmet-need Assessment