|
시장보고서
상품코드
2114077
모바일 기기 관리 : 시장 점유율 분석, 업계 동향 및 통계, 성장 예측(2026-2031년)Mobile Device Management - Market Share Analysis, Industry Trends & Statistics, Growth Forecasts (2026 - 2031) |
||||||
 Mordor Intelligence
Mordor Intelligence에 의하면, 모바일 기기 관리 시장 규모는 2026년에 111억 1,000만 달러에 이르고, 2031년까지 260억 4,000만 달러에 이를 것으로 예측되며, 이 기간 CAGR은 18.57%가 됩니다.
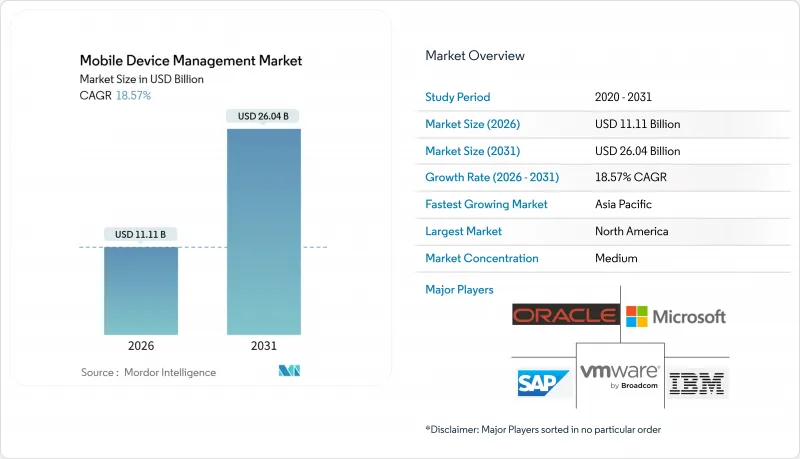
본 보고서는 배포 방식(On-Premise 및 클라우드), 기기 유형(스마트폰·태블릿, 노트북·데스크톱 PC, 기타), 최종 사용자 산업(IT 및 통신, 은행, 금융서비스 및 보험(BFSI), 기타), 소유 모델(기업 소유 기기, BYOD, COPE, CYOD) 및 지역(북미, 남미, 유럽, 아시아태평양, 중동 및 아프리카)별로 분류되어 있습니다. 시장 예측은 금액(달러) 기준으로 제시되어 있습니다.
세계 모바일 기기 관리 시장 동향 및 인사이트
기업 내 BYOD 정책의 폭발적인 확산
하이브리드 근무의 보급에 따라, 2025년에는 조직의 82%가 직원이 소유한 스마트폰이나 태블릿을 기업 네트워크에서 사용하도록 허용할 전망입니다. 이는 2023년의 67%에서 증가한 수치입니다. 이처럼 기기 수가 증가하면 OS 조합, 개인용 클라우드 앱, 관리 대상이 아닌 데이터 경로가 두 배로 늘어나며, 컨테이너화 및 원격 삭제 제어가 필요해집니다. 보험사는 관리 대상이 아닌 엔드포인트가 존재할 경우, 보상을 거부하거나 추가 요금을 청구하는 사례가 증가하고 있어, 위험 이전의 전제조건으로 MDM 도입이 요구되고 있습니다. 업무용 단말기 수당 폐지를 통한 비용 절감은 재무 부서 입장에서 매력적인 요소이지만, GDPR(EU 개인정보보호규정)이나 캘리포니아주 소비자 개인정보 보호법(CCPR)에 따른 정보 유출 관련 벌금이 그 절감 효과를 상쇄할 가능성이 있습니다. 그 결과, 경영진은 모바일 기기 관리 시장을 단순한 효율화를 위한 선택적 도구가 아닌, 규제에 따른 과태료나 보험료 인상에 대한 직접적인 헤지 수단으로 인식하고 있습니다.
클라우드 네이티브 UEM 제품군으로의 전환 가속화
기업들은 On-Premise 콘솔을 폐지하고, 단일 정책 구조 하에서 스마트폰, 노트북, 웨어러블 기기, IoT 기기를 통합하는 클라우드 플랫폼으로 전환하고 있습니다. Azure Active Directory와 통합된 Microsoft Intune은 조건부 액세스에 따른 판단 과정에서 기기 상태, 사용자 신원, 앱 컨텍스트가 실시간으로 평가되도록 한 좋은 예입니다. 탄력적인 용량 덕분에 서버 조달 주기가 불필요해졌으며, 자동 업데이트를 통해 새롭게 수립되는 제로 트러스트 지침에 대한 지속적인 준수가 보장됩니다. 중기적인 이점으로는 머신 러닝을 통한 설정 편차 수정 및 하드웨어 장애 예측 알림 등을 들 수 있으며, 이를 통해 엔드포인트 관리에 드는 노력을 최대 40%까지 줄일 수 있습니다. 전환을 지연하면 FIDO2나 포스트 양자 알고리즘과 같은 새로운 표준이 On-Premise 소프트웨어의 릴리스 주기를 앞지르게 되어 기술적 부채의 위험이 높아집니다.
레거시 IAM/ITSM 스택과의 통합에 따른 초기 비용
구식 ID 관리 도구나 헬프데스크 도구에 의존하고 있는 기업은 최신 MDM을 도입할 때, 맞춤형 API, 디렉터리 동기화 및 워크플로우 오케스트레이션에 비용을 투자해야 합니다. 컨설팅 비용은 50만 달러를 초과하는 경우가 많으며, 프로젝트 기간이 1년에 달하기도 하여 중견 기업의 예산을 압박합니다. 인증 프로토콜이 혼재되어 있으면 단일 장애 지점이 발생하여 사고 대응이 지연되는 원인이 됩니다. 또한, 금융 및 의료 분야의 엄격한 변경 관리 위원회로 인해 테스트 주기가 장기화됩니다. 이러한 비용상의 마찰로 인해 규제가 엄격한 기존 기업들의 모바일 기기 관리 도입이 일시적으로 주춤하고 있습니다.
부문 분석
클라우드 호스팅형 플랫폼은 2025년 매출의 65.13%를 차지하며, 모바일 기기 관리 시장에서 그 우위를 입증하고 있습니다. 2031년까지의 연평균 성장률(CAGR) 19.12%는 유연한 확장성, 기능의 자동 업데이트, 그리고 자본 지출을 운영비로 전환하는 종량제 요금제를 반영한 것입니다. 마이크로소프트 및 VMware와 같은 벤더들은 SIEM, IAM, EDR 도구와 통합 가능한 REST API를 제공하여 통합에 소요되는 시간을 단축하고 있습니다. 한때 퍼블릭 클라우드를 거부했던 국방 기관이나 금융 기관조차 재해 복구를 위해 각국의 데이터센터 간에 정책을 반영하는 하이브리드형 솔루션을 채택하게 되면서, 클라우드의 보급 범위는 더욱 확대되고 있습니다.
자율적인 엔드포인트 관리는 머신 러닝 엔진이 텔레메트리 데이터를 분석하여 구성 요소의 고장을 예측하고, 드리프트를 자체 수정함으로써 이러한 전환을 가속화하고 있습니다. 가트너는 자율 기능이 성숙해지는 2029년까지 인건비가 40% 절감될 것으로 추정하고 있으며, 이는 모바일 기기 관리(MDM) 시장에서 클라우드 제공이 지지받는 이유를 뒷받침합니다. 제로 터치 프로비저닝을 통해 기기는 최종 사용자에게 직접 배송되며, QR 코드를 통해 자동 등록이 가능해집니다. 이는 팬데믹으로 인한 봉쇄 기간 동안 정착된 관행입니다. 그러나 이러한 가치 제안은 하드웨어 인증과 안전한 공급망에 달려 있습니다. 펌웨어가 침해될 경우, 기기가 연결되기 전에 원격 관리 보안 조치가 무력화될 가능성이 있기 때문입니다.
2025년 매출 중스마트폰 및 태블릿이 48.28%를 차지했으나, 공장에서 로봇에 셀룰러 모듈을 탑재하고, 차량 군에 러기드 핸드헬드 단말기를 도입하며, 유틸리티자가 스마트 계량기를 설치함에 따라 산업용 IoT 엔드포인트는 연평균 성장률(CAGR) 20.34%로 성장할 전망입니다. 셀룰러 IoT 연결 건수는 2030년까지 56억 건에 달할 것으로 예측되며, 각각에 대해 인증서 갱신, 패치 적용 및 네트워크 액세스 제어가 필요합니다. 노트북은 코드 개발이나 재무 모델링에 여전히 필수적이지만, 브라우저 기반 앱의 등장으로 그 성장 곡선은 정체되어 있습니다.
견고한 기기와 웨어러블 기기는 가혹한 환경이나 감염 관리 규정으로 인해 일반용 하드웨어 사용이 제한되는 건설, 광업, 의료 현장 등에서 활약하고 있습니다. OMA-DM이나 LwM2M과 같은 경량 프로토콜은 에이전트의 실적를 축소하고 배터리 및 CPU 소비를 절감합니다. 5G 네트워크 슬라이싱은 텔레메트리 전용 대역폭을 제공하여 자율주행차나 원격 수술에서 신뢰할 수 있는 처리량을 보장합니다. 이러한 추세에 따라 모바일 기기 관리(MDM) 시장에서 전력 소비를 고려한 정책 폴링이나 엣지 캐시를 통한 업데이트 등 IoT 지향적 기능에 대한 투자가 촉진되고 있습니다.
지역별 분석
북미는 2025년에 38.71%의 점유율을 차지했습니다. 이는 BYOD의 조기 도입, 엄격한 사이버 보험 조항, 그리고 탄탄한 벤더 생태계에 힘입은 결과입니다. 미국 사이버보안 및 인프라 보안국(CISA)은 엔드포인트 관리를 중요 인프라의 핵심 보호 수단으로 규정하고 있으며, 이로 인해 공공 부문에서의 도입이 가속화되고 있습니다. 캐나다와 멕시코의 데이터 보호법은 해당 지역 내에 호스팅된 클라우드 인스턴스의 성장을 뒷받침하고 있으며, 미국-멕시코-캐나다 협정(USMCA)은 국경을 넘는 데이터 유통을 촉진하고 있습니다. 대기업 시장이 포화 상태에 가까워짐에 따라 시장 성장은 안정화되고 있지만, 전담 IT 인력을 보유하지 않은 중소기업은 모바일 기기 관리 시장에 있어 여전히 중요한 성장 동력으로 작용하고 있습니다.
유럽의 동향은 GDPR(EU 개인정보보호규정)(일반 데이터 보호 규정) 준수 및 ESG(환경·사회·지배구조) 지침에 좌우됩니다. 독일, 영국, 프랑스가 수요의 중심을 이루고 있지만, ‘기업의 지속가능성에 관한 실사 지침’에 따라 탄소 발자국을 공개하고 수리 권리를 지원하는 공급업체가 우대받고 있습니다. 러시아에 대한 제재로 인해 서유럽의 클라우드 서비스가 제한되고 있어, 국내 대체 서비스 개발이 진행되고 있습니다. 근로자 대표 위원회는 GDPR(EU 개인정보보호규정) 제88조에 근거하여 기기 추적에 관한 제한 사항에 대해 정기적으로 협상을 진행하고 있으며, 이는 라이선스 판매량보다 기능 채택률에 더 큰 영향을 미치고 있습니다.
아시아태평양은 연평균 성장률(CAGR) 10.23%로 가장 빠르게 성장하는 지역이며, 인도의 ‘디지털 인디아(Digital India)’ 구상, 중국의 스마트 제조 추진, 그리고 일본의 ‘사회 5.0’ 인프라 비전이 이를 뒷받침하고 있습니다. 한국에서는 5G 환경이 성숙해짐에 따라 자율 시스템을 위한 저지연 MDM 기능의 조기 도입이 진행되고 있습니다. 호주 및 뉴질랜드에서는 ‘Essential Eight’을 통해 사이버 보안 기준이 강화되면서 MDM의 역할이 더욱 중요해지고 있습니다. 중동에서는 아랍에미리트(UAE)와 사우디아라비아에서 성장세가 두드러지고 있으며, 아프리카에서는 나이지리아와 케냐의 핀테크 생태계를 중심으로 도입이 초기 단계에 있습니다. 이러한 움직임은 전반적으로 모바일 기기 관리(MDM) 시장의 확대로 이어지지만, 기능의 현지화와 자국 내 데이터 호스팅이 요구되고 있습니다.
기타 혜택:
- 엑셀 형식 시장 예측(ME) 시트
- 3개월간의 애널리스트 지원
자주 묻는 질문
목차
제1장 서론
제2장 조사 방법
제3장 주요 요약
제4장 시장 구도
제5장 시장 규모와 성장 예측
제6장 경쟁 구도
제7장 시장 기회와 향후 전망
LSH 26.08.25According to Mordor Intelligence, the mobile device management market size stands at USD 11.11 billion in 2026 and is projected to reach USD 26.04 billion by 2031, reflecting an 18.57% CAGR over the period.
This report is Segmented by Deployment Mode (On-Premise, and Cloud), Device Type (Smartphones and Tablets, Laptops and Desktops, and More), End-User Industry (IT and Telecom, BFSI, and More), Ownership Model (Corporate-Owned Devices, BYOD, COPE, CYOD), and Geography (North America, South America, Europe, Asia Pacific, Middle East, Africa). The Market Forecasts are Provided in Terms of Value (USD).
Global Mobile Device Management Market Trends and Insights
Explosion of Enterprise BYOD Policies
Hybrid work has pushed 82% of organizations to allow employee-owned phones and tablets on corporate networks in 2025, up from 67% in 2023. This expanded fleet multiplies operating-system permutations, personal cloud apps, and unmanaged data paths, demanding containerization and remote-wipe controls. Insurers are increasingly denying or surcharging coverage when unmanaged endpoints exist, making MDM adoption a prerequisite for risk transfer. Cost savings from eliminating corporate device stipends can entice finance teams; however, breach-related penalties under the GDPR or the California Consumer Privacy Rights Act may offset those savings. As a result, executives view the Mobile Device Management market as a direct hedge against regulatory fines and premium hikes rather than an optional efficiency tool.
Accelerating Shift to Cloud-Native UEM Suites
Organizations are abandoning on-premise consoles for cloud platforms that consolidate phones, laptops, wearables, and IoT devices behind a single policy fabric. Microsoft Intune, integrated with Azure Active Directory, exemplifies how conditional access decisions now assess real-time device health, user identity, and app context. Elastic capacity removes server procurement cycles, while automatic updates ensure continuous compliance with emerging zero-trust guidelines. Medium-term gains include machine-learning remediation of configuration drift and predictive hardware failure alerts, cutting endpoint management labor by as much as 40%. Delayed migrations risk technical debt as emerging standards such as FIDO2 and post-quantum algorithms outpace on-premise software release cycles.
Up-Front Integration Cost with Legacy IAM/ITSM Stacks
Enterprises relying on outdated identity managers and help-desk tools must fund custom APIs, directory sync, and workflow orchestration when deploying modern MDM. Consulting fees often exceed USD 500,000, and projects can last a year, straining budgets for mid-sized firms. Mixed authentication protocols create single points of failure and incident-response delays, while strict change-control boards in finance and healthcare prolong testing cycles. This cost friction temporarily slows the uptake of Mobile Device Management among heavily regulated incumbents.
Other drivers and restraints analyzed in the detailed report include:
- Surge in Cyber-Insurance Mandates for Endpoint Control
- 5G-Enabled Field-Service Workforce Expansion
- Fragmented Regulatory Data-Sovereignty Rules
For complete list of drivers and restraints, kindly check the Table Of Contents.
Segment Analysis
Cloud-hosted platforms controlled 65.13% of 2025 revenue, confirming their dominance in the Mobile Device Management market. The model's 19.12% CAGR to 2031 reflects elastic scaling, automatic feature updates, and pay-as-you-go pricing that converts capital outlays into operating expenses. Vendors such as Microsoft and VMware expose REST APIs that integrate with SIEM, IAM, and EDR tools, trimming integration timelines. Even defense and financial institutions that once rejected public cloud now adopt hybrid blueprints that mirror policies across sovereign data centers for disaster recovery, further enlarging the cloud's footprint.
Autonomous endpoint management accelerates the shift, as machine-learning engines analyze telemetry, predict component failures, and self-correct drift. Gartner estimates a 40% cut in labor costs by 2029 when autonomous capabilities mature, underscoring why the Mobile Device Management market favors cloud delivery. Zero-touch provisioning enables devices to ship directly to end users and self-enroll through QR codes, a practice that was cemented during pandemic lockdowns. The value proposition, however, hinges on hardware attestation and a secure supply chain, because compromised firmware can defeat remote-management safeguards before devices even connect.
Smartphones and tablets owned 48.28% of 2025 revenue, but industrial IoT endpoints will grow at 20.34% CAGR as factories embed cellular modules in robots, fleets deploy rugged handhelds, and utilities install smart meters. Cellular IoT connections are projected to reach 5.6 billion by 2030, each requiring certificate rotation, patching, and network-access controls. Laptops remain vital for code development and financial modeling, yet browser-based apps flatten their growth curve.
Rugged and wearable devices thrive in construction, mining, and clinical settings where harsh environments or infection-control rules preclude consumer hardware. Lightweight protocols such as OMA-DM and LwM2M shrink agent footprints, conserving battery and CPU. 5G network slicing offers dedicated bandwidth for telemetry, ensuring reliable throughput for autonomous vehicles or remote surgery. These dynamics channel investment toward IoT-oriented functionality within the Mobile Device Management market, including power-aware policy polling and edge-cached updates.
Complete Report Scope:
- By Deployment Mode
- On-Premise
- Cloud
- By Device Type
- Smartphones and Tablets
- Laptops and Desktops
- Rugged and Wearable Devices
- IoT/IIoT Endpoints
- By End-User Industry
- IT and Telecom
- BFSI
- Healthcare and Life Sciences
- Retail and E-Commerce
- Government and Public Sector
- Manufacturing
- Education
- Transportation and Logistics
- By Ownership Model
- Corporate-Owned Devices
- BYOD
- COPE (Corporate-Owned, Personally Enabled)
- CYOD (Choose-Your-Own-Device)
- By Geography
- North America
- United States
- Canada
- Mexico
- South America
- Brazil
- Argentina
- Rest of South America
- Europe
- Germany
- United Kingdom
- France
- Italy
- Spain
- Russia
- Rest of Europe
- Asia Pacific
- China
- Japan
- South Korea
- India
- Australia
- New Zealand
- Rest of Asia Pacific
- Middle East
- United Arab Emirates
- Saudi Arabia
- Turkey
- Rest of Middle East
- Africa
- South Africa
- Nigeria
- Kenya
- Rest of Africa
- North America
Geography Analysis
North America held a 38.71% share in 2025, buoyed by early BYOD uptake, rigorous cyber-insurance clauses, and a dense vendor ecosystem. The United States Cybersecurity and Infrastructure Security Agency classifies endpoint management as a core safeguard for critical infrastructure, accelerating public-sector rollouts. Canadian and Mexican data-protection laws are driving the growth of regionally hosted cloud instances, yet the United States-Mexico-Canada Agreement facilitates cross-border data flow. Market growth steadies as large enterprises near saturation, but small firms without dedicated IT staff remain a significant expansion vector for the Mobile Device Management market.
Europe's trajectory depends on GDPR compliance and ESG directives. Germany, the United Kingdom, and France anchor demand, while the Corporate Sustainability Due Diligence Directive rewards vendors that disclose their carbon footprints and support the right to repair. Russian sanctions restrict Western cloud services, prompting the development of domestic alternatives. Works councils routinely negotiate device-tracking limitations under GDPR Article 88, affecting feature uptake more than license volumes.
Asia Pacific is the fastest-growing region at 10.23% CAGR, underpinned by India's Digital India scheme, China's smart manufacturing push, and Japan's Society 5.0 infrastructure vision. South Korea's mature 5G landscape encourages early adoption of low-latency MDM features for autonomous systems. Australia and New Zealand strengthen cybersecurity baselines through the Essential Eight, reinforcing MDM's role. The Middle East sees momentum in the United Arab Emirates and Saudi Arabia, while Africa's nascent uptake concentrates in Nigeria and Kenya's fintech ecosystems. Collectively, these initiatives broaden the Mobile Device Management market but demand feature localization and sovereign data hosting.
- VMware Inc.
- Microsoft Corporation (Intune)
- IBM Corporation
- Citrix Systems Inc.
- SAP SE
- Broadcom Inc. (Symantec)
- Cisco Systems Inc.
- Ivanti Software Inc.
- JAMF Software LLC
- SOTI Inc.
- ManageEngine (Zoho Corporation)
- Hexnode (UEM)
- 42Gears Mobility Systems
- Scalefusion
- Baramundi Software AG
- Addigy
- Miradore Ltd.
- Kaspersky Lab
- Sophos Group plc
- MobileIron Inc.
- BlackBerry Limited
- Check Point Software Technologies Ltd.
- Google LLC (Android Enterprise)
- Lookout Inc.
Additional Benefits:
- The market estimate (ME) sheet in Excel format
- 3 months of analyst support
TABLE OF CONTENTS
1 INTRODUCTION
- 1.1 Study Assumptions and Market Definition
- 1.2 Scope of the Study
2 RESEARCH METHODOLOGY
3 EXECUTIVE SUMMARY
4 MARKET LANDSCAPE
- 4.1 Market Overview
- 4.2 Market Drivers
- 4.2.1 Explosion of Enterprise BYOD Policies
- 4.2.2 Accelerating Shift to Cloud-Native UEM Suites
- 4.2.3 Surge in Cyber-Insurance Mandates for Endpoint Control
- 4.2.4 5G-Enabled Field-Service Workforce Expansion
- 4.2.5 Post-Quantum Security Preparations Elevating Device Trust Stacks
- 4.2.6 ESG-Linked Procurement Favouring Secure-Device Vendors
- 4.3 Market Restraints
- 4.3.1 Up-Front Integration Cost with Legacy IAM/ITSM Stacks
- 4.3.2 Fragmented Regulatory Data-Sovereignty Rules
- 4.3.3 Growing Employee Privacy Push-Back on Device Tracking
- 4.3.4 Limited Battery/CPU Headroom on Rugged IoT Endpoints
- 4.4 Industry Value Chain Analysis
- 4.5 Regulatory Landscape
- 4.6 Technological Outlook
- 4.7 Porter's Five Forces Analysis
- 4.7.1 Bargaining Power of Suppliers
- 4.7.2 Bargaining Power of Buyers
- 4.7.3 Threat of New Entrants
- 4.7.4 Threat of Substitutes
- 4.7.5 Intensity of Competitive Rivalry
- 4.8 Impact Assessment of Key Stakeholders
- 4.9 Key Use Cases and Case Studies
- 4.10 Impact of Macroeconomic Factors on the Market
5 MARKET SIZE AND GROWTH FORECASTS (VALUE)
- 5.1 By Deployment Mode
- 5.1.1 On-Premise
- 5.1.2 Cloud
- 5.2 By Device Type
- 5.2.1 Smartphones and Tablets
- 5.2.2 Laptops and Desktops
- 5.2.3 Rugged and Wearable Devices
- 5.2.4 IoT/IIoT Endpoints
- 5.3 By End-User Industry
- 5.3.1 IT and Telecom
- 5.3.2 BFSI
- 5.3.3 Healthcare and Life Sciences
- 5.3.4 Retail and E-Commerce
- 5.3.5 Government and Public Sector
- 5.3.6 Manufacturing
- 5.3.7 Education
- 5.3.8 Transportation and Logistics
- 5.4 By Ownership Model
- 5.4.1 Corporate-Owned Devices
- 5.4.2 BYOD
- 5.4.3 COPE (Corporate-Owned, Personally Enabled)
- 5.4.4 CYOD (Choose-Your-Own-Device)
- 5.5 By Geography
- 5.5.1 North America
- 5.5.1.1 United States
- 5.5.1.2 Canada
- 5.5.1.3 Mexico
- 5.5.2 South America
- 5.5.2.1 Brazil
- 5.5.2.2 Argentina
- 5.5.2.3 Rest of South America
- 5.5.3 Europe
- 5.5.3.1 Germany
- 5.5.3.2 United Kingdom
- 5.5.3.3 France
- 5.5.3.4 Italy
- 5.5.3.5 Spain
- 5.5.3.6 Russia
- 5.5.3.7 Rest of Europe
- 5.5.4 Asia Pacific
- 5.5.4.1 China
- 5.5.4.2 Japan
- 5.5.4.3 South Korea
- 5.5.4.4 India
- 5.5.4.5 Australia
- 5.5.4.6 New Zealand
- 5.5.4.7 Rest of Asia Pacific
- 5.5.5 Middle East
- 5.5.5.1 United Arab Emirates
- 5.5.5.2 Saudi Arabia
- 5.5.5.3 Turkey
- 5.5.5.4 Rest of Middle East
- 5.5.6 Africa
- 5.5.6.1 South Africa
- 5.5.6.2 Nigeria
- 5.5.6.3 Kenya
- 5.5.6.4 Rest of Africa
- 5.5.1 North America
6 COMPETITIVE LANDSCAPE
- 6.1 Market Concentration
- 6.2 Strategic Moves
- 6.3 Market Share Analysis
- 6.4 Company Profiles
- 6.4.1 VMware Inc.
- 6.4.2 Microsoft Corporation (Intune)
- 6.4.3 IBM Corporation
- 6.4.4 Citrix Systems Inc.
- 6.4.5 SAP SE
- 6.4.6 Broadcom Inc. (Symantec)
- 6.4.7 Cisco Systems Inc.
- 6.4.8 Ivanti Software Inc.
- 6.4.9 JAMF Software LLC
- 6.4.10 SOTI Inc.
- 6.4.11 ManageEngine (Zoho Corporation)
- 6.4.12 Hexnode (UEM)
- 6.4.13 42Gears Mobility Systems
- 6.4.14 Scalefusion
- 6.4.15 Baramundi Software AG
- 6.4.16 Addigy
- 6.4.17 Miradore Ltd.
- 6.4.18 Kaspersky Lab
- 6.4.19 Sophos Group plc
- 6.4.20 MobileIron Inc.
- 6.4.21 BlackBerry Limited
- 6.4.22 Check Point Software Technologies Ltd.
- 6.4.23 Google LLC (Android Enterprise)
- 6.4.24 Lookout Inc.
7 MARKET OPPORTUNITIES AND FUTURE OUTLOOK
- 7.1 White-Space and Unmet-Need Assessment