

|
시장보고서
상품코드
2114084
시뮬레이션 소프트웨어 : 시장 점유율 분석, 업계 동향 및 통계, 성장 예측(2026-2031년)Simulation Software - Market Share Analysis, Industry Trends & Statistics, Growth Forecasts (2026 - 2031) |
||||||
 Mordor Intelligence
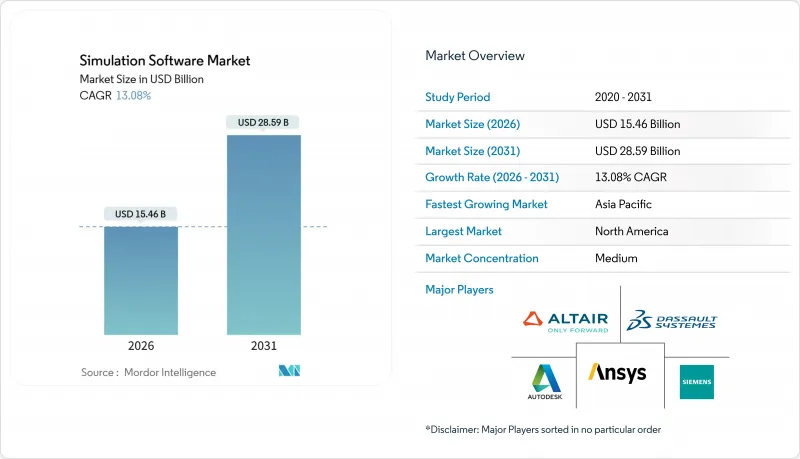
Mordor Intelligence에 의하면, 시뮬레이션 소프트웨어 시장 규모는 2026년에 154억 6,000만 달러, 2031년까지 285억 9,000만 달러에 이르고, CAGR 13.08%로 확대될 것으로 예측됩니다.
본 보고서는 도입 형태(On-Premise, 클라우드/SaaS), 최종 사용자 산업(자동차, 항공우주 및 방위, 전기 및 전자,에너지·석유·광업 등), 시뮬레이션 유형(FEA, CFD, 멀티바디 등), 적용 분야(제품 설계, 연구 개발 등), 구성 요소(라이선스, 서비스, 플랫폼) 및 지역별로 분류되어 있습니다. 시장 전망은 금액(달러) 기준으로 제시되어 있습니다.
세계 시뮬레이션 소프트웨어 시장 동향 및 인사이트
클라우드 네이티브 시뮬레이션 채택 확대
2025년, 구독 방식이 영구 라이선스를 대체하고 초기 하드웨어 투자가 불필요해짐에 따라 기업들은 솔버 워크로드를 퍼블릭 클라우드로 이전하는 움직임을 가속화했습니다. Amazon Web Services(AWS)의 Graviton 프로세서에서 수행된 Ansys 벤치마크에 따르면, 전산유체역학(CFD) 실행 시간이 30% 단축되고 시간당 비용도 절감되어, 단기간의 설계 스프린트에서도 유연한 컴퓨팅이 가능해졌습니다. 지멘스는 ‘Xcelerator as a Service’ 카탈로그를 확충하여, 중견 제조업체들이 On-Premise 클러스터를 유지하지 않고도 유한 요소법 및 멀티바디 솔버를 이용할 수 있도록 했습니다. 가트너의 보고서에 따르면, 2025년에 판매된 신규 시뮬레이션 라이선스의 40%가 SaaS 형식으로 제공되었으며, 이는 2023년의 28%에서 증가한 수치입니다. 이러한 전환으로 인해, 이전에는 외부 위탁에 의존하던 중소규모 기업도 고정밀 물리 시뮬레이션을 쉽게 이용할 수 있게 되었으며, 대형 기존 기업은 유휴 리소스를 보유하지 않고도 피크 시간대의 워크로드를 처리할 수 있게 되었습니다. 클라우드 도입에는 여전히 아웃바운드 통신 요금이나 데이터 주권에 관한 규제와 같은 과제가 있지만, 향후 가격 동향을 고려할 때 반복 설계에는 하이퍼스케일 활용이 유리합니다.
자동차 업계의 가상 검증 수요
가상 테스트벤치가 성숙해짐에 따라, 자동차 제조업체들은 실제 충돌 시험용 프로토타입의 수를 줄였습니다. 볼보는 유한 요소법을 이용한 탑승자 안전 모델을 과거 데이터와 대조하여 보정 작업을 진행한 결과, 2025년 전기 플랫폼용 실물 충돌 시험용 프로토타입의 수를 60% 줄였습니다고 발표했습니다. 미국 자동차 기술자 협회(SAE)의 새로운 규격에 따라 규제 당국은 배터리 열폭주에 관한 시뮬레이션 결과를 수용하게 되었으며, 형식 인증 비용이 소프트웨어 개발의 초기 단계로 이동하고 있습니다. MathWorks는 고해상도 배터리 전기화학 모델을 Simulink에 추가하여, 일반적인 설계 기간 내에 10년간의 열화 예측을 가능하게 했습니다. 전기자동차 플랫폼이 보급됨에 따라, 엔지니어링 팀은 현재 프로그램당 10만 건 이상의 가상 시나리오를 실행하여 경량화, 충돌 안전 성능 및 주행 거리의 상충 관계를 평가했습니다. 이러한 가상화를 통해 금형 수정 작업이 줄어들고, 시장 출시가 가속화되며, 보증 위험이 감소합니다.
HPC 인프라의 높은 총 소유 비용
2025년 시점에서 NVIDIA H100의 단가는 3만 달러를 초과하며, 64개의 GPU를 탑재한 충돌 해석용 랙은 독일의 산업용 전기 요금으로 연간 약 9만 달러의 전력비를 소비합니다. 이러한 경제적 요인으로 인해 중견 공급업체들은 가상 검증 확대를 주저하고 있습니다. 클라우드의 버스트 용량은 진입 장벽을 낮추지만, 상시 가동되는 워크로드의 경우 1년이 지나면 On-Premise 감가상각비를 초과할 가능성이 있습니다. 따라서 많은 기업이 하이브리드 환경을 운영하고 있으며, 안정적인 열 분석에는 사내 클러스터를 할당하고, 피크 시간대의 공기역학 해석에는 클라우드를 버스트 방식으로 이용하고 있습니다. 보조금이나 공유 시설이 없는 경우, 가격 급등으로 인해 중소 제조업체는 기존의 ‘설계·제조·시험’ 사이클에 머물러 디지털 트윈의 실제 적용이 제한되고 있습니다.
부문 분석
금액 기준으로 볼 때, 2025년 매출의 60.11%를 On-Premise 환경이 차지하고 있으며, 이는 지적 재산을 방화벽 내부에 보유하는 자동차 및 방위 관련 기업에 의해 주도되고 있습니다. 클라우드 및 SaaS 기반 제공과 관련된 시뮬레이션 소프트웨어 시장 규모는 중견 기업 사용자들이 피크 시간대의 워크로드에 대해 구독 모델을 채택하고 있기 때문에 시장 전체의 성장 궤적을 상회하는 연평균 성장률(CAGR) 13.22%로 확대되고 있습니다. 지멘스는 2025년에 1,200개의 신규 클라우드 고객을 확보했는데, 이는 기존 HPC 예산이 없는 기업들에게 탄력적인 컴퓨팅이 얼마나 새로운 가능성을 열어주고 있는지를 여실히 보여줍니다.
하이브리드 토폴로지가 일반적입니다. 안정적인 충돌 시험 스위트는 사내 클러스터에서 실행되는 반면, 일시적인 열 분석은 설계 스프린트 기간 동안 퍼블릭 클라우드로 버스트 처리됩니다. 오케스트레이션의 복잡성과 데이터 전송 지연이 여전히 진정한 워크로드 이식성을 제한하고 있지만, 수요가 변동하기 쉬운 경우에는 가격 곡선이 클라우드를 유리하게 만들고 있습니다. 예측 기간 동안 SaaS 매출이 증가분의 대부분을 차지할 것으로 보이지만, 계산 주권이 요구되는 수출 규제 대상 분야에서는 On-Premise 수요가 계속 남아 있을 것입니다.
2025년 시뮬레이션 소프트웨어 시장의 매출 중 자동차 분야가 28.32%를 차지했습니다. 이는 전기차 충돌 시뮬레이션, 자율 주행을 위한 센서 퓨전, 경량 바디-인-화이트 분석이 주도한 결과입니다. 한편, 헬스케어 및 생명과학 분야는 인실리코 시험을 통해 동물 실험 비용이 절감되고, 진화하는 FDA 지침에 따라 의료기기 승인이 가속화됨에 따라 2031년까지 연평균 성장률(CAGR) 13.58%를 나타낼 것으로 예측됩니다.
제약 기업들은 실험실에서의 실증 시험에 앞서 생리학적 약동학 모델을 활용하여 후보 물질을 선별하고 있으며, 의료기기 제조업체들은 규제 승인 주기를 단축하기 위해 인실리코를 통해 임플란트의 내구성을 검증하고 있습니다. 이 두 분야 외에도, 항공우주 업계에서는 공기역학 및 방사선 관련 연구에 대한 수요가 견조하게 유지되고 있는 반면, 전자기기 제조업체들은 칩 수준의 핫스팟을 억제하기 위해 열 분석 솔버를 활용하고 있습니다. 또한, 통신 사업자들이 가상 네트워크 에뮬레이터를 활용해 5G Open RAN 구축을 설계하고 있어, 시뮬레이션 소프트웨어 업계는 통신 분야의 활성화로 인해 혜택을 보고 있습니다.
지역별 분석
북미는 항공우주 분야의 주요 기업, 디트로이트 주변의 자동차 산업 거점, 그리고 실리콘 밸리의 반도체 설계 기업들에 힘입어 2025년 매출의 36.46%를 차지했습니다. 이 지역의 시뮬레이션 소프트웨어 시장 규모는 SaaS의 조기 도입과 성숙한 클라우드 거버넌스 프레임워크의 혜택을 받고 있습니다. 유럽은 이에 근소한 차이로 뒤를 이었으며, 자동차 전동화 규제와 라이프사이클 환경 시뮬레이션을 추진하는 ‘기업 지속가능성 보고 지침(CSRD)’이 견인 역할을 하고 있습니다. 독일, 프랑스, 영국이 수요의 중심을 이루고 있으며, 현지 주요 기업인 지멘스와 다쏘시스템이 이를 뒷받침하고 있습니다.
아시아태평양은 성장의 원동력이며, 2031년까지 연평균 성장률(CAGR) 14.60%로 확대되고 있습니다. 중국 공업정보화부는 중소 제조업체의 디지털 트윈 도입을 지원하고 있으며, 한편 인도의 엔지니어링 서비스 제공업체들은 전 세계 고객에게 시뮬레이션 인재 풀을 제공합니다. 일본은 인더스트리 4.0의 공장 모델링에 주력하고 있으며, 한국의 주요 반도체 기업들은 AI 칩의 성능 기준을 충족하기 위해 열 분석 및 전자기장 해석을 강화하고 있습니다. 베트남과 태국을 중심으로 한 동남아시아 국가들은 전자기기 및 자동차 조립 라인을 유치하고 있으며, 현재는 공장 레이아웃 결정에 이산 사건 시뮬레이션이 통합되어 있습니다.
남미 및 중동에서는 브라질의 항공우주 산업과 걸프 연안 국가들의 인프라 메가 프로젝트를 중심으로 점진적인 도입이 진행되고 있습니다. 아프리카 수요는 남아프리카공화국의 광업 및 자동차 산업에 집중되어 있지만, HPC에 대한 접근성이 제한적이라는 점이 걸림돌이 되고 있습니다. 이 3대 클러스터 이외 지역의 전반적인 보급 상황은 클라우드 비용 추이와, 부족한 시뮬레이션 전문 지식을 보완할 수 있는 대학 커리큘럼에 좌우됩니다.
기타 혜택:
- 엑셀 형식 시장 예측(ME) 시트
- 3개월간의 애널리스트 지원
자주 묻는 질문
목차
제1장 서론
제2장 조사 방법
제3장 주요 요약
제4장 시장 구도
제5장 시장 규모와 성장 예측
제6장 경쟁 구도
제7장 시장 기회와 향후 전망
LSH 26.08.25According to Mordor Intelligence, the simulation software market size is valued at USD 15.46 billion in 2026 and is projected to reach USD 28.59 billion by 2031, advancing at a 13.08% CAGR.
This report is Segmented by Deployment Type (On-Premise, and Cloud/SaaS), End-User Industry (Automotive, Aerospace and Defense, Electrical and Electronics, Energy/Oil/Mining, and More), Simulation Type (FEA, CFD, Multibody, and More), Application Area (Product Design, R&D, and More), Component (Licenses, Services, and Platform), and Geography. Market Forecasts are Provided in Terms of Value (USD).
Global Simulation Software Market Trends and Insights
Rising Cloud-Native Simulation Adoption
Enterprises accelerated the lift-and-shift of solver workloads to public clouds during 2025 as subscription pricing replaced perpetual licenses, eliminating upfront hardware capital. Ansys benchmarks on Amazon Web Services Graviton processors cut computational fluid dynamics runtimes by 30% and reduced hourly costs, making elastic compute viable for short design sprints. Siemens broadened its Xcelerator as a Service catalogue, giving mid-market manufacturers access to finite-element and multibody solvers without maintaining on-premises clusters. Gartner reported that 40% of new simulation seats sold in 2025 used SaaS delivery, up from 28% in 2023. The switch democratizes high-fidelity physics for smaller firms that previously relied on outsourced engineering, and it allows large incumbents to burst peak workloads without idle capacity. Cloud adoption still contends with egress fees and data-sovereignty rules, but forward pricing curves favour hyperscale usage for iterative design.
Automotive Demand for Virtual Validation
Original equipment manufacturers trimmed physical crash prototypes as virtual test benches matured. Volvo disclosed a 60% reduction in physical crash builds for its 2025 electric platform after calibrating finite-element occupant safety models against historical data. New Society of Automotive Engineers norms let regulators accept simulation results for battery thermal runaway, shifting homologation cost upstream to software. MathWorks enhanced Simulink with high-resolution electrochemical battery models, enabling 10-year degradation forecasts within normal design windows. As electric-vehicle platforms proliferate, engineering teams now run more than 100,000 virtual scenarios per program to evaluate lightweighting, crashworthiness, and range trade-offs. This virtualization trims tooling rework, accelerates launches, and squeezes warranty risk.
High Total Cost of Ownership for HPC Infrastructure
NVIDIA H100 units listed above USD 30,000 in 2025, and a 64-GPU crash-analysis rack consumed roughly USD 90,000 in annual electricity at German industrial tariffs. Such economics deter mid-tier suppliers from scaling virtual validation. Cloud burst capacity lowers entry hurdles, but always-on workloads can outstrip on-premises amortization after the first year. Many firms therefore operate hybrid estates, reserving internal clusters for steady thermal analysis and bursting to cloud for peak aerodynamics studies. Without subsidies or shared facilities, price shock keeps smaller manufacturers on legacy design-build-test loops and limits the diffusion of digital-twin practices.
Other drivers and restraints analyzed in the detailed report include:
- Rapid Uptake of Digital-Twin Initiatives
- AI-Driven Generative Simulation Workflows
- Data Interoperability and Standards Gaps
For complete list of drivers and restraints, kindly check the Table Of Contents.
Segment Analysis
In value terms, on-premises estates accounted for 60.11% of 2025 revenue, driven by automotive and defense firms that keep intellectual property behind firewalls. The simulation software market size tied to cloud and SaaS delivery is advancing at a 13.22% CAGR, faster than the overall trajectory, as mid-market users adopt subscription models for peak workloads. Siemens added 1,200 new cloud customers in 2025, highlighting how elastic compute opens doors for companies without traditional HPC budgets.
Hybrid topologies are common: steady crash suites run on internal clusters, while transient thermal studies burst to public clouds during design sprints. Orchestration complexity and data-transfer latency still limit true workload portability, yet pricing curves favour cloud for variable demand. Over the forecast horizon, SaaS revenue should account for the majority of incremental gains, though on-premises residuals will persist in export-controlled domains where compute sovereignty is required.
Automotive accounted for 28.32% of 2025 revenue in the simulation software market, powered by electric-vehicle crash simulations, autonomous-driving sensor fusion, and lightweight body-in-white analysis. Healthcare and life sciences, however, are projected to grow at a 13.58% CAGR through 2031 as in-silico trials reduce animal testing costs and accelerate device approvals under evolving FDA guidance.
Pharma companies employ physiologically based pharmacokinetic models to screen candidates before wet labs, and medical-device firms validate implant durability in silico to shorten regulatory cycles. Outside these two verticals, aerospace retains steady demand for aerodynamic and radiation studies, while electronics manufacturers use thermal solvers to contain chip-level hotspots. The simulation software industry also benefits from rising telecom activity as operators design 5G Open RAN rollouts with virtual network emulators.
Complete Report Scope:
- By Deployment Type
- On-Premise
- Cloud / SaaS
- By End-User Industry
- Automotive
- Aerospace and Defense
- Electrical and Electronics
- Energy, Oil and Mining
- IT and Telecom
- Healthcare and Life Sciences
- Education and Research
- Other End-User Industries
- By Simulation Type
- Finite-Element Analysis (FEA)
- Computational Fluid Dynamics (CFD)
- Multibody and Dynamics
- Discrete-Event and Process Simulation
- Electromagnetic and RF
- System-Level and 1-D
- By Application Area
- Product Design and Engineering
- Research and Development / Innovation
- Process and Operations Optimization
- Training, Safety and Digital Mock-Up
- Digital Twin Lifecycle Management
- By Component
- Software Licences
- Services and Consulting
- Platform and Integration
- By Geography
- North America
- United States
- Canada
- Mexico
- South America
- Brazil
- Argentina
- Rest of South America
- Europe
- Germany
- United Kingdom
- France
- Italy
- Netherlands
- Russia
- Rest of Europe
- Asia Pacific
- China
- Japan
- India
- South Korea
- ASEAN
- Rest of Asia Pacific
- Middle East
- United Arab Emirates
- Saudi Arabia
- Rest of Middle East
- Africa
- South Africa
- Nigeria
- Rest of Africa
- North America
Geography Analysis
North America retained 36.46% of 2025 revenue, bolstered by aerospace primes, Detroit-area automotive hubs, and Silicon Valley chip designers. The simulation software market size across the region benefits from early SaaS uptake and mature cloud governance frameworks. Europe follows closely, driven by automotive electrification mandates and the Corporate Sustainability Reporting Directive that pushes lifecycle environmental simulation. Germany, France, and the United Kingdom anchor demand, aided by local champions Siemens and Dassault Systemes.
Asia Pacific is the growth engine, scaling at a 14.60% CAGR through 2031. China's Ministry of Industry and Information Technology subsidizes digital twins among small manufacturers, while India's engineering-services providers extend simulation talent pools to global clients. Japan focuses on Industry 4.0 factory modelling, and South Korea's semiconductor majors intensify thermal and electromagnetic analysis to meet AI chip performance thresholds. Southeast Asian nations, led by Vietnam and Thailand, attract electronics and automotive assembly lines that now embed discrete-event simulation into plant layout decisions.
South America and the Middle East show modest uptake centered on Brazilian aerospace and Gulf infrastructure megaprojects. African demand is concentrated in South African mining and automotive, hindered by limited HPC access. Overall uptake outside the tri-polar clusters depends on cloud cost curves and university curricula that can replenish scarce simulation expertise.
- Ansys, Inc.
- Dassault Systemes SE
- Siemens Digital Industries Software Inc.
- Altair Engineering Inc.
- Autodesk, Inc.
- MSC Software Corporation
- The MathWorks, Inc.
- PTC Inc.
- Synopsys, Inc.
- ESI Group SA
- CPFD Software, LLC
- Rockwell Automation, Inc.
- Bentley Systems, Incorporated
- Simio, LLC
- Lanner Group Ltd
- SIMUL8 Corporation
- Flow Science, Inc.
- COMSOL AB
- Schneider Electric SE
- SolidWorks Corporation
Additional Benefits:
- The market estimate (ME) sheet in Excel format
- 3 months of analyst support
TABLE OF CONTENTS
1 INTRODUCTION
- 1.1 Study Assumptions and Market Definition
- 1.2 Scope of the Study
2 RESEARCH METHODOLOGY
3 EXECUTIVE SUMMARY
4 MARKET LANDSCAPE
- 4.1 Market Overview
- 4.2 Market Drivers
- 4.2.1 Rising Cloud-Native Simulation Adoption
- 4.2.2 Automotive Demand for Virtual Validation
- 4.2.3 Rapid Uptake of Digital-Twin Initiatives
- 4.2.4 AI-Driven Generative Simulation Workflows
- 4.2.5 ESG-Mandated Virtual Sustainability Assessments
- 4.2.6 5G, Open RAN Network-Function Virtualization Testing
- 4.3 Market Restraints
- 4.3.1 High Total Cost of Ownership for HPC Infrastructure
- 4.3.2 Data Interoperability and Standards Gaps
- 4.3.3 IP Security Concerns in Cloud Outsourcing
- 4.3.4 Scarcity of Vertical-Domain Simulation Talent
- 4.4 Industry Value-Chain Analysis
- 4.5 Regulatory Landscape
- 4.6 Technological Outlook
- 4.7 Impact of Macroeconomic Factors on the Market
- 4.8 Porter's Five Forces Analysis
- 4.8.1 Threat of New Entrants
- 4.8.2 Bargaining Power of Buyers
- 4.8.3 Bargaining Power of Suppliers
- 4.8.4 Threat of Substitutes
- 4.8.5 Intensity of Competitive Rivalry
5 MARKET SIZE AND GROWTH FORECASTS (VALUE)
- 5.1 By Deployment Type
- 5.1.1 On-Premise
- 5.1.2 Cloud / SaaS
- 5.2 By End-User Industry
- 5.2.1 Automotive
- 5.2.2 Aerospace and Defense
- 5.2.3 Electrical and Electronics
- 5.2.4 Energy, Oil and Mining
- 5.2.5 IT and Telecom
- 5.2.6 Healthcare and Life Sciences
- 5.2.7 Education and Research
- 5.2.8 Other End-User Industries
- 5.3 By Simulation Type
- 5.3.1 Finite-Element Analysis (FEA)
- 5.3.2 Computational Fluid Dynamics (CFD)
- 5.3.3 Multibody and Dynamics
- 5.3.4 Discrete-Event and Process Simulation
- 5.3.5 Electromagnetic and RF
- 5.3.6 System-Level and 1-D
- 5.4 By Application Area
- 5.4.1 Product Design and Engineering
- 5.4.2 Research and Development / Innovation
- 5.4.3 Process and Operations Optimization
- 5.4.4 Training, Safety and Digital Mock-Up
- 5.4.5 Digital Twin Lifecycle Management
- 5.5 By Component
- 5.5.1 Software Licences
- 5.5.2 Services and Consulting
- 5.5.3 Platform and Integration
- 5.6 By Geography
- 5.6.1 North America
- 5.6.1.1 United States
- 5.6.1.2 Canada
- 5.6.1.3 Mexico
- 5.6.2 South America
- 5.6.2.1 Brazil
- 5.6.2.2 Argentina
- 5.6.2.3 Rest of South America
- 5.6.3 Europe
- 5.6.3.1 Germany
- 5.6.3.2 United Kingdom
- 5.6.3.3 France
- 5.6.3.4 Italy
- 5.6.3.5 Netherlands
- 5.6.3.6 Russia
- 5.6.3.7 Rest of Europe
- 5.6.4 Asia Pacific
- 5.6.4.1 China
- 5.6.4.2 Japan
- 5.6.4.3 India
- 5.6.4.4 South Korea
- 5.6.4.5 ASEAN
- 5.6.4.6 Rest of Asia Pacific
- 5.6.5 Middle East
- 5.6.5.1 United Arab Emirates
- 5.6.5.2 Saudi Arabia
- 5.6.5.3 Rest of Middle East
- 5.6.6 Africa
- 5.6.6.1 South Africa
- 5.6.6.2 Nigeria
- 5.6.6.3 Rest of Africa
- 5.6.1 North America
6 COMPETITIVE LANDSCAPE
- 6.1 Market Concentration
- 6.2 Strategic Moves
- 6.3 Market Share Analysis
- 6.4 Company Profiles (includes Global Level Overview, Market Level Overview, Core Segments, Financials as Available, Strategic Information, Market Rank/Share for Key Companies, Products and Services, and Recent Developments)
- 6.4.1 Ansys, Inc.
- 6.4.2 Dassault Systemes SE
- 6.4.3 Siemens Digital Industries Software Inc.
- 6.4.4 Altair Engineering Inc.
- 6.4.5 Autodesk, Inc.
- 6.4.6 MSC Software Corporation
- 6.4.7 The MathWorks, Inc.
- 6.4.8 PTC Inc.
- 6.4.9 Synopsys, Inc.
- 6.4.10 ESI Group SA
- 6.4.11 CPFD Software, LLC
- 6.4.12 Rockwell Automation, Inc.
- 6.4.13 Bentley Systems, Incorporated
- 6.4.14 Simio, LLC
- 6.4.15 Lanner Group Ltd
- 6.4.16 SIMUL8 Corporation
- 6.4.17 Flow Science, Inc.
- 6.4.18 COMSOL AB
- 6.4.19 Schneider Electric SE
- 6.4.20 SolidWorks Corporation
7 MARKET OPPORTUNITIES AND FUTURE OUTLOOK
- 7.1 White-Space and Unmet-Need Assessment


