
|
시장보고서
상품코드
2114091
마이크로 모바일 데이터센터 시장 : 시장 점유율 분석, 업계 동향 및 통계, 성장 예측(2026-2031년)Micro Mobile Data Center - Market Share Analysis, Industry Trends & Statistics, Growth Forecasts (2026 - 2031) |
||||||
 Mordor Intelligence
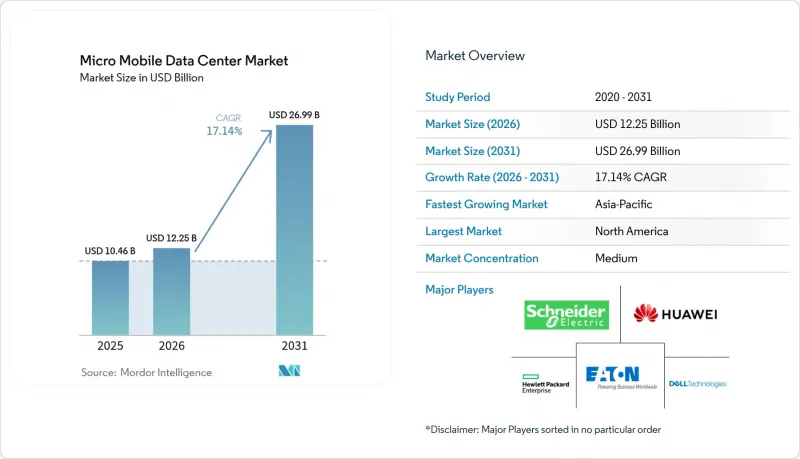
Mordor Intelligence에 의하면, 2026년 마이크로 모바일 데이터센터 시장 규모는 122억 5,000만 달러로 추정되고, 2025년 104억 6,000만 달러에서 확대해, 2031년에는 269억 9,000만 달러에 이를 것으로 예측됩니다.
2026-2031년 연평균 성장률(CAGR) 17.14%로 성장할 것으로 전망됩니다.
본 보고서는 랙 유닛 크기별(25 RU 이하 및 그 이상), 폼 팩터별(컨테이너형 모듈 및 기타), 용도별(인스턴트, 엣지 컴퓨팅 노드 및 기타), 조직 규모별(중소기업 및 기타), 최종 사용자 산업별(IT 및 통신, BFSI 및 기타), 지역별(북미, 유럽 및 기타)로 세분화되어 있습니다. 시장 전망은 금액(달러) 기준으로 제시되어 있습니다.
세계의 마이크로 모바일 데이터센터 시장 동향 및 인사이트
5G 구축에 따른 엣지 컴퓨팅 활성화
5세대 네트워크는 처리량을 10 Gbps까지 향상시키고 지연 시간을 1 ms 미만으로 단축시켰으며, 이로 인해 몰입형 현실, 자율 주행, 산업 자동화 분야에서 중앙 집중식 처리는 더 이상 현실적이지 않게 되었습니다. 따라서 통신 사업자들은 네트워크 기능 가상화(NFV) 및 멀티 액세스 엣지 컴퓨팅(MAEC) 스택을 호스팅하기 위해 셀 사이트의 엣지에 마이크로 모바일 데이터센터 노드를 배치하고 있습니다. 실시간 영상 분석, AR을 활용한 소매점의 피팅룸, 협업형 차량 유도 등이 현재는 로컬에서 실행되게 되어, 전송 비용을 절감하고 결정적인 성능을 보장하고 있습니다. 5G 용량을 수익화하고자 하는 통신 사업자들의 주도하에, 엣지 인프라에 대한 지출은 2024년에 15.4% 증가한 2,320억 달러에 달했습니다.
엔드포인트에서의 IoT 데이터 폭발적 증가
공장, 병원, 거리에 설치된 수십억 개의 스마트 센서는 방대한 양의 텔레메트리 데이터를 생성하고 있지만, 이 모든 데이터를 WAN을 통해 전송하는 것은 불가능합니다. 생산 라인 옆이나 스마트 조명 기둥 내에 설치된 콤팩트하고 견고한 장치 덕분에 알고리즘이 원시 데이터를 추론, 필터링, 압축하고 필요에 따라 클라우드와 동기화할 수 있게 됩니다. 또한, 로컬 처리는 규제가 엄격한 산업 분야의 데이터 주권 및 개인정보 보호 관련 규제 요건도 충족시킵니다. FS.com은 엣지 마이크로사이트가 정책상 체크포인트가 충족될 때까지 기밀성이 높은 페이로드를 온프레미스에 보관함으로써 보안을 강화한다고 지적합니다.
엣지 지원 시설 운영에 따른 인력 부족
분산 배치된 수백 대의 장비를 운영하려면 IT, 전기, 기계 각 분야에 정통한 인력이 필요합니다. 슈나이더 일렉트릭의 오픈 코스웨어에는 2025년까지 230만 명으로 예상되는 데이터센터 인력 수요를 충당하기 위해 100만 명 이상의 학습자가 등록되어 있습니다. 그러나 인력 확보가 더뎌지면서 신흥 시장에서의 확장이 둔화되고 있습니다.
부문 분석
25-40 RU 제품은 마이크로 모바일 데이터센터 시장의 39.45%를 차지했으며, 연평균 성장률(CAGR) 18.6%로 확대될 것으로 예측됩니다. 기업들이 이 크기를 선호하는 이유는 컴퓨팅,전원, 냉각 기능을 하나의 캐비닛에 통합하고 있어 지사 거점에 설치할 수 있을 만큼 컴팩트하면서도, 향후 워크로드 확대에도 대응할 수 있는 충분한 공간을 확보할 수 있기 때문입니다. 델타(Delta)사의 리튬이온 팩을 내장한 컴팩트한 UPS 시스템은 밀도를 높이는 동시에 설치 면적 요건을 줄여줍니다.
25RU 미만의 소형 인클로저는 고속도로 요금소나 해상 석유 시추 설비 등 설치 공간이 제한된 장소에서 그 진가를 발휘하지만, 공기 흐름이나 예비 용량 부족으로 인해 어려움을 겪는 경우가 많습니다. 40 RU를 초과하는 구성은 AI 추론용 GPU 클러스터가 필요한 어그리게이션 계층이나 통신 사업자의 중앙국에서 활용됩니다. 공급업체들은 마이크로 모바일 데이터센터 시장에서 2개의 30 RU 프레임을 쌍으로 운영하여 내결함성과 확장성의 균형을 맞추는 하이브리드 설계가 주류를 이룰 것으로 예상하고 있습니다.
랙 마운트형 포드는 매출의 50.55%를 차지하고 있으며, 기존 서버 인프라와 호환되는 표준화된 깊이와 폭 덕분에 계속해서 주도적인 위치를 유지할 전망입니다. 고객은 포드를 하나씩 확장함으로써 용도 수요에 맞추어 투자 규모를 조정하고 유휴 용량을 줄일 수 있습니다. 슈퍼마이크로의 랙 스케일 아키텍처를 통해 운영자는 NVMe 스토리지를 분해하고, 자원을 현장에서 재구성하여 활용도를 최적화할 수도 있습니다.
컨테이너형 모듈은 행사장이나 원격지 채굴을 위해 신속하고 대용량의 스토리지를 제공합니다. 대부분의 경우, 외부 공기 이용형 이코노마이저를 장착한 상태로 공장 출하 시 밀봉되어 있습니다. 벽걸이형 노드는 바닥 면적이 귀중한 편의점 체인이나 패스트푸드점에 최적입니다. 현재 각 벤더사는 가혹한 현장 환경을 견딜 수 있도록 충격 센서, 먼지 필터, 변조 감지 스위치를 추가하고 있으며, 더 광범위한 마이크로·모바일 데이터센터 시장에서 대응 가능한 워크로드를 확대되고 있습니다.
지역별 분석
북미는 5G의 집중적인 구축, 하이퍼스케일러의 엣지 POP에 대한 투자, 그리고 의료 및 금융 분야의 데이터 주권을 뒷받침하는 법규 덕분에 2025년 총 수익의 34.65%를 차지했습니다. 미국이 시장을 주도하고 있으며, 북부 버지니아, 실리콘 밸리, 텍사스주에서는 메가 스케일 인프라 구축을 보완하는 캠퍼스 인접형 엣지 노드에 대한 수요가 활발합니다. 마이크로 리액터 시범 사업 등 연방 정부 주도의 노력은 전략적 워크로드에 대한 Off-grid 전력 전략을 강조하고 있습니다.
아시아태평양은 중국, 인도, 일본, 한국이 스마트 제조 및 커넥티드 모빌리티 프로그램을 가속화함에 따라 2031년까지 18.1%라는 가장 높은 연평균 성장률(CAGR)을 보일 것으로 전망됩니다. 정부의 보조금 및 주파수 대역 할당을 통해 통신 사업자와 클라우드 제공업체는 실시간 IoT 분석을 위해 근접한 컴퓨팅 환경을 구축하도록 장려받고 있습니다. Vantage사의 사이버자야 제2 캠퍼스와 NTT DATA사의 자카르타 시설은 현지 데이터 거주지 관련 법률을 준수할 수 있는 분산형 모델로의 지역적 전환을 보여주고 있습니다.
유럽에서는 독일, 영국, 프랑스를 필두로 꾸준한 확장이 이어지고 있습니다. 엄격한 GDPR(EU 개인정보보호규정)(일반 데이터 보호 규정) 조항에 따라 현지에서 데이터를 처리해야 하므로, 공장, 병원, 핀테크 기업들은 데이터를 국경을 넘어 전송하는 대신 지역별 클러스터에 투자하고 있습니다. 프랑크푸르트, 런던, 파리에 위치한 이퀴닉스(Equinix)의 IBX 네트워크는 지역 허브와 클라우드 연결 지점을 연결하는 동시에 5밀리초 미만의 엣지 워크로드를 호스팅하고 있습니다. 중동 및 아프리카, 남미에서의 도입은 소규모 기반에서 시작되었지만, 스마트 시티 예산과 5G 회랑 프로젝트에 힘입어 마이크로 모바일 데이터센터 시장공급업체들에게 새로운 시장을 개척하고 있습니다.
기타 혜택 :
- 엑셀 형식 시장 예측(ME) 시트
- 3개월간의 애널리스트 지원
자주 묻는 질문
목차
제1장 서론
제2장 조사 방법
제3장 주요 요약
제4장 시장 구도
제5장 시장 규모 및 성장 예측
제6장 경쟁 구도
제7장 시장 기회 및 향후 전망
AJY 26.08.26According to Mordor Intelligence, micro mobile data center market size in 2026 is estimated at USD 12.25 billion, growing from 2025 value of USD 10.46 billion with 2031 projections showing USD 26.99 billion, growing at 17.14% CAGR over 2026-2031.
This report is Segmented by Rack Unit Size (Up To 25 RU, and More), Form Factor (Containerized Modules, and More), Application (Instant, Edge-Computing Nodes, and More), Organization Size(Small and Medium Enterprises, and More) End-User Industry(IT and Telecom, BFSI, and More) and Geography (North America, Europe, and More). The Market Forecasts are Provided in Terms of Value (USD).
Global Micro Mobile Data Center Market Trends and Insights
Edge-Computing Push from 5G Roll-Outs
Fifth-generation networks are raising throughput to 10 Gbps and pushing latency below 1 ms, making centralized processing impractical for immersive realities, autonomous mobility, and industrial automation. Carriers are therefore co-locating micro mobile data center market nodes at cell-site edges to host network-function virtualization and multi-access edge computing stacks. Real-time video analytics, AR retail fitting rooms, and cooperative vehicle guidance now execute locally, trimming transport costs and guaranteeing deterministic performance. Spending on edge infrastructure jumped 15.4% to USD 232 billion in 2024, spearheaded by telecom operators eager to monetize 5G capacity.
Exponential IoT Data at Endpoints
Billions of smart sensors in factories, hospitals, and city streets churn out torrents of telemetry that cannot all traverse the WAN. Compact, ruggedized enclosures installed beside manufacturing lines or inside smart-lighting poles let algorithms infer, filter, and compress raw feeds before optionally syncing with the cloud. Localized processing also satisfies data-sovereignty and privacy codes in regulated industries. FS.com observes that edge micro sites improve security by retaining sensitive payloads on premises until policy checkpoints are met.
Talent Scarcity in Edge-Qualified Facility Operations
Running hundreds of distributed enclosures demands personnel who grasp IT, electrical, and mechanical disciplines. Schneider Electric's open courseware has enrolled more than 1 million learners to bridge the projected need for 2.3 million data-center staff by 2025. Yet recruitment lags, slowing roll-outs in emerging markets.
Other drivers and restraints analyzed in the detailed report include:
- Rapid Retail Omni-Channel Digitization
- Heightened Resilience Needs After Hyperscaler Outages
- Lithium-Ion Thermal-Runaway Concerns
For complete list of drivers and restraints, kindly check the Table Of Contents.
Segment Analysis
The 25-40 RU accounted for 39.45% of the micro mobile data center market and is forecast to advance at 18.6% CAGR. Enterprises favor this footprint because it bundles compute, power, and cooling in a cabinet that is both compact enough for branch sites and spacious enough to accommodate future workload expansion. Compact UPS systems with integrated lithium-ion packs from Delta boost density while trimming floor-space requirements.
Smaller sub-25 RU enclosures excel in areas where real estate is scarce, such as highway toll booths or offshore rigs, but often struggle with airflow and limited spare capacity. Configurations above 40 RU serve aggregation layers or telecom central offices demanding GPU clusters for AI inference. Suppliers expect hybrid designs, where two 30 RU frames travel as a pair to balance resilience and scalability in the micro mobile data center market.
Rack-mounted pods accounted for 50.55% of revenue and will maintain lead status thanks to standardized depth and width that align with existing server infrastructure. Customers scale one pod at a time, synchronizing cash spend with application demand and shrinking stranded capacity. Supermicro's rack-scale architecture even lets operators disaggregate NVMe storage and recombine resources on the fly to optimize utilization.
Containerized modules deliver rapid bulk capacity for event venues or remote mining, often arriving factory-sealed with outside-air economizers. Wall-mount nodes satisfy convenience-store chains and quick-service restaurants, where floor space is premium. Vendors now add shock sensors, dust filters, and tamper switches to withstand harsh field conditions, expanding addressable workloads across the broader micro mobile data center market.
Complete Report Scope:
- By Rack Unit Size
- Up to 25 RU
- 25 - 40 RU
- Above 40 RU
- By Form Factor
- Containerized Modules
- Rack-Mounted Pods
- Wall-Mounted / Micro-Edge Nodes
- By Application
- Instant / Retrofit Data Center
- Edge-Computing Nodes
- High-Density Networks
- Remote Office and Branch Office
- Mobile and Tactical Computing
- Disaster Recovery and Backup
- By Organization Size
- Small and Medium Enterprises
- Large Enterprises
- By End-user Vertical
- IT and Telecommunication
- BFSI
- Retail and E-commerce
- Healthcare and Life Sciences
- Government and Defense
- Energy and Utilities
- Manufacturing and Industrial
- Education
- By Geography
- North America
- United States
- Canada
- Mexico
- Europe
- United Kingdom
- Germany
- France
- Italy
- Spain
- Netherlands
- Rest of Europe
- Asia-Pacific
- China
- Japan
- India
- South Korea
- Singapore
- Australia
- Malaysia
- Rest of Asia-Pacific
- South America
- Brazil
- Argentina
- Rest of South America
- Middle East and Africa
- Middle East
- UAE
- Saudi Arabia
- Turkey
- Israel
- Rest of Middle East
- Africa
- South Africa
- Nigeria
- Egypt
- Rest of Africa
- Middle East
- North America
Geography Analysis
North America held 34.65% of total revenue in 2025 thanks to dense 5G roll-outs, hyperscaler investment in edge POPs, and supportive data-sovereignty statutes for healthcare and finance. The United States dominates, with Northern Virginia, Silicon Valley, and Texas generating heavy demand for campus-adjacent edge nodes that complement megascale builds. Federal initiatives such as microreactor pilots underscore commitment to off-grid power strategies for strategic workloads.
Asia-Pacific will post the highest 18.1% CAGR to 2031 as China, India, Japan, and South Korea accelerate smart-manufacturing and connected-mobility programs. State grants and spectrum allocations encourage telcos and cloud providers to host proximate compute for real-time IoT analytics. Vantage's second Cyberjaya campus and NTT DATA's Jakarta build illustrate a regional shift toward distributed models capable of respecting local data-residency laws.
Europe continues steady expansion led by Germany, the United Kingdom, and France. Strict GDPR rules require localized processing, so factories, hospitals, and fintechs invest in zone-specific clusters instead of shipping data across borders. Equinix's IBX network in Frankfurt, London, and Paris bridges regional hubs to cloud on-ramps while hosting sub-5 ms edge workloads. Emerging adoption in the Middle East, Africa, and South America starts from smaller bases but is buoyed by smart-city budgets and 5G corridor projects, opening fresh terrain for micro mobile data center market suppliers.
- Schneider Electric SE
- Dell Technologies Inc.
- Huawei Technologies Co. Ltd.
- Hewlett Packard Enterprise Development LP
- Eaton Corporation plc
- Vertiv Holdings Co.
- IBM Corporation
- Panduit Corp.
- Zella DC (formerly Zellabox)
- Hitachi Ltd.
- Instant Data Centers LLC
- Dataracks
- Rittal GmbH and Co. KG
- Canovate Group
- Cisco Systems Inc.
- EdgeMicro Inc.
- Vapor IO Inc.
- Cannon Technologies Ltd.
- nLighten (Iliad Group)
- DC Blox Inc.
Additional Benefits:
- The market estimate (ME) sheet in Excel format
- 3 months of analyst support
TABLE OF CONTENTS
1 INTRODUCTION
- 1.1 Study Assumptions and Market Definition
- 1.2 Scope of the Study
2 RESEARCH METHODOLOGY
3 EXECUTIVE SUMMARY
4 MARKET LANDSCAPE
- 4.1 Market Overview
- 4.2 Market Drivers
- 4.2.1 Edge-computing push from 5G roll-outs
- 4.2.2 Exponential IoT data at endpoints
- 4.2.3 Rapid retail omni-channel digitization
- 4.2.4 Heightened resilience needs after hyperscaler outages
- 4.2.5 Military demand for rugged off-grid compute
- 4.2.6 ESG-driven micro-grid pairing for renewables
- 4.3 Market Restraints
- 4.3.1 Talent scarcity in edge-qualified facility ops
- 4.3.2 Fragmented regulatory codes for modular DCs
- 4.3.3 Lithium-ion thermal-runaway concerns
- 4.3.4 Copper and rare-earth supply-chain volatility
- 4.4 Industry Value Chain Analysis
- 4.5 Regulatory Landscape
- 4.6 Technological Outlook
- 4.7 Porter's Five Forces Analysis
- 4.7.1 Threat of New Entrants
- 4.7.2 Bargaining Power of Buyers
- 4.7.3 Bargaining Power of Suppliers
- 4.7.4 Threat of Substitutes
- 4.7.5 Intensity of Competitive Rivalry
- 4.8 Impact of Macroeconomic Factors on the Market
5 MARKET SIZE AND GROWTH FORECASTS (VALUE)
- 5.1 By Rack Unit Size
- 5.1.1 Up to 25 RU
- 5.1.2 25 - 40 RU
- 5.1.3 Above 40 RU
- 5.2 By Form Factor
- 5.2.1 Containerized Modules
- 5.2.2 Rack-Mounted Pods
- 5.2.3 Wall-Mounted / Micro-Edge Nodes
- 5.3 By Application
- 5.3.1 Instant / Retrofit Data Center
- 5.3.2 Edge-Computing Nodes
- 5.3.3 High-Density Networks
- 5.3.4 Remote Office and Branch Office
- 5.3.5 Mobile and Tactical Computing
- 5.3.6 Disaster Recovery and Backup
- 5.4 By Organization Size
- 5.4.1 Small and Medium Enterprises
- 5.4.2 Large Enterprises
- 5.5 By End-user Vertical
- 5.5.1 IT and Telecommunication
- 5.5.2 BFSI
- 5.5.3 Retail and E-commerce
- 5.5.4 Healthcare and Life Sciences
- 5.5.5 Government and Defense
- 5.5.6 Energy and Utilities
- 5.5.7 Manufacturing and Industrial
- 5.5.8 Education
- 5.6 By Geography
- 5.6.1 North America
- 5.6.1.1 United States
- 5.6.1.2 Canada
- 5.6.1.3 Mexico
- 5.6.2 Europe
- 5.6.2.1 United Kingdom
- 5.6.2.2 Germany
- 5.6.2.3 France
- 5.6.2.4 Italy
- 5.6.2.5 Spain
- 5.6.2.6 Netherlands
- 5.6.2.7 Rest of Europe
- 5.6.3 Asia-Pacific
- 5.6.3.1 China
- 5.6.3.2 Japan
- 5.6.3.3 India
- 5.6.3.4 South Korea
- 5.6.3.5 Singapore
- 5.6.3.6 Australia
- 5.6.3.7 Malaysia
- 5.6.3.8 Rest of Asia-Pacific
- 5.6.4 South America
- 5.6.4.1 Brazil
- 5.6.4.2 Argentina
- 5.6.4.3 Rest of South America
- 5.6.5 Middle East and Africa
- 5.6.5.1 Middle East
- 5.6.5.1.1 UAE
- 5.6.5.1.2 Saudi Arabia
- 5.6.5.1.3 Turkey
- 5.6.5.1.4 Israel
- 5.6.5.1.5 Rest of Middle East
- 5.6.5.2 Africa
- 5.6.5.2.1 South Africa
- 5.6.5.2.2 Nigeria
- 5.6.5.2.3 Egypt
- 5.6.5.2.4 Rest of Africa
- 5.6.5.1 Middle East
- 5.6.1 North America
6 COMPETITIVE LANDSCAPE
- 6.1 Market Concentration
- 6.2 Strategic Moves
- 6.3 Market Share Analysis
- 6.4 Company Profiles (includes Global level Overview, Market level overview, Core Segments, Financials as available, Strategic Information, Market Rank/Share for key companies, Products and Services, and Recent Developments)
- 6.4.1 Schneider Electric SE
- 6.4.2 Dell Technologies Inc.
- 6.4.3 Huawei Technologies Co. Ltd.
- 6.4.4 Hewlett Packard Enterprise Development LP
- 6.4.5 Eaton Corporation plc
- 6.4.6 Vertiv Holdings Co.
- 6.4.7 IBM Corporation
- 6.4.8 Panduit Corp.
- 6.4.9 Zella DC (formerly Zellabox)
- 6.4.10 Hitachi Ltd.
- 6.4.11 Instant Data Centers LLC
- 6.4.12 Dataracks
- 6.4.13 Rittal GmbH and Co. KG
- 6.4.14 Canovate Group
- 6.4.15 Cisco Systems Inc.
- 6.4.16 EdgeMicro Inc.
- 6.4.17 Vapor IO Inc.
- 6.4.18 Cannon Technologies Ltd.
- 6.4.19 nLighten (Iliad Group)
- 6.4.20 DC Blox Inc.
7 MARKET OPPORTUNITIES AND FUTURE OUTLOOK
- 7.1 White-space and Unmet-Need Assessment