

|
시장보고서
상품코드
2114146
IoT 센서 시장 : 시장 점유율 분석, 업계 동향 및 통계, 성장 예측(2026-2031년)IoT Sensor - Market Share Analysis, Industry Trends & Statistics, Growth Forecasts (2026 - 2031) |
||||||
 Mordor Intelligence
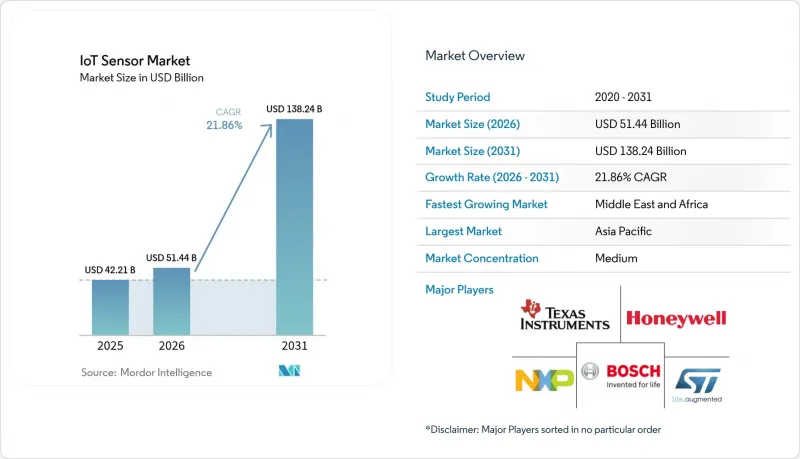
Mordor Intelligence에 의하면, 2026년 IoT 센서 시장 규모는 514억 4,000만 달러로 추정되고, 2025년 422억 1,000만 달러에서, 2031년에는 1,382억 4,000만 달러에 이를 것으로 예측됩니다.
2026-2031년 연평균 성장률(CAGR)은 21.86%를 나타낼 전망입니다.
본 보고서는 센서 유형별(압력 센서, 온도 센서 등), 기술별(MEMS, 광학식 등), 연결 방식별(유선, 무선(Wi-Fi 등)), 전원별(배터리 구동, 에너지 수확 등), 최종 사용자별(자동차 및 운송, 헬스케어 등), 용도 및 지역별로 분류되어 있습니다. 시장 전망은 금액(달러) 기준으로 제시되어 있습니다.
세계의 IoT 센서 시장 동향 및 인사이트
유럽의 개별 생산 산업 분야에서 엣지 분석을 가능하게 하는 저전력 MEMS 기반 멀티모달 센서가 빠르게 보급되고 있습니다.
유럽의 각 제조업체들은 멀티모달 MEMS 센서를 기기에 직접 내장하여 현장에서 진동, 온도, 소리, 압력을 분석했습니다. TDK의 ‘i3 마이크로 모듈’은 고장 발생 전에 이상을 예측하는 AI 코어를 통합하고 있습니다. Bosch Sensortec의 ‘BHI360’ 제품군은 600µA 미만의 전력 소비로 제스처 및 3D 오디오 기능을 구현하며, 레거시 라인 개조 시 네트워크 트래픽을 80% 절감합니다. 이러한 엣지 디바이스를 활용한 예측 유지보수 프로그램을 통해 독일 및 이탈리아의 공장에서 비용을 25% 절감하고 자산 수명을 20-30% 연장할 수 있었다고 보고되고 있습니다.
북미 및 인도의 차량 텔레매틱스 규제 의무화로 인해 자동차용 관성/압력 센서 수요가 확대되고 있습니다.
미국의 ‘SmartWay’ 현대화 계획과 인도의 상용차 추적 규정에 따라 차량 운영 사업자는 실시간 차량 데이터를 수집해야 할 의무가 있습니다. 텍사스 기기의 AWR1843AOP 레이더는 DSP 및 MCU 블록을 통합하여 보고 및 안전 요건을 충족할 뿐만 아니라, 첨단 운전자 지원 시스템(ADAS)도 지원합니다. 물류 기업들이 예측 유지보수 일정으로 전환함에 따라 채택이 확대되고 있으며, 멀티 센서 어레이에 대한 수요가 증가하고 있습니다.
200mm MEMS 파운드리 생산 능력 부족으로 자동차용 관성 센서 공급 제한
세계 반도체 제조 업계는 200mm MEMS 파운드리에서 심각한 생산 능력 제약에 직면하고 있어, 첨단 운전자 보조 시스템 및 자율주행차 개발에 필요한 자동차용 관성 센서 공급 병목 현상이 발생하고 있습니다. SEMI 보고서에 따르면, 전 세계 반도체 팹 생산 능력 증가율은 2024년 6%, 2025년 7%로 예측되지만, 자동차용 센서 수요는 연간 25% 이상의 속도로 증가하고 있어 수급 불균형이 지속되고 있습니다. 이러한 공급 부족은 특히 특수한 패키징이나 광범위한 온도 범위가 필요한 자동차용 관성 센서에 영향을 미치고 있으며, 이러한 제품의 인증 주기는 표준 소비자용 용도에 비해 18-24개월 더 길어질 수 있습니다. X-FAB 파운드리사가 자동차 및 산업 용도를 대상으로 진행 중인 10억 달러 규모의 확장 계획은 생산 능력 제약에 대처하기 위한 업계 전반의 노력을 상징하지만, 일반적으로 신규 팹의 생산 능력이 완전 가동 상태에 도달하기까지는 2-3년이 소요됩니다.
부문 분석
이미지 센서는 연평균 성장률(CAGR) 27.78%로 성장을 지속하고 있으며, 2031년까지 압력 센서의 기여율 17.94%를 넘어설 것으로 예측됩니다. 자율주행차와 AI를 활용한 검사 시스템이 시제품 단계에서 양산 라인으로 전환됨에 따라, 이미지 기반 디바이스를 위한 IoT 센서 시장 규모는 확대되고 있습니다. 각 자동차 제조업체는 센서 융합을 위해 고동적 범위(HDR) CMOS 이미저를 관성 측정 장치와 통합하여 복잡한 도시 교통 환경에서 안전한 주행을 보장하고 있습니다. 산업용 사용자들은 신경망 추론을 로컬에서 실행하는 스마트 카메라를 도입함으로써 대역폭 비용을 절감하고 지적 재산(IP)을 보호하고 있습니다. 한편, 압력 센서는 공압 장비, HVAC(냉난방·환기·공조),공정 자동화 분야에서 여전히 필수적인 요소로 자리 잡고 있어 안정적인 수요를 유지하고 있습니다. 두 카테고리 모두에서 각 벤더들은 연결된 기계의 사이버 보안 요건을 충족하기 위해 마이크로컨트롤러와 보안 엔클레이브를 탑재하고 있습니다.
온도, 모션, 근접 센서의 두 번째 물결은 웨어러블 기기 및 협동 로봇을 목표로 하고 있습니다. 임베디드 AI 루틴은 제스처나 미세한 움직임을 인식하여 사용자 인터페이스를 강화합니다. 화학 및 가스 센서는 교정 드리프트라는 과제에 직면해 있지만, 대기질 규제의 강화와 연료전지차의 수소 누출 감지 수요로 인해 성장은 유지되고 있습니다. 관성 센서 및 자기 센서는 전기차의 모터 제어와 산업용 액추에이터의 정밀한 위치 피드백을 지원하며, IoT 센서 시장에서 그 입지를 공고히 하고 있습니다.
MEMS는 2025년에도 매출의 42.15%를 차지했으며, 비용 효율이 뛰어난 웨이퍼 레벨 패키징을 통해 IoT 센서 시장에서의 점유율을 공고히 하고 있습니다. 한편, LiDAR 및 구조화된 광 시스템을 필두로 하는 광학 기술은 연평균 25.48%의 성장률을 기록하고 있습니다. MEMS 파운드리에서는 현재 광학 변조기와 관성 소자를 공동 패키징하여, 하나의 소켓에서 거리 측정 데이터와 방위 데이터를 제공하는 하이브리드 모듈을 실현하고 있습니다. CMOS 이미저는 성숙한 소비자용 부문에서 포화 상태에 이르렀지만, 스마트폰 및 블랙박스 교체 주기에서는 여전히 핵심적인 위치를 차지하고 있습니다. 전기화학 센서는 현장 진단(Point-of-Care) 분야에서 확고한 입지를 유지하고 있습니다. 설계자들이 진동 에너지를 이용하여 서브 밀리와트급 센서 클러스터에 전력을 공급하기 시작하면서, 압전식 에너지 하베스터가 다시 주목을 받고 있습니다.
소재 기술의 혁신도 급속히 진행되고 있습니다. 인피니언(Infineon)의 그래핀 기반 홀 소자는 실리콘 제품 대비 100배의 감도를 실현하여, 로봇 공학 분야에서 초저자기장 감지를 가능하게 하고 있습니다. 패키징 기술의 발전으로 GTSV(Glass-Through-Silicon Via)와 플립 칩을 결합함으로써 실적를 축소하면서도 열전도성을 향상시켜, 자동차 용도의 극한 온도 환경에서도 높은 신뢰성을 유지하고 있습니다.
지역별 분석
2025년에는 아시아태평양이 매출의 32.55%를 차지하며 시장을 주도했습니다. 중국의 ‘산업용 인터넷 혁신·발전 행동 계획’에서는 고속 기기의 연동을 위해 센서 그리드가 도입된 반면, 일본의 민간 5G 주파수 대역 할당은 스마트 팩토리에서의 결정론적 통신을 뒷받침하고 있습니다. 한국은 선진적인 반도체 제조 공정을 활용하여 지역 OEM 제조업체에 대한 공급 안정성을 확보하고 있습니다. 인도에서는 상용차에 텔레매틱스 탑재가 의무화되어 있어 관성 센서 및 환경 센서에 대한 수요가 급속히 확대되고 있습니다. 호주의 광업 부문에서는 폭발성 환경에서 사용이 인증된 견고한 장치가 요구되고 있어, IoT 센서 시장 내에 특수한 틈새 시장이 형성되고 있습니다.
북미는 ‘CHIPS and Science Act(CHIPS·과학법)’의 혜택을 받고 있습니다. 텍사스 기기는 3개의 300mm 팹을 건설하기 위해 16억 달러를 확보하여 국내 센서 생산 능력을 강화했습니다. 이 지역에서는 사이버 보안이 중시되고 있어, 공급업체에 대해 보안 부팅, 암호화 및 무선 업데이트 기능의 통합이 요구되고 있습니다. 캐나다는 산불 위험을 모니터링하기 위한 환경 센싱에 투자하고 있는 반면, 멕시코의 자동차 클러스터에서는 비용 경쟁력이 있는 안전 센서가 요구되고 있습니다.
유럽에서는 엄격한 배기가스 규제 및 안전 기준이 시행되고 있습니다. 독일의 주요 디스크리트 제조업체들은 AI 지원 MEMS 모듈을 도입하여 불량률 감축에 힘쓰고 있습니다. 프랑스는 이산화탄소 배출 감축을 위해 스마트 조명 및 교통 관리에 투자하고 있습니다. 북유럽의 해상 풍력 발전소에서는 영하 온도의 바다에서 터빈에 가해지는 응력을 관리하기 위해 에너지 수확형 센서의 도입이 진행되고 있습니다. EU의 ‘사이버 복원력 법’에 따라 공급업체는 소프트웨어 구동형 센서의 인증 취득이 의무화되어 있으며, 설계의 복잡성은 증가하고 있지만 구매자의 신뢰는 높아지고 있습니다.
기타 혜택 :
- 엑셀 형식 시장 예측(ME) 시트
- 3개월간의 애널리스트 지원
자주 묻는 질문
목차
제1장 서론
제2장 시장 구도
제3장 시장 규모 및 성장 예측
제4장 경쟁 구도
제5장 시장 기회 및 향후 전망
AJY 26.08.26According to Mordor Intelligence, ioT sensors market size in 2026 is estimated at USD 51.44 billion, growing from 2025 value of USD 42.21 billion with 2031 projections showing USD 138.24 billion, growing at 21.86% CAGR over 2026-2031.
This report is Segmented by Sensor Type (Pressure Sensors, Temperature Sensors, and More), Technology (MEMS, Optical, and More), Connectivity (Wired, Wireless - Wi-Fi, and More), Power Source (Battery-Powered, Energy-harvesting, and More), End User (Automotive and Transportation, Healthcare, and More), Application, and Geography. The Market Forecasts are Provided in Terms of Value (USD).
Global IoT Sensor Market Trends and Insights
Rapid adoption of low-power MEMS-based multimodal sensors enabling edge analytics in European discrete manufacturing
European manufacturers embed multimodal MEMS sensors directly in equipment to analyze vibration, temperature, sound, and pressure on-site. TDK's i3 Micro Module integrates an AI core that predicts anomalies before breakdowns. Bosch Sensortec's BHI360 family executes gesture and 3D-audio functions in under 600 µA, cutting network traffic 80% while retrofitting legacy lines. Predictive maintenance programs using these edge devices report 25% cost savings and extend asset life 20-30% across German and Italian plants.
Mandated fleet-telematics regulations in North America and India boosting automotive inertial/pressure sensor demand
The U.S. SmartWay modernization and India's commercial-vehicle tracking rules oblige fleets to capture real-time vehicle data. Texas Instruments' AWR1843AOP radar integrates DSP and MCU blocks to meet reporting and safety needs while supporting advanced driver assistance. Adoption is scaling as logistics firms shift to predictive maintenance scheduling, raising unit demand for multi-sensor arrays.
200mm MEMS-Foundry Capacity Shortage Limiting Automotive-Grade Inertial Sensor Supply
Global semiconductor manufacturing faces acute capacity constraints in 200mm MEMS foundries, creating supply bottlenecks for automotive-grade inertial sensors required for advanced driver assistance systems and autonomous vehicle development. SEMI reports indicate global semiconductor fab capacity expansion of 6% in 2024 and 7% in 2025, yet automotive sensor demand is growing at rates exceeding 25% annually, creating persistent supply-demand imbalances. The shortage particularly affects automotive inertial sensors requiring specialized packaging and extended temperature ranges, where qualification cycles can extend 18-24 months beyond standard consumer applications. X-FAB Silicon Foundries' USD 1 billion expansion targeting automotive and industrial applications represents industry efforts to address capacity constraints, though new fab capacity typically requires 2-3 years to reach full production.
Other drivers and restraints analyzed in the detailed report include:
- Battery-less energy-harvesting sensor nodes for predictive maintenance in offshore wind farms
- Private 5G networks in Japanese smart factories requiring time-synchronized image sensors
- Calibration drift in long-lifecycle chemical sensors restricting pharma cold-chain adoption
For complete list of drivers and restraints, kindly check the Table Of Contents.
Segment Analysis
Image sensors drove a 27.78% CAGR and are forecast to eclipse pressure sensors' 17.94 % contribution by 2031. The IoT sensors market size for image-based devices is widening as autonomous vehicles and AI-powered inspection systems migrate from prototypes to volume lines. Automotive OEMs integrate high-dynamic-range CMOS imagers with inertial units for sensor fusion, ensuring safe navigation in complex urban traffic. Industrial users deploy smart cameras that execute neural-network inference locally, eliminating bandwidth costs and protecting IP. Meanwhile, pressure sensors remain staples in pneumatics, HVAC, and process automation, sustaining steady demand. Across both categories, vendors embed micro-controllers and security enclaves to meet cybersecurity mandates in connected machinery.
A second wave of temperature, motion, and proximity sensors targets wearables and collaborative robots. Embedded AI routines recognise gestures and micro-movements, enriching user interfaces. Chemical and gas sensors confront calibration-drift hurdles, yet tightening air-quality rules and hydrogen-leak detection in fuel-cell vehicles preserve growth. Inertial and magnetic sensors underpin electric-vehicle motor control and precise positional feedback in industrial actuators, cementing their role within the IoT sensors market.
MEMS retained 42.15% revenue in 2025, anchoring the IoT sensors market share through cost-effective wafer-level packaging. Yet optical techniques, led by LiDAR and structured-light systems, are growing 25.48% annually. MEMS foundries now co-package optical modulators and inertial elements, enabling hybrid modules that deliver ranging and orientation data from one socket. CMOS imagers saturate mature consumer segments but remain core to smartphone and dash-cam refresh cycles. Electrochemical sensors maintain footholds in point-of-care diagnostics. Piezoelectric harvesters re-emerge as designers tap vibration energy to power sub-milliwatt sensor clusters.
Materials innovation is brisk: Infineon's graphene-based Hall device achieves 100-times sensitivity over silicon peers, unlocking ultra-low field detection for robotics. Packaging advances combine glass-through-silicon vias with flip-chip to compress footprint while improving heat transfer, sustaining high reliability in automotive temperature extremes.
Complete Report Scope:
- By Sensor Type
- Pressure Sensors
- Temperature Sensors
- Motion and Proximity Sensors
- Chemical and Gas Sensors
- Humidity Sensors
- Image Sensors
- Inertial Sensors (Accelerometer, Gyroscope)
- Magnetic Sensors
- Optical and Light Sensors
- Level and Flow Sensors
- By Technology
- MEMS
- CMOS
- Optical
- Electrochemical
- Magnetic
- Piezoelectric and Others
- By Connectivity
- Wired (Ethernet, Modbus, CAN)
- Wireless WiFi
- Wireless Bluetooth/BLE
- Wireless Zigbee/Z-Wave
- Wireless LoRaWAN/Sigfox
- Wireless Cellular (2G, 5G, NB-IoT)
- RFID/NFC
- By Power Source
- Battery-Powered
- Energy-Harvesting (Thermal, Vibration, RF)
- Powered-over-Ethernet and Wired Power
- By End-Use Industry
- Manufacturing and Industrial Automation
- Automotive and Transportation
- Healthcare and Medical Devices
- Consumer Electronics and Wearables
- Smart Home and Building Automation
- Energy and Utilities (Oil and Gas, Smart Grid)
- Agriculture and Environmental Monitoring
- Logistics and Supply Chain (Cold-chain, Asset Tracking)
- Smart City Infrastructure
- Defense and Security
- By Application (Deep-Dive)
- Predictive Maintenance
- Condition Monitoring
- Structural Health Monitoring
- Human-Machine Interface
- Ambient Sensing
- By Geography
- North America
- United States
- Canada
- Mexico
- South America
- Brazil
- Argentina
- Rest of South America
- Europe
- Germany
- United Kingdom
- France
- Italy
- Spain
- Nordics (Sweden, Norway, Denmark, Finland)
- Benelux (Belgium, Netherlands, Luxembourg)
- Middle East
- Saudi Arabia
- United Arab Emirates
- Israel
- Turkey
- Africa
- South Africa
- Nigeria
- Kenya
- Rest of Africa
- Asia
- China
- Japan
- India
- South Korea
- ASEAN (Singapore, Malaysia, Thailand, Indonesia, Philippines, Vietnam)
- North America
Geography Analysis
Asia-Pacific led with 32.55% revenue in 2025. China's "Industrial Internet Innovation and Development Action Plan" installs sensor grids for high-speed equipment coordination, while Japan's private 5G allocations underwrite deterministic communication in smart factories. South Korea capitalizes on advanced semiconductor processes, anchoring supply security for regional OEMs. India mandates fleet telematics across commercial vehicles, rapidly scaling demand for inertial and environmental sensors. Australia's mining sector requires rugged devices certified for explosive atmospheres, creating specialized niches within the IoT sensors market.
North America benefits from the CHIPS and Science Act. Texas Instruments secured USD 1.6 billion to build three 300 mm fabs, bolstering domestic sensor capacity. The region emphasizes cybersecurity, pushing suppliers to integrate secure-boot, encryption, and over-the-air update capabilities. Canada invests in environmental sensing to monitor forest-fire risk, while Mexico's automotive clusters demand cost-competitive safety sensors.
Europe enforces strict emissions and safety standards. Germany's discrete-manufacturing champions deploy AI-enabled MEMS modules to cut scrap rates. France invests in smart lighting and traffic management for carbon reduction. Nordic offshore wind farms cultivate energy-harvesting sensor deployments to manage turbine stress in sub-zero seas. The EU Cyber Resilience Act compels suppliers to certify software-driven sensors, increasing design complexity yet raising buyer confidence.
- Bosch Sensortec GmbH
- Honeywell International Inc.
- STMicroelectronics N.V.
- Texas Instruments Inc.
- NXP Semiconductors N.V.
- TE Connectivity Ltd.
- Sensata Technologies Holding plc
- Analog Devices Inc.
- Infineon Technologies AG
- Qualcomm Inc.
- Sony Group Corp.
- AMS-OSRAM AG
- Murata Manufacturing Co. Ltd.
- Panasonic Holdings Corp.
- ABB Ltd.
- Schneider Electric SE
- Siemens AG
- Semtech Corp.
- Sensirion AG
- Omron Corporation
Additional Benefits:
- The market estimate (ME) sheet in Excel format
- 3 months of analyst support
TABLE OF CONTENTS
1 INTRODUCTION
- 1.1 Study Assumptions and Market Definition
- 1.2 Scope of the Study
- 1.3 Research Methodology
- 1.4 Executive Summary
2 MARKET LANDSCAPE
- 2.1 Market Overview
- 2.2 Market Drivers
- 2.2.1 Rapid adoption of low-power MEMS-based multimodal sensors in Euro manufacturing
- 2.2.2 Mandated fleet-telematics regs in North America and India
- 2.2.3 Battery-less energy-harvesting nodes in Offshore Wind (Nordics and UK)
- 2.2.4 Private 5G factory networks in Japan requiring image sensors
- 2.2.5 Smart-water-meter rollouts in Middle-East boosting ultrasonic-flow uptake
- 2.2.6 Rapid adoption of LoRaWAN/Sigfox LPWANs enabling scalable industrial IoT
- 2.3 Market Restraints
- 2.3.1 200 mm MEMS-foundry shortage limiting automotive sensor supply
- 2.3.2 Calibration drift in chemical sensors hindering pharma adoption
- 2.3.3 Cyber-physical attack concerns delaying smart-grid in Latin-America
- 2.3.4 Divergent RF-certification costs inflating multi-protocol module costs
- 2.4 Value / Supply-Chain Analysis
- 2.5 Technological Outlook
- 2.6 Regulatory Outlook
- 2.7 Investment Analysis
- 2.8 Porter's Five Forces
- 2.8.1 Bargaining Power of Suppliers
- 2.8.2 Bargaining Power of Consumers
- 2.8.3 Threat of New Entrants
- 2.8.4 Intensity of Competitive Rivalry
- 2.8.5 Threat of Substitutes
3 MARKET SIZE AND GROWTH FORECASTS (VALUE)
- 3.1 By Sensor Type
- 3.1.1 Pressure Sensors
- 3.1.2 Temperature Sensors
- 3.1.3 Motion and Proximity Sensors
- 3.1.4 Chemical and Gas Sensors
- 3.1.5 Humidity Sensors
- 3.1.6 Image Sensors
- 3.1.7 Inertial Sensors (Accelerometer, Gyroscope)
- 3.1.8 Magnetic Sensors
- 3.1.9 Optical and Light Sensors
- 3.1.10 Level and Flow Sensors
- 3.2 By Technology
- 3.2.1 MEMS
- 3.2.2 CMOS
- 3.2.3 Optical
- 3.2.4 Electrochemical
- 3.2.5 Magnetic
- 3.2.6 Piezoelectric and Others
- 3.3 By Connectivity
- 3.3.1 Wired (Ethernet, Modbus, CAN)
- 3.3.2 Wireless WiFi
- 3.3.3 Wireless Bluetooth/BLE
- 3.3.4 Wireless Zigbee/Z-Wave
- 3.3.5 Wireless LoRaWAN/Sigfox
- 3.3.6 Wireless Cellular (2G, 5G, NB-IoT)
- 3.3.7 RFID/NFC
- 3.4 By Power Source
- 3.4.1 Battery-Powered
- 3.4.2 Energy-Harvesting (Thermal, Vibration, RF)
- 3.4.3 Powered-over-Ethernet and Wired Power
- 3.5 By End-Use Industry
- 3.5.1 Manufacturing and Industrial Automation
- 3.5.2 Automotive and Transportation
- 3.5.3 Healthcare and Medical Devices
- 3.5.4 Consumer Electronics and Wearables
- 3.5.5 Smart Home and Building Automation
- 3.5.6 Energy and Utilities (Oil and Gas, Smart Grid)
- 3.5.7 Agriculture and Environmental Monitoring
- 3.5.8 Logistics and Supply Chain (Cold-chain, Asset Tracking)
- 3.5.9 Smart City Infrastructure
- 3.5.10 Defense and Security
- 3.6 By Application (Deep-Dive)
- 3.6.1 Predictive Maintenance
- 3.6.2 Condition Monitoring
- 3.6.3 Structural Health Monitoring
- 3.6.4 Human-Machine Interface
- 3.6.5 Ambient Sensing
- 3.7 By Geography
- 3.7.1 North America
- 3.7.1.1 United States
- 3.7.1.2 Canada
- 3.7.1.3 Mexico
- 3.7.2 South America
- 3.7.2.1 Brazil
- 3.7.2.2 Argentina
- 3.7.2.3 Rest of South America
- 3.7.3 Europe
- 3.7.3.1 Germany
- 3.7.3.2 United Kingdom
- 3.7.3.3 France
- 3.7.3.4 Italy
- 3.7.3.5 Spain
- 3.7.3.6 Nordics (Sweden, Norway, Denmark, Finland)
- 3.7.3.7 Benelux (Belgium, Netherlands, Luxembourg)
- 3.7.4 Middle East
- 3.7.4.1 Saudi Arabia
- 3.7.4.2 United Arab Emirates
- 3.7.4.3 Israel
- 3.7.4.4 Turkey
- 3.7.5 Africa
- 3.7.5.1 South Africa
- 3.7.5.2 Nigeria
- 3.7.5.3 Kenya
- 3.7.5.4 Rest of Africa
- 3.7.6 Asia
- 3.7.6.1 China
- 3.7.6.2 Japan
- 3.7.6.3 India
- 3.7.6.4 South Korea
- 3.7.6.5 ASEAN (Singapore, Malaysia, Thailand, Indonesia, Philippines, Vietnam)
- 3.7.1 North America
4 COMPETITIVE LANDSCAPE
- 4.1 Market Concentration
- 4.2 Strategic Moves
- 4.3 Market Share Analysis
- 4.4 Company Profiles
- 4.4.1 Bosch Sensortec GmbH
- 4.4.2 Honeywell International Inc.
- 4.4.3 STMicroelectronics N.V.
- 4.4.4 Texas Instruments Inc.
- 4.4.5 NXP Semiconductors N.V.
- 4.4.6 TE Connectivity Ltd.
- 4.4.7 Sensata Technologies Holding plc
- 4.4.8 Analog Devices Inc.
- 4.4.9 Infineon Technologies AG
- 4.4.10 Qualcomm Inc.
- 4.4.11 Sony Group Corp.
- 4.4.12 AMS-OSRAM AG
- 4.4.13 Murata Manufacturing Co. Ltd.
- 4.4.14 Panasonic Holdings Corp.
- 4.4.15 ABB Ltd.
- 4.4.16 Schneider Electric SE
- 4.4.17 Siemens AG
- 4.4.18 Semtech Corp.
- 4.4.19 Sensirion AG
- 4.4.20 Omron Corporation
5 MARKET OPPORTUNITIES AND FUTURE OUTLOOK
- 5.1 White-space and Unmet-Need Assessment


