

|
시장보고서
상품코드
2114175
IoT 데이터 관리 : 시장 점유율 분석, 업계 동향 및 통계, 성장 예측(2026-2031년)IoT Data Management - Market Share Analysis, Industry Trends & Statistics, Growth Forecasts (2026 - 2031) |
||||||
 Mordor Intelligence
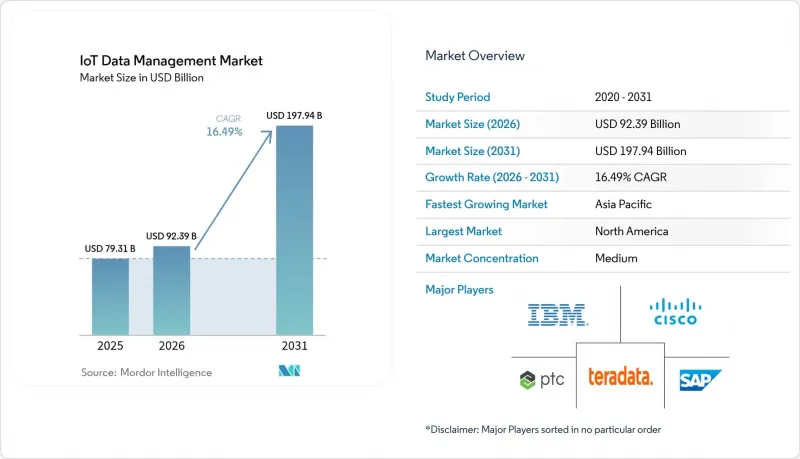
Mordor Intelligence에 의하면, 2026년 IoT 데이터 관리 시장 규모는 923억 9,000만 달러로 추정되고 2025년 793억 1,000만 달러에서 확대해, 2031년에는 1,979억 4,000만 달러에 이를 것으로 예측됩니다.
2026년부터 2031년까지의 연평균 성장률(CAGR)은 16.49%를 나타낼 전망입니다.
본 보고서는 솔루션(통합, 마이그레이션, 분석 등), 배포 모델(클라우드, On-Premise, 하이브리드), 데이터 유형(구조화, 반구조화, 비구조화, 시계열), 최종 사용자 산업(농업, BFSI 등), 용도(예지보수, 스마트 계량,스마트 그리드 분석 등) 및 지역별로 분류되어 있습니다. 시장 전망은 금액(달러) 기준으로 제시되어 있습니다.
세계의 IoT 데이터 관리 시장 동향 및 인사이트
연결 기기의 급증으로 데이터 양 증가 가속화
현재 산업 플랜트에서는 라인당 수천 개의 센서가 도입되어 있으며, 기존 데이터 저장소로는 처리할 수 없는 테라바이트 규모의 텔레메트리 데이터가 생성되고 있습니다. 보쉬(Bosch)는 데이터 파이프라인의 오케스트레이션을 자동화하여 AI 도입 주기를 수개월에서 수주일로 단축했으나, 이는 센서 증가에 따른 확장성 문제를 여실히 드러내고 있습니다. 의료 분야에서도 유사한 급증 현상이 나타나고 있으며, 원격 환자 모니터가 지속적으로 생체 데이터를 스트리밍하기 때문에 HIPAA를 준수하는 저지연 스토리지가 필요합니다. 데이터의 속도와 다양성으로 인한 압박으로 인해, 기업들은 엣지와 클라우드의 데이터를 1초 미만의 시간 창 내에서 동기화하는 ‘스트림 퍼스트’이자 ‘시계열 네이티브’ 아키텍처로 전환해야 할 필요성에 직면해 있습니다.
클라우드 네이티브 데이터 레이크 및 분석의 성숙도
컨테이너화 및 서버리스화된 데이터 레이크 패턴은 데이터 수집이 최고조에 달할 때 자동 스케일링을 수행하여, 기존의 용량 계획에서 발생하던 병목 현상을 해소합니다. 2025년 6월에 출시된 Snowflake의 ‘Openflow’는 AI 프로토타이핑을 가속화하는 마찰 없는 크로스 클라우드 데이터 마이그레이션을 실현합니다. 내장된 ML 파이프라인은 데이터 레이크 환경 내에서 직접 실행되므로 비용이 많이 드는 ETL 공정을 피하고, 데이터 계보, 암호화, 세분화된 액세스 권한을 통해 거버넌스를 강화하고 있습니다.
표준의 파편화와 상호운용성 격차
프로토콜의 비표준화로 인해 기업들은 맞춤형 미들웨어를 구축할 수밖에 없으며, 그 결과 유지보수 비용이 증가하고 도입이 지연되고 있습니다. 레거시 산업용 장비는 최신 IoT 플랫폼과 통신하기 위해 변환 계층이 필요하기 때문에 복잡성을 더욱 가중시키고 있습니다. 독자적인 사양의 데이터 모델은 벤더 종속성을 강화하며, 팀이 병행하여 관리해야 하는 카탈로그와 리니지 추적 시스템이라는 부담을 가중시켜 생산성을 저하시키고 위험을 높입니다.
부문별 분석
2025년, IoT 데이터 관리 시장에서 기업들이 원시 데이터 수집에서 실행 가능한 인사이트력 창출로 초점을 전환함에 따라, 애널리틱스 분야는 매출액 기준 36.42%의 선두를 유지했습니다. 이상 현상 가시화, 자산 활용도 최적화, 예측 알고리즘에 대한 데이터 공급과 같은 요구 사항이 분석 도입을 뒷받침하는 동시에, 현장 직원들에게도 인사이트를 폭넓게 공유하는 통합 대시보드의 보급을 촉진했습니다.
스트림 처리는 연평균 성장률(CAGR) 16.86%가 예상되며, 이는 제조, 의료, 모빌리티 분야에서 지속적인 의사결정 루프로의 결정적인 전환을 반영합니다. 테라데이터는 2025년 3월, 기존 분석과 생성 모델을 통합하는 AI 지원 워크로드를 강화하기 위해 통합형 엔터프라이즈 벡터 스토어를 출시했습니다. 보안, 메타데이터 관리, 시계열 데이터에 최적화된 스토리지를 통해 플랫폼에 대한 정착도가 깊어졌으며, 풀스택 제품군이 기업 내 기본 선택지로서의 입지를 확고히 하고 있습니다.
클라우드는 무한한 확장성과 운영 비용(OPEX)을 고려한 가격 정책 덕분에 2025년에도 70.35%라는 압도적인 점유율을 유지했으며, IoT 데이터 관리 시장 전체에서 AI 집약형 워크로드를 위한 탄력적인 컴퓨팅을 제공합니다. 그러나 데이터 주권에 관한 규제나 지연 시간에 민감한 이용 사례로 인해 일부 워크로드는 On-Premise에서 계속 운영될 것이므로, 하이브리드 구성은 연평균 성장률(CAGR) 17.12%를 나타낼 전망입니다.
기업에서는 고빈도 데이터를 엣지에서 처리하고, 집계된 분석 결과를 클라우드 레이크로 전송하여 기업 보고서를 작성하는 사례가 증가하고 있습니다. 히타치 반타라의 ‘EverFlex with Cisco Powered Hybrid Cloud’는 IaaS부터 Containers-as-a-Service에 이르기까지 유연한 구독 형식으로 제공되는 온디맨드형 인프라를 특징으로 합니다. 엣지 오케스트레이션과 중앙 집중형 거버넌스의 융합을 통해 비용, 규정 준수, 성능 목표를 모두 달성할 수 있는 새로운 도입 패턴이 가능해집니다.
지역별 분석
북미는 하이퍼스케일러 생태계, 풍부한 데이터 사이언스 인력, 그리고 기업 도입을 가속화하는 명확한 규제를 기반으로 2025년 매출의 40.55%를 차지했습니다. 진행 중인 5G 및 엣지 구축은 스마트 팩토리 및 원격 의료 프로그램에서 1초 미만의 처리 요구를 뒷받침하고 있습니다. AWS는 2025년 1분기 견조한 클라우드 매출을 기록하며 긍정적인 성장세를 보였습니다.
아시아태평양은 중국의 산업용 IoT 추진과 인도의 스마트 시티 투자로 인해 대상 시장 규모가 확대되어, 2031년까지 연평균 성장률(CAGR) 17.56%로 세계 성장을 견인할 전망입니다. 화웨이의 AI 데이터 레이크와 5.5G 네트워크 솔루션은 저지연 및 AI 중심 인프라에 대한 해당 지역의 노력을 잘 보여주고 있습니다. 물류 및 농업 분야에서의 동남아시아 내 도입 확대가 수요를 더욱 넓힐 전망입니다.
유럽에서는 ‘인더스트리 4.0’의 추진과 현지 데이터 처리를 의무화하는 엄격한 개인정보 보호 규제로 인해 꾸준한 성장이 이어지고 있습니다. 독일의 자동차 생산 라인, 영국의 디지털 헬스 분야 시범 사업, 북유럽의 스마트 그리드 프로젝트는 IoT 데이터 관리 시장에서 규정 준수를 최우선으로 하는 고부가가치 노력의 좋은 사례입니다. 한편, 라틴아메리카 및 중동 및 아프리카는 여전히 초기 단계에 있지만, 인프라 구축 계획과 도시화의 진전에 따라 턴키 방식의 비용 효율성이 뛰어난 솔루션을 제공하는 벤더에게 장기적인 성장 여지가 생기고 있습니다.
기타 혜택 :
- 엑셀 형식 시장 예측(ME) 시트
- 3개월간의 애널리스트 지원
자주 묻는 질문
목차
제1장 서론
제2장 조사 방법
제3장 주요 요약
제4장 시장 구도
제5장 시장 규모 및 성장 예측(금액, 2021-2030년)
제6장 경쟁 구도
제7장 시장 기회 및 향후 전망
KTH 26.08.28According to Mordor Intelligence, ioT data management market size in 2026 is estimated at USD 92.39 billion, growing from 2025 value of USD 79.31 billion with 2031 projections showing USD 197.94 billion, growing at 16.49% CAGR over 2026-2031.
This report is Segmented by Solution (Integration, Migration, Analytics, and More), Deployment Model (Cloud, On-Premise, Hybrid), Data Type (Structured, Semi-Structured, Unstructured, Time-Series), End-User Industry (Agriculture, BFSI, and More), Application (Predictive Maintenance, Smart Metering, Smart Grid Analytics, and More), and Geography. The Market Forecasts are Provided in Terms of Value (USD).
Global IoT Data Management Market Trends and Insights
Proliferation of Connected Devices Spurring Data Volumes
Industrial plants now deploy thousands of sensors per line, generating terabytes of telemetry that traditional data stores cannot absorb. Bosch shortened AI rollout cycles from months to weeks by automating data-pipeline orchestration, underscoring the scale challenges of sensor growth. Healthcare sees a similar surge as remote patient monitors stream continuous biometrics, needing HIPAA-compliant, low-latency storage. Velocity and variety pressures are pushing enterprises toward stream-first, time-series-native architectures that synchronize edge and cloud data in sub-second windows.
Cloud-Native Data Lakes and Analytics Maturity
Containerized and serverless data-lake patterns auto-scale with ingestion peaks, dissolving prior capacity-planning bottlenecks. Snowflake's Openflow release in June 2025 illustrates friction-free cross-cloud data mobility that accelerates AI prototyping. Built-in ML pipelines now run directly inside lake environments, avoiding costly ETL steps and strengthening governance via lineage, encryption, and granular permissions.
Fragmented Standards and Interoperability Gaps
Divergent protocols force businesses to build custom middleware that inflates maintenance costs and slows rollouts. Legacy industrial gear exacerbates complexity by requiring translation layers to talk to modern IoT platforms. Proprietary data models heighten vendor lock-in, burdening teams with parallel catalogs and lineage trackers that sap productivity and elevate risk.
Other drivers and restraints analyzed in the detailed report include:
- Regulatory Push for Data Governance and Security
- Real-Time Edge Analytics for Operational Efficiency
- High Total Cost of Ownership for End-to-End Stacks
For complete list of drivers and restraints, kindly check the Table Of Contents.
Segment Analysis
Analytics held a 36.42% revenue lead in 2025 as enterprises pivoted from raw-data capture to actionable insight generation within the IoT data management market. The need to visualize anomalies, optimize asset utilization, and feed predictive algorithms propelled analytics adoption alongside integrated dashboards that democratize insights for frontline staff.
Stream processing is slated for a 16.86% CAGR, reflecting a decisive transition to continuous decision loops in manufacturing, healthcare, and mobility. Teradata's integrated enterprise vector store debuted in March 2025 to power AI-ready workloads that unify traditional analytics and generative models. Security, metadata management, and time-series-optimized storage deepen platform stickiness, positioning full-stack suites as default enterprise choices.
Cloud retained a commanding 70.35% share in 2025 thanks to limitless scalability and opex-friendly pricing, delivering elastic compute for AI-intensive workloads across the IoT data management market. Yet hybrid configurations will post a 17.12% CAGR as data-sovereignty rules and latency-sensitive use cases keep select workloads on-premises.
Organizations increasingly process high-frequency data at the edge, forwarding aggregated analytics to cloud lakes for enterprise reporting. Hitachi Vantara's EverFlex with Cisco Powered Hybrid Cloud showcases on-demand infrastructure ranging from IaaS to Containers-as-a-Service, bundled under flexible subscriptions. The convergence of edge orchestration and centralized governance unlocks new deployment patterns that align cost, compliance, and performance goals.
Complete Report Scope:
- By Solution
- Integration
- Migration
- Analytics
- Storage
- Security
- Visualization and Dashboards
- Metadata Management
- Stream Processing
- By Deployment Model
- Cloud
- On-Premise
- Hybrid
- By Data Type
- Structured
- Semi-Structured
- Unstructured
- Time-Series
- By End-User Industry
- Automotive and Transportation
- Healthcare and Life Sciences
- Government and Smart Cities
- Manufacturing and Industrial
- Energy and Utilities
- Retail and E-commerce
- Agriculture
- BFSI
- Others
- By Application
- Predictive Maintenance
- Asset Tracking and Fleet Management
- Smart Metering
- Supply-Chain Visibility
- Remote Patient Monitoring
- Smart Grid Analytics
- By Geography
- North America
- United States
- Canada
- Mexico
- South America
- Brazil
- Argentina
- Rest of South America
- Europe
- Germany
- United Kingdom
- France
- Italy
- Spain
- Russia
- Rest of Europe
- Asia Pacific
- China
- Japan
- India
- South Korea
- Rest of Asia Pacific
- Middle East and Africa
- Middle East
- Saudi Arabia
- United Arab Emirates
- Turkey
- Rest of Middle East
- Africa
- South Africa
- Nigeria
- Rest of Africa
- Middle East
- North America
Geography Analysis
North America generated 40.55% of 2025 revenue, anchored by hyperscaler ecosystems, abundant data-science talent, and regulatory clarity that speeds enterprise adoption. Ongoing 5G and edge rollouts support sub-second processing needs in smart-factory and telehealth programs. AWS signaled healthy momentum with robust Q1 2025 cloud revenue.
Asia Pacific will pace global growth at an 17.56% CAGR to 2031 as China's industrial-IoT drive and India's smart-city spend enlarge addressable volumes. Huawei's AI Data Lake and 5.5G network solutions reveal regional commitment to low-latency, AI-centric infrastructure. Rising Southeast-Asian deployments in logistics and agriculture further broaden demand.
Europe sustains measured expansion through Industry 4.0 and stringent privacy rules that necessitate localized processing. Germany's automotive lines, the UK's digital-health pilots, and Nordic smart-grid projects exemplify high-value, compliance-first engagements within the IoT data management market. Meanwhile, Latin America and Middle East & Africa remain early-stage, yet infrastructure programs and urbanization create long-run upside for vendors offering turnkey, cost-efficient solutions.
- Amazon Web Services (AWS)
- Microsoft Corp. (Azure)
- IBM Corp.
- SAP SE
- Cisco Systems Inc.
- Oracle Corp.
- Google Cloud Platform
- PTC Inc.
- Teradata Corp.
- Hewlett Packard Enterprise
- SAS Institute Inc.
- Fujitsu Ltd.
- Cloudera Inc.
- Snowflake Inc.
- Databricks Inc.
- Hitachi Vantara LLC
- Huawei Technologies Co. Ltd.
- Bosch.IO GmbH
- MongoDB Inc.
- Software AG
Additional Benefits:
- The market estimate (ME) sheet in Excel format
- 3 months of analyst support
TABLE OF CONTENTS
1 Introduction
- 1.1 Study Assumptions and Market Definition
- 1.2 Scope of the Study
2 Research Methodology
3 Executive Summary
4 Market Landscape
- 4.1 Market Overview
- 4.2 Market Drivers
- 4.2.1 Proliferation of connected devices spurring data volumes
- 4.2.2 Cloud-native data lakes and analytics maturity
- 4.2.3 Regulatory push for data governance and security
- 4.2.4 Real-time edge analytics for operational efficiency
- 4.2.5 5G network-slicing enabling prioritised IoT data streams
- 4.2.6 Emergence of data-marketplaces monetising sensor data
- 4.3 Market Restraints
- 4.3.1 Fragmented standards and interoperability gaps
- 4.3.2 High total cost of ownership for end-to-end stacks
- 4.3.3 Sustainability concerns over energy footprint
- 4.3.4 Data-sovereignty regulations restricting cross-border flows
- 4.4 Value / Supply-Chain Analysis
- 4.5 Regulatory Landscape
- 4.6 Technological Outlook
- 4.7 Porter's Five Forces Analysis
- 4.7.1 Threat of New Entrants
- 4.7.2 Bargaining Power of Buyers
- 4.7.3 Bargaining Power of Suppliers
- 4.7.4 Threat of Substitutes
- 4.7.5 Intensity of Competitive Rivalry
- 4.8 Investment Analysis
5 Market Size and Growth Forecasts (Value, 2021-2030)
- 5.1 By Solution
- 5.1.1 Integration
- 5.1.2 Migration
- 5.1.3 Analytics
- 5.1.4 Storage
- 5.1.5 Security
- 5.1.6 Visualization and Dashboards
- 5.1.7 Metadata Management
- 5.1.8 Stream Processing
- 5.2 By Deployment Model
- 5.2.1 Cloud
- 5.2.2 On-Premise
- 5.2.3 Hybrid
- 5.3 By Data Type
- 5.3.1 Structured
- 5.3.2 Semi-Structured
- 5.3.3 Unstructured
- 5.3.4 Time-Series
- 5.4 By End-User Industry
- 5.4.1 Automotive and Transportation
- 5.4.2 Healthcare and Life Sciences
- 5.4.3 Government and Smart Cities
- 5.4.4 Manufacturing and Industrial
- 5.4.5 Energy and Utilities
- 5.4.6 Retail and E-commerce
- 5.4.7 Agriculture
- 5.4.8 BFSI
- 5.4.9 Others
- 5.5 By Application
- 5.5.1 Predictive Maintenance
- 5.5.2 Asset Tracking and Fleet Management
- 5.5.3 Smart Metering
- 5.5.4 Supply-Chain Visibility
- 5.5.5 Remote Patient Monitoring
- 5.5.6 Smart Grid Analytics
- 5.6 By Geography
- 5.6.1 North America
- 5.6.1.1 United States
- 5.6.1.2 Canada
- 5.6.1.3 Mexico
- 5.6.2 South America
- 5.6.2.1 Brazil
- 5.6.2.2 Argentina
- 5.6.2.3 Rest of South America
- 5.6.3 Europe
- 5.6.3.1 Germany
- 5.6.3.2 United Kingdom
- 5.6.3.3 France
- 5.6.3.4 Italy
- 5.6.3.5 Spain
- 5.6.3.6 Russia
- 5.6.3.7 Rest of Europe
- 5.6.4 Asia Pacific
- 5.6.4.1 China
- 5.6.4.2 Japan
- 5.6.4.3 India
- 5.6.4.4 South Korea
- 5.6.4.5 Rest of Asia Pacific
- 5.6.5 Middle East and Africa
- 5.6.5.1 Middle East
- 5.6.5.1.1 Saudi Arabia
- 5.6.5.1.2 United Arab Emirates
- 5.6.5.1.3 Turkey
- 5.6.5.1.4 Rest of Middle East
- 5.6.5.2 Africa
- 5.6.5.2.1 South Africa
- 5.6.5.2.2 Nigeria
- 5.6.5.2.3 Rest of Africa
- 5.6.5.1 Middle East
- 5.6.1 North America
6 Competitive Landscape
- 6.1 Market Concentration
- 6.2 Strategic Moves
- 6.3 Market Share Analysis
- 6.4 Company Profiles (includes Global level Overview, Market level overview, Core Segments, Financials as available, Strategic Information, Market Rank/Share, Products and Services, Recent Developments)
- 6.4.1 Amazon Web Services (AWS)
- 6.4.2 Microsoft Corp. (Azure)
- 6.4.3 IBM Corp.
- 6.4.4 SAP SE
- 6.4.5 Cisco Systems Inc.
- 6.4.6 Oracle Corp.
- 6.4.7 Google Cloud Platform
- 6.4.8 PTC Inc.
- 6.4.9 Teradata Corp.
- 6.4.10 Hewlett Packard Enterprise
- 6.4.11 SAS Institute Inc.
- 6.4.12 Fujitsu Ltd.
- 6.4.13 Cloudera Inc.
- 6.4.14 Snowflake Inc.
- 6.4.15 Databricks Inc.
- 6.4.16 Hitachi Vantara LLC
- 6.4.17 Huawei Technologies Co. Ltd.
- 6.4.18 Bosch.IO GmbH
- 6.4.19 MongoDB Inc.
- 6.4.20 Software AG
7 Market Opportunities and Future Outlook
- 7.1 White-space and Unmet-need Assessment


