

|
시장보고서
상품코드
2114534
펩타이드 치료제 시장 : 시장 점유율 분석, 업계 동향 및 통계, 성장 예측(2026-2031년)Peptide Therapeutics - Market Share Analysis, Industry Trends & Statistics, Growth Forecasts (2026 - 2031) |
||||||
 Mordor Intelligence
Mordor Intelligence에 의하면, 펩타이드 치료제 시장 규모는 2026년에 496억 8,000만 달러로 추정되고, 예측 기간(2026-2031년) CAGR 7.16%로 확대될 전망이며, 2031년에는 702억 달러에 이를 전망입니다.
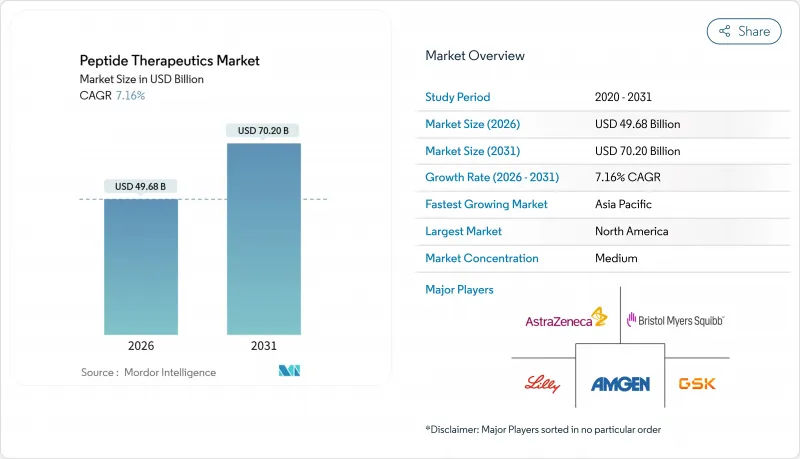
본 보고서는 마케팅 형태별(제네릭 의약품 및 브랜드 의약품), 적응증별(위장 질환, 대사성 질환, 종양학 등), 투여 경로별(비경구 투여, 경구 투여 등), 기술별(고체상 펩타이드 합성(SPPS) 등), 최종 사용자별(병원 및 진료소 등), 지역별(북미 등)로 분류되어 있습니다. 시장 예측은 금액(달러)으로 표시되어 있습니다.
세계의 펩타이드 치료제 시장 동향 및 인사이트
암 및 대사성 질환 유병률 증가
펩타이드 수용체 방사성 동위원소 요법(PRRT)과 GLP-1 작용제가 두 분야 모두에서 질병 경과를 개선할 가능성을 보여주고 있어, 종양학과 대사성 질환 분야에서 치료 수단의 공통화가 진행되고 있습니다. 바츠 증후군에 대한 엘라미프레티드의 FDA 승인 및 PRRT의 지속적인 보급은 저분자 화합물로는 특이성이 부족한 희귀암에서 펩타이드의 유효성을 입증하고 있습니다. 틸제파티드와 같은 듀얼 작용제는 HbA1c를 최대 2.59% 감소시키고, 3상 임상시험 참가자의 88%에서 체중 감소를 유도하여, 2형 당뇨병에서 펩타이드를 1차 선택 약물로 사용하는 것을 뒷받침하고 있습니다. 계산 생물학은 신약 개발 파이프라인을 확대하고 있으며, 2025 Peptide Predictor 알고리즘은 인크레틴 축을 넘어선 항비만 펩타이드인 BRP를 발견했습니다. 현재 펩타이드가 전 세계 2상 및 3상 파이프라인의 18%를 차지하고 있으며, 노보노르디스크의 CagriSema를 사용한 REDEFINE 1 임상시험 결과는 심혈관 및 대사 질환에 대한 다중 위험 인자 감소를 더욱 뒷받침하고 있습니다. 이러한 임상적 성과에 힘입어 연구개발 예산이 저분자 화합물에서 펩타이드로 이동하고 있으며, 이는 펩타이드 치료제 시장에 대한 장기적인 수요를 뒷받침하고 있습니다.
GLP-1 및 멀티아고니스트 파이프라인에 대한 대형 제약사의 자금 투입이 급증
역대 최고액에 달하는 거래는 대형 제약사들이 펩타이드를 임박한 특허 만료에 대비한 방어적 자산으로 간주하고 있음을 여실히 보여줍니다. Zealand Pharma와 로슈 간의 16억 5,000만 달러 규모의 선급 계약은 페트렐린타이드의 가치를 해당 기업의 2024년 기업 수익의 12배로 평가했습니다. 노보노르디스크사의 2억 8,500만 달러에 달하는 TransCon 세마글루타이드 제휴는 보험 적용 우선이 예상되는월1회 투여 요법에 대해 혁신 기업이 대가를 지불하고 있음을 보여줍니다. 펩타이드림(PeptideDream)과 노바티스(Novartis) 간에 체결된 방사성 리간드 복합체에 관한 1억 8,000만 달러 규모의 계약은 초기 단계의 신약 개발 플랫폼이라 하더라도 현재는 후기 단계에 상응하는 배수로 평가받게 되었음을 입증했습니다. 제넨텍(Genentech)사와의 펩타이드-RNAi 복합체에 관한 10억 달러 규모의 계약을 포함한 초기 단계의 제휴는 개발의 전 단계에 걸쳐 자본이 유입되고 있음을 시사합니다. 인수까지의 기간이 단축됨에 따라, 검증된 펩타이드 라이브러리를 보유한 중소 바이오테크 기업들은 단기간에 높은 평가액을 확보할 수 있게 되었으며, 이러한 추세는 펩타이드 치료제 시장의 지속적인 확장을 뒷받침하고 있습니다.
단백질 분해에 의한 불안정성과 낮은 경구 생체이용률
펩타이드는 본래 효소에 의한 분해에 취약하기 때문에 실용 가능한 경구용 후보 약물은 극히 일부로 한정되어 있습니다. 노보노르디스크사의 ‘Rybelsus’는 생체이용률이 불과 1%에 그쳐, 1mg 주사제와 동등한 효과를 얻기 위해서는 14mg의 투여량이 필요합니다. 마이캡사(MyCapsa)의 TPE 기술을 활용한 경구용 옥트레오티드는 생체이용률이 0.9%에 달하지만, 그럼에도 하루 2회 투여가 필요합니다. ‘RaniPill’과 같은 기기 기반 솔루션은 약물을 장벽에 기계적으로 주입하지만, 제조상의 문제와 환자의 수용성 문제를 야기합니다. 제형 개량제는 개발 비용을 최대 50% 증가시키고, 임상시험 기간을 최대 18개월 연장시킵니다. 그 결과, 경구 투여는 펩타이드 치료제 시장에서 의미 있는 기회이기는 하지만, 그 잠재력에는 한계가 있는 기회로 남아 있습니다.
부문 분석
2025년 펩타이드 치료제 시장에서 브랜드 펩타이드는 61.55%의 점유율을 차지했습니다. 기존 브랜드 의약품 제조업체들은 노보노르디스크의 트랜스콘·세마글루타이드에 대한 제휴나 로슈의 페트렐린타이드 권리 취득과 같은 라이프사이클 전략을 통해 시장 내 입지를 지키고 있습니다. 한편,제네릭 제제는 릴라글루티드의 제네릭 의약품이 FDA 승인을 획득한 점과 엑세나티드 및 듀라글루티드에 대한 ANDA(제네릭 의약품 승인 신청) 파이프라인에 힘입어, 2026-2031년 연평균 성장률(CAGR) 8.25%를 나타낼 것으로 예측됩니다.
제네릭 제조업체들은 생물학적 동등성 시험에 500만-1,000만 달러의 비용이 소요되고, SPPS의 배치 간 변동성이 검증 과정을 어렵게 만들고 있어, 비교 가능성 확보에 있어 더 큰 부담에 직면해 있습니다. 그러나 바이오콘(BioCon)이나 닥터 레디스(Dr. Reddy’s)와 같은 기업들은 재조합 발현 기술을 활용하여 바이오시밀러 인슐린의 가격을 참조 브랜드보다 15-30% 낮게 설정하면서도 수익성을 유지하고 있어, 펩타이드 치료제 시장의 제네릭 하위 부문에서 성장세를 강화하고 있습니다.
종양학 분야는 루타세라(Lutathera) 등의 PRRT 제품을 바탕으로 2025년 시점에서 펩타이드 치료제 시장 점유율 35.53%를 유지했으나, 소화기 질환 분야는 2031년까지 연평균 성장률(CAGR) 11.85%로 성장할 전망입니다. 다케다 제약이 9억 달러에 아프라글루티드를 인수한 것과 Zealand Pharma가 현재 진행 중인 글레파글루티드 개발 프로그램은 단장증후군에 대한 GLP-2 유사체에 대한 제약 기업의 강한 관심을 보여주고 있습니다.
테두글루티드의 2024년 매출액 4억 5,000만 달러는 그 상업적 타당성을 입증하고 있으며, 한편 염증성 장질환을 대상으로 한 GLP-1/GLP-2 이중 작용형 후속 후보 약물의 개발도 진전되고 있습니다. 그 밖에도 SELLAS사의 갈림푸피무트-S 등 펩타이드 백신이 백혈병에서 3상 임상시험 단계에 도달했으며, 성장률은 둔화되고 있지만 종양학 분야의 혁신 깊이가 부각되고 있습니다.
지역별 분석
북미는 2025년에 38.34%의 점유율을 차지했습니다. 이는 FDA의 패스트 트랙 지정과, 론자(Lonza)사의 4억 7,500만 달러 규모의 포츠머스 공장 및 바켐(Bakem)사의 1억 9,000만 달러 규모의 비스타 시설을 지원한 25%의 제조 세액 공제에 힘입은 결과입니다. 미국은 연간 치료비가 1만 달러를 초과하는 것에 대한 지불자의 수용도가 높기 때문에 지역 매출의 약 70%를 차지하고 있습니다. 캐나다와 멕시코는 각각 한 자릿수 중반대의 기여도를 보이고 있으며, 멕시코는 미국 수요를 위한 API 생산에서 니어쇼어링의 역할을 수행하고 있습니다.
아시아태평양은 가장 두드러진 성장을 보이는 지역으로, 2031년까지 연평균 성장률(CAGR)은 12.81%로 성장을 지속할 전망입니다. 중국의 신속 승인 제도에 따라 국내에서 GLP-1 바이오시밀러의 출시가 가능해졌으며, 우시 바이오로직스는 2024년에 발효 능력을 5,000리터 확대했습니다. 인도의 Biocon사와 Dr. Reddy’s사는 유럽 및 동남아시아에서 판매되는 인슐린 아날로그의 재조합 발현 기술을 활용하고 있는 반면, 일본의 PeptiDream사는 1조 종에 달하는 펩타이드 라이브러리를 활용하여 지역의 혁신을 뒷받침하고 있습니다. 한국과 호주는 신흥 CDMO 시장 및 보상 기회를 제공합니다.
유럽의 성장은 EMA(유럽의약품청)의 2025년 불순물 지침에 의해 제약을 받고 있으며, 이로 인해 배치당 품질 관리(QC) 비용이 최대 10만 달러 증가했습니다. 독일은 PolyPeptide사의 1억 5,000만 달러 규모의 확장으로 해당 지역의 생산을 주도하고 있지만, 인건비와 에너지 비용은 아시아태평양보다 20-30% 높은 수준을 유지하고 있습니다. 2024년에 12개의 펩타이드 프로그램이 PRIME 지정을 받음에 따라 유럽 내 개발 기간은 단축되겠지만, 제조업체들은 규정 준수 관련 추가 비용을 부담하게 되어 해당 지역의 연평균 성장률(CAGR)은 둔화되고 있습니다.
기타 혜택 :
- 엑셀 형식 시장 예측(ME) 시트
- 3개월간의 애널리스트 지원
자주 묻는 질문
목차
제1장 서론
제2장 조사 방법
제3장 주요 요약
제4장 시장 구도
제5장 시장 규모 및 성장 예측
제6장 경쟁 구도
제7장 시장 기회 및 향후 전망
AJY 26.08.26According to Mordor Intelligence, the peptide therapeutics market size is estimated at USD 49.68 billion in 2026, and is expected to reach USD 70.20 billion by 2031, at a CAGR of 7.16% during the forecast period (2026-2031).
This report is Segmented by Marketing Type (Generic and Branded), Application (Gastrointestinal Disorders, Metabolic Disorders, Oncology, and More), Route of Administration (Parenteral, Oral, and More), Technology (Solid-Phase Peptide Synthesis (SPPS), and More), End User (Hospitals & Clinics, and More), and Geography (North America, and More). The Market Forecasts are Provided in Terms of Value (USD).
Global Peptide Therapeutics Market Trends and Insights
Rising Prevalence of Cancer & Metabolic Diseases
Oncology and metabolic disorders increasingly share a therapeutic toolbox, as peptide receptor radionuclide therapy and GLP-1 agonists demonstrate disease-modifying potential across both areas. FDA approval of elamipretide for Barth syndrome and ongoing expansion of PRRT validate peptides in rare cancers where small molecules lack specificity. Dual agonists such as tirzepatide reduced HbA1c by up to 2.59% and delivered weight loss in 88% of Phase 3 patients, moving peptides toward first-line use in type 2 diabetes. Computational biology is widening the discovery funnel; the 2025 Peptide Predictor algorithm uncovered BRP, an anti-obesity peptide beyond the incretin axis. Peptides now represent 18% of global Phase 2/3 pipelines, and Novo Nordisk's REDEFINE 1 results with CagriSema further underscore multi-factor risk reduction in cardiometabolic disease. These clinical wins are redirecting R&D budgets away from small molecules and bolstering long-term demand for the peptide therapeutics market.
Surge in Big-Pharma Funding for GLP-1 & Multi-Agonist Pipelines
Record-breaking transactions highlight how pharmaceutical leaders treat peptides as defensive assets against looming patent cliffs. Zealand Pharma's USD 1.65 billion upfront deal with Roche values petrelintide at 12 times the company's 2024 revenue. Novo Nordisk's USD 285 million TransCon Semaglutide partnership shows innovators paying for monthly dosing regimens expected to win formulary preference. PeptiDream's USD 180 million Novartis pact for radioligand conjugates proved that early discovery platforms can now fetch late-stage multiples. Earlier-stage collaborations, including a USD 1 billion Genentech agreement for peptide-RNAi conjugates, signal that capital is flowing across the development continuum. As acquisition timelines compress, smaller biotech firms with validated peptide libraries can achieve premium valuations quickly, a pattern that supports sustained expansion of the peptide therapeutics market.
Proteolytic Instability & Low Oral Bioavailability
Peptides are naturally susceptible to enzymatic degradation, restricting viable oral candidates to a narrow subset. Novo Nordisk's Rybelsus achieves just 1% bioavailability and requires a 14 mg dose to match a 1 mg injection. Mycapssa's TPE-enabled oral octreotide reaches 0.9% bioavailability and still needs twice-daily dosing. Device-based solutions like the RaniPill mechanically inject the drug into the intestinal wall but introduce manufacturing and patient-acceptance hurdles. Formulation enhancers add up to 50% in development cost and extend clinical timelines by as much as 18 months. Consequently, oral delivery remains a meaningful yet capped opportunity within the peptide therapeutics market.
Other drivers and restraints analyzed in the detailed report include:
- Maturing Solid-Phase & Hybrid Synthesis Platforms
- Regulatory Fast-Track Pathways for Rare-Disease Peptides
- High cGMP Manufacturing Cost vs. Small-Molecule APIs
For complete list of drivers and restraints, kindly check the Table Of Contents.
Segment Analysis
The peptide therapeutics market for branded peptides in 2025 represented a 61.55% share. Branded incumbents defend position through lifecycle strategies such as Novo Nordisk's TransCon Semaglutide collaboration and Roche's acquisition of petrelintide rights. Generic formulations, however, are projected to grow at an 8.25% CAGR from 2026 to 2031, buoyed by the FDA approval of generic liraglutide and a pipeline of ANDAs for exenatide and dulaglutide.
Generic manufacturers face higher comparability burdens because bioequivalence studies cost USD 5-10 million and SPPS batch variability challenges validation. Yet companies like Biocon and Dr. Reddy's leverage recombinant expression to price biosimilar insulins 15-30% below reference brands while staying profitable, reinforcing momentum in the generic sub-segment of the peptide therapeutics market.
Oncology maintained 35.53% peptide therapeutics market share in 2025 on the back of PRRT products such as Lutathera, but GI disorders will expand at an 11.85% CAGR through 2031. Takeda's USD 900 million acquisition of apraglutide and Zealand Pharma's ongoing glepaglutide program illustrate strong sponsor appetite for GLP-2 analogs in short bowel syndrome.
Teduglutide's USD 450 million 2024 sales verify commercial viability, while follow-on dual GLP-1/GLP-2 candidates are advancing for inflammatory bowel disease. Elsewhere, peptide vaccines such as SELLAS's galinpepimut-S reach Phase 3 in leukemia, highlighting oncology's innovation depth even as its growth rate moderates.
Complete Report Scope:
- By Marketing Type
- Branded
- Generic
- By Application
- Oncology
- Metabolic Disorders
- Cardiovascular Disorders
- Infectious Diseases
- Gastrointestinal Disorders
- CNS Disorders
- By Route of Administration
- Parenteral
- Oral
- Pulmonary & Nasal
- Transdermal & Implantable
- By Technology
- Solid-Phase Peptide Synthesis (SPPS)
- Liquid-Phase Peptide Synthesis (LPPS)
- Hybrid & Flow Chemistry
- Recombinant Expression
- By End User
- Hospitals & Clinics
- Research Institutes
- Pharmaceutical & Biotech Companies
- Geography
- North America
- United States
- Canada
- Mexico
- Europe
- Germany
- United Kingdom
- France
- Italy
- Spain
- Rest of Europe
- Asia-Pacific
- China
- Japan
- India
- South Korea
- Australia
- Rest of Asia-Pacific
- Middle East & Africa
- GCC
- South Africa
- Rest of Middle East & Africa
- South America
- Brazil
- Argentina
- Rest of South America
- North America
Geography Analysis
North America held 38.34% share in 2025, propelled by FDA fast-track designations and a 25% manufacturing tax credit that supported Lonza's USD 475 million Portsmouth plant and Bachem's USD 190 million Vista facility. The United States captures roughly 70% of regional revenue given payer tolerance for annual therapy costs above USD 10,000. Canada and Mexico add mid-single-digit contributions, with Mexico playing a nearshoring role for API production aimed at U.S. demand.
Asia-Pacific is the fastest-growing region, registering a 12.81% CAGR through 2031. China's accelerated pathways enabled domestic GLP-1 biosimilar launches, and WuXi Biologics expanded fermentation capacity by 5,000 liters in 2024. India's Biocon and Dr. Reddy's exploit recombinant expression for insulin analogs sold across Europe and Southeast Asia, while Japan's PeptiDream underpins regional innovation with trillion-member peptide libraries. South Korea and Australia contribute emerging CDMO and reimbursement opportunities.
Growth in Europe is moderated by the EMA's 2025 impurity guideline, which elevated QC costs by up to USD 100,000 per batch. Germany leads regional production through PolyPeptide's USD 150 million expansion, yet labor and energy costs remain 20-30% higher than Asia-Pacific. PRIME designations for 12 peptide programs in 2024 shorten European timelines, but manufacturers shoulder added compliance spending, tempering regional CAGR.
- AmbioPharm Inc.
- Amgen
- AstraZeneca
- Bachem Holding
- Bristol-Myers Squibb
- Cambrex Corp.
- Dr. Reddy's Laboratories
- Eli Lilly and Company
- Ever Neuro Pharma
- Ferring Pharmaceuticals
- GlaxoSmithKline
- Ipsen
- Lonza Group
- Novartis
- Novo Nordisk
- PeptiDream Inc.
- Pfizer
- PolyPeptide Group AG
- Sanofi
- SELLAS Life Sciences Group
- Takeda Pharmaceuticals
- Teva Pharmaceutical Inds. Ltd.
- Zealand Pharma
Additional Benefits:
- The market estimate (ME) sheet in Excel format
- 3 months of analyst support
TABLE OF CONTENTS
1 Introduction
- 1.1 Study Assumptions & Market Definition
- 1.2 Scope of the Study
2 Research Methodology
3 Executive Summary
4 Market Landscape
- 4.1 Market Overview
- 4.2 Market Drivers
- 4.2.1 Rising prevalence of cancer & metabolic diseases
- 4.2.2 Surge in big-pharma funding for GLP-1 & multi-agonist pipelines
- 4.2.3 Maturing solid-phase & hybrid synthesis platforms
- 4.2.4 Regulatory fast-track pathways for rare-disease peptides
- 4.2.5 Growth in AI-assisted cyclic macro-peptide discovery
- 4.2.6 Tariff-driven on-shoring of peptide CMOs in US/EU
- 4.3 Market Restraints
- 4.3.1 Proteolytic instability & low oral bioavailability
- 4.3.2 High cGMP manufacturing cost vs. small-molecule APIs
- 4.3.3 Emerging impurity guidelines inflating QC spend
- 4.3.4 Mid-2025 shortage of specialty resins & reagents
- 4.4 Supply-Chain Analysis
- 4.5 Regulatory Landscape
- 4.6 Technological Outlook
- 4.7 Porter's Five Forces
- 4.7.1 Threat of New Entrants
- 4.7.2 Bargaining Power of Buyers
- 4.7.3 Bargaining Power of Suppliers
- 4.7.4 Threat of Substitutes
- 4.7.5 Competitive Rivalry
5 Market Size & Growth Forecasts (Value, USD)
- 5.1 By Marketing Type
- 5.1.1 Branded
- 5.1.2 Generic
- 5.2 By Application
- 5.2.1 Oncology
- 5.2.2 Metabolic Disorders
- 5.2.3 Cardiovascular Disorders
- 5.2.4 Infectious Diseases
- 5.2.5 Gastrointestinal Disorders
- 5.2.6 CNS Disorders
- 5.3 By Route of Administration
- 5.3.1 Parenteral
- 5.3.2 Oral
- 5.3.3 Pulmonary & Nasal
- 5.3.4 Transdermal & Implantable
- 5.4 By Technology
- 5.4.1 Solid-Phase Peptide Synthesis (SPPS)
- 5.4.2 Liquid-Phase Peptide Synthesis (LPPS)
- 5.4.3 Hybrid & Flow Chemistry
- 5.4.4 Recombinant Expression
- 5.5 By End User
- 5.5.1 Hospitals & Clinics
- 5.5.2 Research Institutes
- 5.5.3 Pharmaceutical & Biotech Companies
- 5.6 Geography
- 5.6.1 North America
- 5.6.1.1 United States
- 5.6.1.2 Canada
- 5.6.1.3 Mexico
- 5.6.2 Europe
- 5.6.2.1 Germany
- 5.6.2.2 United Kingdom
- 5.6.2.3 France
- 5.6.2.4 Italy
- 5.6.2.5 Spain
- 5.6.2.6 Rest of Europe
- 5.6.3 Asia-Pacific
- 5.6.3.1 China
- 5.6.3.2 Japan
- 5.6.3.3 India
- 5.6.3.4 South Korea
- 5.6.3.5 Australia
- 5.6.3.6 Rest of Asia-Pacific
- 5.6.4 Middle East & Africa
- 5.6.4.1 GCC
- 5.6.4.2 South Africa
- 5.6.4.3 Rest of Middle East & Africa
- 5.6.5 South America
- 5.6.5.1 Brazil
- 5.6.5.2 Argentina
- 5.6.5.3 Rest of South America
- 5.6.1 North America
6 Competitive Landscape
- 6.1 Market Concentration
- 6.2 Market Share Analysis
- 6.3 Company Profiles (includes Global level Overview, Market level overview, Core Segments, Financials as available, Strategic Information, Market Rank/Share for key companies, Products & Services, and Recent Developments)
- 6.3.1 AmbioPharm Inc.
- 6.3.2 Amgen Inc.
- 6.3.3 AstraZeneca PLC
- 6.3.4 Bachem Holding AG
- 6.3.5 Bristol Myers Squibb Co.
- 6.3.6 Cambrex Corp.
- 6.3.7 Dr. Reddy's Laboratories
- 6.3.8 Eli Lilly and Company
- 6.3.9 Ever Neuro Pharma GmbH
- 6.3.10 Ferring Pharmaceuticals
- 6.3.11 GSK PLC
- 6.3.12 Ipsen S.A.
- 6.3.13 Lonza Group AG
- 6.3.14 Novartis AG
- 6.3.15 Novo Nordisk A/S
- 6.3.16 PeptiDream Inc.
- 6.3.17 Pfizer Inc.
- 6.3.18 PolyPeptide Group AG
- 6.3.19 Sanofi S.A.
- 6.3.20 SELLAS Life Sciences Group
- 6.3.21 Takeda Pharmaceutical Co. Ltd.
- 6.3.22 Teva Pharmaceutical Inds. Ltd.
- 6.3.23 Zealand Pharma A/S
7 Market Opportunities & Future Outlook
- 7.1 White-space & Unmet-Need Assessment


