|
시장보고서
상품코드
2114596
비상 및 재난 대응 : 시장 점유율 분석, 업계 동향 및 통계, 성장 예측(2026-2031년)Emergency And Disaster Response - Market Share Analysis, Industry Trends & Statistics, Growth Forecasts (2026 - 2031) |
||||||
 Mordor Intelligence
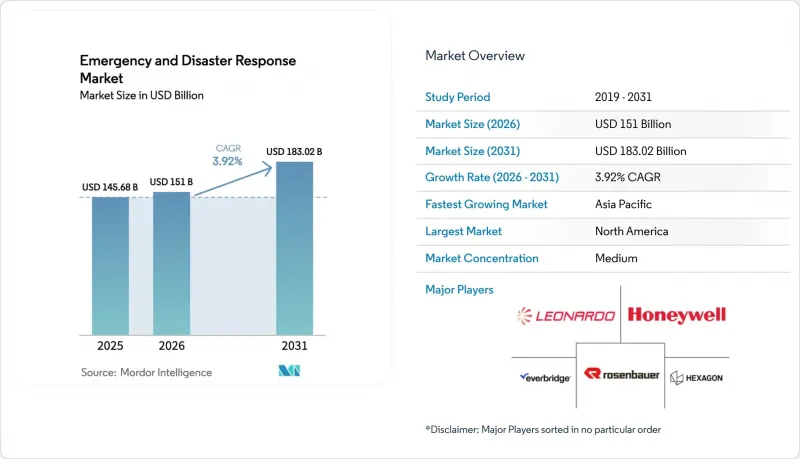
Mordor Intelligence에 의하면, 비상 및 재난 대응 시장 규모는 2025년 1,456억 8,000만 달러로 평가되었습니다. 2026년에는 1,510억 1,000만 달러로 확대되어 2026년부터 2031년에 걸쳐 CAGR 3.92%로 성장을 지속하여, 2031년에는 1,830억 2,000만 달러에 이를 것으로 예측됩니다.
본 보고서는 장비(위협 감지 장비, 개인보호구(PPE), 의료기기, 임시 대피소, 등산 장비, 소방 장비 등), 플랫폼(육상, 해상, 항공),솔루션(하드웨어, 소프트웨어, 서비스), 지역(북미, 유럽, 아시아태평양, 남미, 중동 및 아프리카)별로 분류되어 있습니다. 시장 예측은 금액(달러) 기준으로 제시되어 있습니다.
세계의 비상 및 재난 대응 시장 동향 및 인사이트
자연재해 발생 빈도 및 피해 심각화
2024년, 자연재해로 인한 전 세계 경제적 손실은 2,800억 달러에 달했으며, 2019년부터 2023년까지의 연평균과 비교해 19% 급증했습니다. 피해를 입은 주 및 지역의 거의 절반이 그 후 18개월 이내에 또 다른 대규모 재해를 겪게 되어 복구 기간이 단축되는 한편, 중요한 장비 재고가 고갈되었습니다. 이에 따라 조달 담당자들은 항공 수송이 가능하고 3일 이내에 가동할 수 있는 컨테이너형 정수 시설, 팽창식 수술실, 플랫팩식 주거 유닛을 우선적으로 조달하고 있습니다. 동시에 예측 분석 플랫폼에서는 고해상도 기후 모델과 교량, 제방, 병원 등의 취약성 데이터 세트를 통합하여 재해 발생 전 계획 수립에 활용하고 있습니다. 이러한 접근 방식을 반영하여, 일본은 2025년에 대피 경로 안내 소프트웨어에 직접 통합되는 AI 예측 시스템에 420억 엔(약 2억 8,500만 달러)을 배정했습니다.
정부의 자금 지원과 규제상 의무
정부 지출과 법적 지침은 현재 현대화 예산을 디지털 아키텍처로 이끄는 두 가지 원동력이 되고 있습니다. 미국은 2025 회계연도에 주 및 지방 자치 단체의 재난 대비 보조금을 14% 증가한 32억 달러로 인상했습니다. 이 총액의 35%를 기술 업그레이드에 배정했으며, 소프트웨어 구독, 센서 융합, 드론 편대가 보조금 대상 비용으로 인정받게 되었음을 보여줍니다. 유럽에서는 2024년 중요 인프라 복원력에 관한 지침에 따라 각 회원국이 2년마다 스트레스 테스트를 실시하고, 2026년 12월까지 상호 운용 가능한 광대역 네트워크로 전환해야 할 의무가 부과되었으며, 이로 인해 기존의 협대역 무선 장비는 사실상 단계적으로 폐지될 것입니다. 걸프 연안 국가의 구매자들은 턴키 방식의 지휘 센터를 선호합니다. 사우디아라비아는 2024년에 통합 국가 시스템에 18억 사우디 리얄(약 4억 8,000만 달러)을 배정했습니다. 이는 데이터의 국내 보관을 보장하고 다단계 사이버 인증 기준을 충족하는 공급업체 관리형이자 국가가 호스팅하는 솔루션에 대한 수요가 증가하고 있음을 보여줍니다.
개발도상국의 예산 제약
재해 위험이 높아지는 가운데, 재정적 여유가 부족하여 중저소득 지역의 장비 현대화가 정체되고 있습니다. 세계은행은 2024년에 사하라 이남 아프리카 전역의 18개국 정부가 비부채 공공 투자를 GDP의 평균 1.2% 삭감했으며, 그 삭감의 가장 큰 타격을 입은 분야가 재난 대책이었습니다고 지적했습니다. 이에 대해 케냐는 1,200만 달러 규모의 이동식 지휘 본부 입찰을 취소하고, 대신 유럽 기관이 제공하는 재생 차량을 도입했습니다.
사태를 더욱 악화시키고 있는 것은 통화 약세라는 큰 장벽입니다. 나이지리아 나이라(NGN)는 2024년 1월 이후 129%나 급락했으며, 이로 인해 열화상 카메라, 위성 전화, 발전기 등 필수 수입품의 가격이 실질적으로 2배 이상으로 치솟았습니다. 다자간 금융기관들이 우대 대출 한도를 마련하고는 있지만, 아시아개발은행(ADB)의 데이터에 따르면 대출 실행까지 18-24개월이 소요되는 등 우려할 만한 지연이 발생하고 있습니다. 이러한 지연으로 인해 사이클론과 홍수 시즌이 연이어 닥칠 때 대응 능력의 공백이 발생하고, 각 기관은 노후화된 장비를 본래의 수명을 크게 초과하여 계속 사용해야만 하는 상황에 처해 있습니다.
부문별 분석
개인용 보호 장비는 2025년 매출의 24.56%를 차지했으며, 이는 비상사태 및 재난 대응 시장에서 이 장비가 필수 불가결한 존재임을 여실히 보여줍니다. 위협 감지 장비는 화학·생물·방사능·핵(CBRN) 센서가 소형화되고 AI 분석 기능이 통합됨에 따라 연평균 성장률(CAGR) 5.65%로 가장 빠르게 성장하는 부문입니다. 14,000종의 화합물 데이터베이스에서 불과 30초 만에 화합물을 식별할 수 있는 소형 라만 분광기가 각 기관에 빠르게 도입되고 있습니다. 이러한 빠른 도입이 비상사태 및 재난 대응에 사용되는 위협 감지 장비 시장의 눈에 띄는 성장을 견인하고 있습니다. 소방 장비는 매출액 기준으로 2위를 차지하고 있지만, 지자체가 사다리차의 사용 연한을 18년으로 연장함에 따라 이익률 압박에 직면해 있습니다. 임시 대피소용 장비는 여전히 허리케인이 빈번히 발생하는 지역에 집중되어 있는 반면, 등산용 장비는 고산 구조대에 활용되고 있습니다. 제염 장치 및 휴대용 발전기를 포함한 기타 카테고리는 긴급·재난 대응 시장 전체의 성장을 보완하는 역할을 하고 있습니다.
센서 정밀도 향상, 헤드업 디스플레이 활용, 무선 펌웨어 업데이트 도입을 통해 위협 감지 장비는 혁신의 중심지가 되었습니다. 3M의 M7 SCBA는 바이저 화면에 열화상 이미지를 중첩시켜 연기가 자욱한 실내에서의 인지적 부하를 경감시킵니다. 2025년 퀸즈 어워드를 수상한 Smiths Detection의 휴대용 라만 장치는 항공 보안용 알고리즘을 현장 감지 업무에 적용하여, 업계를 초월한 기술 이전을 입증했습니다. 기후 변화로 인한 현상으로 유해 물질 유출 위험이 높아지는 가운데, 조달 담당자들은 고정밀 위협 감지 장비를 전력을 배가시키는 요인으로 보고 있습니다. 하드웨어에 분석 서비스 구독을 묶어 제공하는 벤더는 소프트웨어를 통해 안정적인 이익률을 확보하고 있으며, 이는 긴급·재난 대응 시장에서 하드웨어에서 소프트웨어로의 광범위한 전환을 촉진하고 있습니다.
지역별 분석
북미는 FEMA(연방 비상 관리국)의 꾸준한 보조금 공급과 의무화된 기술 업데이트 주기에 힘입어 2025년 매출의 37.15%를 차지했습니다. 도입 기반이 포화 상태에 이르러 지출 구성이 소프트웨어 쪽으로 치우치면서, 2031년까지의 성장률은 연평균 성장률(CAGR) 3.5%로 둔화될 것입니다. 캐나다는 원주민 커뮤니티의 인프라에 11억 캐나다 달러(8억 1,000만 달러)를 투자하여, 그동안 서비스가 충분히 제공되지 않았던 하위 시장을 확대했습니다. 멕시코는 지진 경보 네트워크 현대화를 추진 중이며, 2,100개의 가속도계를 도입하여 경보 발령 지연을 10초 미만으로 단축하는 것을 목표로 하고 있습니다.
아시아태평양은 연평균 성장률(CAGR) 5.20%로 성장을 주도하며, 가장 역동적인 비상 및 재난 대응 시장임이 입증되었습니다. 중국은 각 성의 AI 대응 지휘 센터에 약 65억 달러를 투자하고 있으며, 2027년까지 디지털 워크플로우 도입률 90%를 달성하는 것을 목표로 하고 있습니다. 인도의 메쉬 무선 네트워크 구축과 일본의 AI 예측 시범 사업은 첨단 아키텍처로 직접 도약하는 좋은 사례입니다. 한국의 5G 공공 안전 네트워크는 이미 인구의 98%를 커버하고 있으며, 사고 현장에서의 실시간 영상 전송을 가능하게 하고 있습니다. 인도네시아는 2024년 홍수를 계기로 85대의 수륙 양용 구조 차량을 조달한 반면, 호주는 2024년 재검토를 바탕으로 통신 표준화를 추진하고 있습니다.
유럽에서는 rescEU의 자원 공유 모델과 주·지방 자치 단체 기관을 아우르며 중요 시설의 복원력을 강화하는 대륙 규모의 지침에 힘입어, 긴급 대응 체제 강화가 추진되고 있습니다. 독일은 지오펜스형 경보 네트워크의 업그레이드를 추진하고 있으며, 프랑스는 다목적 에어버스 헬리콥터를 도입해 항공 의료 이송 및 소방 역량 강화를 도모하는 한편, 조기 경보 데이터 융합 시스템도 도입하고 있습니다. 영국에서는 새로운 광대역 긴급 서비스 네트워크의 전역 커버리지가 코앞으로 다가왔지만, 단말기 인증이 여전히 과제로 남아 있습니다. 러시아 기관들은 지속되는 제재 조치 속에서 국산 플랫폼에 주력하고 있습니다. 걸프 연안 국가들에서도 자체 개발 능력 향상을 위한 프로그램이 증가하고 있으며, 브라질과 남아프리카공화국에서는 재정적 제약을 보완하기 위한 새로운 자금 조달 메커니즘이 등장하고 있습니다.
기타 혜택 :
- 엑셀 형식 시장 예측(ME) 시트
- 3개월간의 애널리스트 지원
자주 묻는 질문
목차
제1장 서론
제2장 조사 방법
제3장 주요 요약
제4장 시장 구도
제5장 시장 규모 및 성장 예측
제6장 경쟁 구도
제7장 시장 기회 및 향후 전망
KTH 26.08.28According to Mordor Intelligence, the emergency and disaster response market size is expected to grow from USD 145.68 billion in 2025 to USD 151.01 billion in 2026 and is forecasted to reach USD 183.02 billion by 2031 at a 3.92% CAGR over 2026-2031.
This report is Segmented by Equipment (Threat Detection, Personal Protection Gear, Medical, Temporary Shelter, Mountaineering, Firefighting, and More), Platform (Land, Marine, and Airborne), Solution (Hardware, Software, and Services), and Geography (North America, Europe, Asia-Pacific, South America, and Middle East and Africa). The Market Forecasts are Provided in Terms of Value (USD).
Global Emergency And Disaster Response Market Trends and Insights
Rising Frequency and Severity of Natural Disasters
Natural disasters resulted in USD 280 billion in global economic losses in 2024, a 19% surge over the annual average for 2019-2023. Almost half of the impacted provinces, states, or districts subsequently endured another major event within an 18-month window, compressing recovery periods and exhausting inventories of critical gear. Procurement officers are therefore prioritizing fly-ready containerized water-purification plants, inflatable surgical theaters, and flat-pack housing units that can be airlifted and operational within three days. Simultaneously, predictive analytics platforms now integrate high-resolution climate models with vulnerability datasets for bridges, levees, and hospitals to guide pre-disaster planning. Reflecting this mindset, Japan earmarked JPY 42 billion (approximately USD 285 million) in 2025 for AI forecasting systems that integrate directly into evacuation-routing software.
Government Funding and Regulatory Mandates
Government outlays and statutory directives are now the twin accelerants steering modernization budgets toward digital architectures. The US increased state and local preparedness grants by 14% to USD 3.2 billion for 2025. It allocated 35% of the total for technology upgrades, indicating that software subscriptions, sensor fusion, and drone fleets are now allowable grant expenses. In Europe, the 2024 Critical Entities Resilience Directive requires each member state to conduct biennial stress tests and migrate to interoperable broadband networks by December 2026, effectively phasing out legacy narrowband radios. Gulf buyers prefer turnkey command centers. Saudi Arabia allocated SAR 1.8 billion (approximately USD 480 million) in 2024 for an integrated national system, underscoring the growing demand for vendor-managed, sovereign-hosted solutions that ensure data residency and meet multilevel cyber certification standards.
Budget Constraints in Developing Economies
As hazard exposure intensifies, limited fiscal headroom is stalling equipment modernization in lower-middle-income regions. The World Bank highlighted that in 2024, 18 governments across Sub-Saharan Africa reduced non-debt public investments by an average of 1.2% of GDP, with disaster preparedness facing the brunt of these cuts. In response, Kenya abandoned a USD 12 million tender for a mobile command unit and opted instead for refurbished vehicles provided by European agencies.
Adding to the woes, currency depreciation poses a significant hurdle: NGN has plummeted by 129% since January 2024, effectively more than doubling the price of essential imports, such as thermal cameras, satellite phones, and power generators. While multilateral lenders have rolled out concessional facilities, data from the Asian Development Bank reveal a concerning lag: loan disbursements stretch over 18-24 months. This delay creates capability gaps during back-to-back cyclone or flood seasons, forcing agencies to push aging hardware well beyond its intended service life.
Other drivers and restraints analyzed in the detailed report include:
- Technological Advances in AI, IoT, GIS and Drones
- Satellite-Independent Mesh Networking Adoption
- Complex and Fragmented Interoperability Standards
For complete list of drivers and restraints, kindly check the Table Of Contents.
Segment Analysis
Personal protection gear accounted for 24.56% of 2025 revenue, underscoring its non-discretionary status in the emergency and disaster response market. Threat detection equipment is the fastest-growing segment, with a 5.65% CAGR, as chemical, biological, radiological, and nuclear sensors shrink and incorporate AI analytic layers. Miniaturized Raman spectrometers that can identify a chemical compound from a database of 14,000 in just 30 seconds are being rapidly adopted by agencies. This swift adoption is driving significant growth in the market for threat-detection equipment used in emergency and disaster response. Firefighting equipment ranks second in revenue but faces margin pressure as municipalities extend ladder truck lifespans to 18 years. Temporary shelter equipment remains concentrated in hurricane belts, whereas mountaineering equipment serves alpine rescue teams. A residual "other" balancer of decontamination units and portable generators tracks overall growth in the emergency and disaster response market.
Improving sensor accuracy, utilizing heads-up displays, and implementing over-the-air firmware upgrades make threat detection equipment a magnet for innovation. 3M's M7 SCBA overlays thermal detail on the visor, lightening cognitive load in smoky interiors. Smiths Detection's handheld Raman device, honored with a Queen's Award in 2025, migrated aviation-security algorithms into field detection tasks, demonstrating cross-sector tech transfer. As climate events increase the risk of hazardous-materials spills, procurement officers view high-fidelity threat detectors as force multipliers. Vendors that bundle analytics subscriptions with hardware are capturing sticky software margins, reinforcing the broader shift from hardware to software in the emergency and disaster response market.
Complete Report Scope:
- By Equipment
- Threat Detection Equipment
- Personal Protection Gear
- Medical Equipment
- Temporary Shelter Equipment
- Mountaineering Equipment
- Fire-Fighting Equipment
- Other Equipment
- By Platform
- Land
- Marine
- Airborne
- By Solution
- Hardware
- Software
- Services
- By Geography
- North America
- United States
- Canada
- Mexico
- Europe
- United Kingdom
- France
- Germany
- Russia
- Rest of Europe
- Asia-Pacific
- China
- India
- Japan
- South Korea
- Rest of Asia-Pacific
- South America
- Brazil
- Rest of South America
- Middle East and Africa
- Middle East
- Saudi Arabia
- United Arab Emirates
- Israel
- Rest of Middle East
- Africa
- South Africa
- Rest of Africa
- Middle East
- North America
Geography Analysis
North America accounted for 37.15% of 2025 revenue, driven by robust FEMA grant streams and mandatory technology refresh cycles. Growth moderates to a 3.5% CAGR through 2031 as the installed base saturates and the spending mix skews toward software. Canada funneled CAD 1.1 billion (USD 810 million) into Indigenous community infrastructure, expanding previously underserved sub-markets. Mexico is modernizing its seismic alert grid with 2,100 accelerometers to cut warning latency below 10 seconds.
The Asia-Pacific region leads expansion with a 5.20% CAGR, proving to be the most dynamic emergency and disaster response market. China has invested approximately USD 6.5 billion in provincial AI-enabled command centers and aims to achieve 90% digital workflow adoption by 2027. India's mesh-radio rollout and Japan's AI forecasting pilots exemplify leapfrogging directly to advanced architectures. South Korea's 5G public safety network already covers 98% of the population, enabling live video feeds from incident scenes. Indonesia procured 85 amphibious rescue vehicles following the 2024 floods, whereas Australia is standardizing communications following the 2024 review.
Europe continues to strengthen its emergency response landscape, driven by the rescEU pooling model and a continent-wide directive that hardens critical entities across provincial and municipal agencies. Germany is upgrading its geofenced alert network, while France has commissioned multi-role Airbus helicopters to bolster aerial medical evacuation and firefighting capacity, as well as early warning data fusion systems. The UK is approaching full coverage on its new broadband emergency services network, although device certification remains a hurdle. Russian agencies are focusing on domestically produced platforms amid ongoing sanctions. Sovereign capability programs are also rising in the Gulf, and new funding mechanisms are emerging in Brazil and South Africa to offset fiscal constraints.
- Honeywell International Inc.
- Motorola Solutions, Inc.
- Everbridge, Inc.
- Hexagon AB
- Rosenbauer International AG
- Textron Systems Corporation (Textron Inc.)
- Leonardo S.p.A.
- REV Group, Inc.
- 3M Company
- Smiths Group plc
- De Havilland Aircraft of Canada Limited.
- Emergency One Group
- Juvare, LLC
- Esri Global, Inc.
- Darley
- Albert Ziegler GmbH
- Magirus GmbH
- IBM Corporation
Additional Benefits:
- The market estimate (ME) sheet in Excel format
- 3 months of analyst support
TABLE OF CONTENTS
1 INTRODUCTION
- 1.1 Study Assumptions and Market Definition
- 1.2 Scope of the Study
2 RESEARCH METHODOLOGY
3 EXECUTIVE SUMMARY
4 MARKET LANDSCAPE
- 4.1 Market Overview
- 4.2 Market Drivers
- 4.2.1 Rising frequency and severity of natural disasters
- 4.2.2 Government funding and regulatory mandates
- 4.2.3 Technological advances in AI, IoT, GIS and drones
- 4.2.4 Satellite-independent mesh networking adoption
- 4.2.5 Hybrid/e-powertrain shift in response vehicles
- 4.2.6 Cross-border mutual-aid procurement pools
- 4.3 Market Restraints
- 4.3.1 Budget constraints in developing economies
- 4.3.2 Complex and fragmented interoperability standards
- 4.3.3 Cyber-attack risk on connected response systems
- 4.3.4 Skilled-operator shortage for advanced assets
- 4.4 Value Chain Analysis
- 4.5 Regulatory Landscape
- 4.6 Technological Outlook
- 4.7 Porter's Five Forces Analysis
- 4.7.1 Bargaining Power of Suppliers
- 4.7.2 Bargaining Power of Buyers/Consumers
- 4.7.3 Threat of New Entrants
- 4.7.4 Threat of Substitute Products
- 4.7.5 Intensity of Competitive Rivalry
5 MARKET SIZE AND GROWTH FORECASTS (VALUE)
- 5.1 By Equipment
- 5.1.1 Threat Detection Equipment
- 5.1.2 Personal Protection Gear
- 5.1.3 Medical Equipment
- 5.1.4 Temporary Shelter Equipment
- 5.1.5 Mountaineering Equipment
- 5.1.6 Fire-Fighting Equipment
- 5.1.7 Other Equipment
- 5.2 By Platform
- 5.2.1 Land
- 5.2.2 Marine
- 5.2.3 Airborne
- 5.3 By Solution
- 5.3.1 Hardware
- 5.3.2 Software
- 5.3.3 Services
- 5.4 By Geography
- 5.4.1 North America
- 5.4.1.1 United States
- 5.4.1.2 Canada
- 5.4.1.3 Mexico
- 5.4.2 Europe
- 5.4.2.1 United Kingdom
- 5.4.2.2 France
- 5.4.2.3 Germany
- 5.4.2.4 Russia
- 5.4.2.5 Rest of Europe
- 5.4.3 Asia-Pacific
- 5.4.3.1 China
- 5.4.3.2 India
- 5.4.3.3 Japan
- 5.4.3.4 South Korea
- 5.4.3.5 Rest of Asia-Pacific
- 5.4.4 South America
- 5.4.4.1 Brazil
- 5.4.4.2 Rest of South America
- 5.4.5 Middle East and Africa
- 5.4.5.1 Middle East
- 5.4.5.1.1 Saudi Arabia
- 5.4.5.1.2 United Arab Emirates
- 5.4.5.1.3 Israel
- 5.4.5.1.4 Rest of Middle East
- 5.4.5.2 Africa
- 5.4.5.2.1 South Africa
- 5.4.5.2.2 Rest of Africa
- 5.4.5.1 Middle East
- 5.4.1 North America
6 COMPETITIVE LANDSCAPE
- 6.1 Market Concentration
- 6.2 Strategic Moves
- 6.3 Market Share Analysis
- 6.4 Company Profiles (includes Global level Overview, Market level overview, Core Segments, Financials, Strategic Info, Market Rank/Share, Products and Services, and Recent Developments)
- 6.4.1 Honeywell International Inc.
- 6.4.2 Motorola Solutions, Inc.
- 6.4.3 Everbridge, Inc.
- 6.4.4 Hexagon AB
- 6.4.5 Rosenbauer International AG
- 6.4.6 Textron Systems Corporation (Textron Inc.)
- 6.4.7 Leonardo S.p.A.
- 6.4.8 REV Group, Inc.
- 6.4.9 3M Company
- 6.4.10 Smiths Group plc
- 6.4.11 De Havilland Aircraft of Canada Limited.
- 6.4.12 Emergency One Group
- 6.4.13 Juvare, LLC
- 6.4.14 Esri Global, Inc.
- 6.4.15 Darley
- 6.4.16 Albert Ziegler GmbH
- 6.4.17 Magirus GmbH
- 6.4.18 IBM Corporation
7 MARKET OPPORTUNITIES AND FUTURE OUTLOOK
- 7.1 White-space and Unmet-Need Assessment