|
시장보고서
상품코드
2114601
네트워크 에뮬레이터 : 시장 점유율 분석, 업계 동향 및 통계, 성장 예측(2026-2031년)Network Emulator - Market Share Analysis, Industry Trends & Statistics, Growth Forecasts (2026 - 2031) |
||||||
 Mordor Intelligence
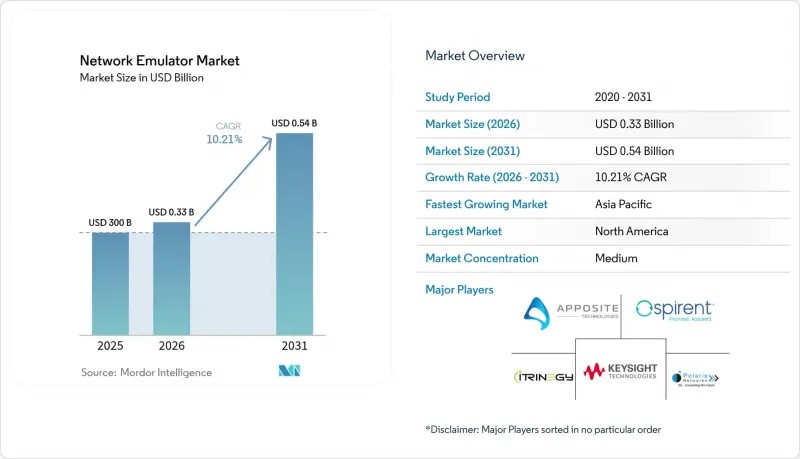
Mordor Intelligence에 의하면, 네트워크 에뮬레이터 시장 규모는 2025년에 3억 달러로 평가되었습니다. 2026년 3억 3,063만 달러에서 2031년까지 5억 3,810만 달러에 이를 것으로 추정되고 예측 기간(2026-2031년) CAGR은 10.21%를 나타낼 전망입니다.
본 보고서는 구성 요소(하드웨어, 소프트웨어, 서비스), 용도(SD-WAN 및 SASE, 클라우드 및 데이터센터 등), 최종 사용자 산업(통신 서비스 제공업체, 국방·항공우주, 에너지·유틸리티 등), 네트워크 유형(5G/LTE, Wi-Fi 6/7 등),및 지역별로 분류되어 있습니다.
세계의 네트워크 에뮬레이터 시장 동향 및 인사이트
5G 독립형 코어(SA)의 도입이 실시간 테스트 수요를 가속화
2024년에는 5G 독립형(Standalone) 가입자 수가 12억 건에 달했으며, 중국과 인도가 절대 수치 기준으로 가장 큰 증가세를 기록했습니다. 통신 사업자들은 현재 LTE 앵커 없이 서비스 기반 인터페이스, 네트워크 슬라이싱 및 마이크로초 단위의 동기화를 검증해야 합니다. NTT DoCoMo와 Keysight가 공동으로 진행한 실험은 Tier 1 통신사가 실제 환경 구축 전에 빔 포밍 및 URLLC 시나리오를 재현하기 위해 에뮬레이션에 어떻게 의존하고 있는지를 보여줍니다. 이러한 고정밀 요구 사항은 자동차 V2X 및 산업 자동화 분야로도 확산되고 있으며, 결정론적 타이밍을 구현하는 네트워크 에뮬레이터에 대한 수요를 높이고 있습니다.
SD-WAN 및 SASE의 기업 도입이 급증
MPLS에서 소프트웨어 정의 패브릭으로 전환하는 기업들은 동적인 경로 선택 로직과 제로 트러스트 정책을 대규모로 검증해야 합니다. VIAVI의 TeraVM은 수천 개의 VPN 클라이언트를 에뮬레이션하여 SASE 링크에 대한 스트레스 테스트를 수행합니다. Sixt가 Cato Networks 도입을 통해 지연 시간을 15% 줄였다는 사례는 도입 전 검증이 이제 경영진 수준에서 필수 요건이 된 이유를 여실히 보여줍니다. 각 벤더들이 네트워크와 보안을 단일 벤더의 클라우드로 통합함에 따라, 네트워크 에뮬레이터 시장은 멀티테넌트형 SaaS 테스트 모델로 확대되고 있습니다.
나노초 정밀도의 장애 시뮬레이션용 하드웨어 공급 부족
고빈도 거래 업체들은 130개 이상의 거래소에서 5-85나노초의 정밀도를 요구하고 있지만, IEEE-1588 규격을 준수하는 제품을 대량으로 공급할 수 있는 그랜드마스터 클럭용 실리콘 벤더는 극소수에 불과합니다. MiFID II에 따라 은행들은 NTP에서 PTP로의 전환을 강요받고 있으며, 이로 인해 하드웨어 비용이 증가하고 리드 타임이 길어지고 있습니다. 이와 유사한 엄격한 타이밍 요구 사항이 현재 URLLC 및 V2X에도 적용되고 있어, 상용 어플라이언스에 의존하는 부문에서의 급속한 보급을 제약하고 있습니다.
부문별 분석
2025년, 네트워크 에뮬레이터 시장에서 하드웨어의 점유율은 60.20%를 유지했습니다. 이는 400/800G 이더넷 및 mm파 5G 전용 구현 어플라이언스가 기여한 결과입니다. 그러나 서비스 매출은 연평균 성장률(CAGR) 13.89%로 증가하여 다른 어떤 구성 요소보다 높은 성장률을 보이고 있습니다. 키사이트(Keysight)에 따르면, 소프트웨어 및 서비스는 현재 총 매출의 39%를 차지하고 있으며, 2025년 1분기에는 ARR(연간 반복 매출)이 16% 성장했습니다. 각 벤더들은 일회성 장비 도입이 아닌 DevSecOps 파이프라인 전반에 걸친 지속적인 테스트를 통해 수익을 창출하기 위해 영구 라이선스와 관리형 지원을 번들로 제공합니다.
이러한 변화는 클라우드 네이티브 디어그리게이션에 기인합니다. 고객들은 랩 수요에 따라 탄력적으로 확장할 수 있는 구독형 Test-as-a-Service를 선호하는 추세입니다. Rohde & Schwarz는 5G 빔포밍 및 MIMO 벤치마킹을 수행하는 분석 서비스를 제공하여 통신 사업자가 사내에서 도구를 마련해야 하는 부담을 덜어주고 있습니다. 한편, Anritsu의 MT8000A와 같은 모듈식 섀시는 펌웨어 키를 통해 수명을 연장하고, 자본 지출(CAPEX)을 억제하면서 사용자를 지속적인 지원으로 유도하고 있습니다. 이러한 서비스의 급증은 구조적인 전환점이며, 하드웨어의 평균 판매 가격(ASP)이 정체되더라도 네트워크 에뮬레이터 업계가 수익성을 유지할 수 있도록 보장합니다.
SD-WAN 및 SASE는 MPLS 오프로드 프로젝트에 힘입어 2025년에도 매출액 기준 31.12%로 1위를 유지했습니다. 그러나 5G RAN 및 코어 검증은 연평균 성장률(CAGR) 13.12%를 기록하며 가장 빠르게 성장하는 용도으로, 전 세계적으로 독립형 방식이 확산되고 있음을 반영합니다. 5G 테스트 시스템용 네트워크 에뮬레이터 시장 규모는 네트워크 슬라이싱, URLLC 및 비지상파 네트워크로 인해 프로토콜의 복잡성이 증가함에 따라 꾸준히 확대될 것으로 예측됩니다.
Open-RAN 상호 운용성 검증에는 RF 임페어먼트 셸프와 클라우드 PaaS 시뮬레이터를 결합한 에뮬레이터가 필요합니다. Rohde & Schwarz와 VIAVI의 공동 솔루션은 O-RU 적합성 키트를 제공하며, 제조업체에 NTIA 자금 지원 대상이 될 수 있는 턴키 솔루션을 제공합니다. 이와 동시에, Spirent의 A1 400G 플랫폼은 AI 데이터센터 패브릭을 대상으로 하며, 통신 분야를 넘어선 고밀도 이더넷에 대한 수요를 예측했습니다. SD-WAN 도입이 늦어졌던 중소기업에도 점차 확산됨에 따라 성장세는 둔화되고 있지만, 기존 도입 기업들은 여전히 유지보수 부담이 큰 라이선스를 계속 구매하고 있어 수익을 뒷받침하고 있습니다.
지역별 분석
북미는 5G 미드밴드 구축, 월스트리트의 지연 시간 규제, 그리고 지속적인 복원력 테스트를 의무화하는 대통령령 14144호 등 사이버 보안 관련 법규의 뒷받침을 받아 2025년 매출의 37.35%를 차지했습니다. 이 지역에는 VIAVI, Keysight 및 Spirent의 이더넷 사업부 본사가 위치해 있어 연구 개발이 집중되어 있을 뿐만 아니라, 홈 마켓으로서의 우위도 강화되고 있습니다. 실리콘 밸리와 버지니아주 북부에 위치한 AI 중심 데이터센터는 800G 트래픽 에뮬레이션의 초기 도입자로, 이 지역의 판매 파이프라인을 활성화하고 있습니다.
아시아태평양은 연평균 성장률(CAGR) 13.05%를 기록하며 가장 빠르게 성장하는 지역입니다. 중국과 인도에서는 독립형 5G가 대규모로 구축되고 있으며, 현지 OEM 업체들은 첨단 에뮬레이션 장비 조달을 서둘러야 하는 상황입니다. 쿠알라룸푸르에서는 5G 다운로드 속도의 중앙값이 이미 524 Mbps에 달하며, 주파수 대역의 적극적인 활용이 두드러지고 있습니다. 일본에서는 ISL Networks의 5GC 서버 등 오픈소스 중심의 테스트 랩이 육성되고 있어, 지방 통신망을 확충하는 국내 통신 사업자들에게 TCO 절감 효과를 제공합니다. 일본 및 한국의 자동차 공급망에서는 TSN 및 이더넷 검증에 대한 수요가 증가하고 있습니다.
유럽에서는 성숙 단계에 접어들었음에도 꾸준한 확장이 관찰됩니다. WEEE 지침 2012/19/EU에 따라 공급업체는 재활용 가능한 테스트 장비를 설계해야 할 의무가 있으며, 이로 인해 BOM(부품표)에 대한 심사가 강화되고 모듈식 및 소프트웨어 정의 섀시로 전환이 촉진되고 있습니다. 독일의 자동차 클러스터는 차량 내 네트워크 테스트에 투자하고 있는 반면, EU가 개방적이고 안전한 공급망을 중시함에 따라 Open-RAN 준수가 전략적 우선 과제가 되었으며, NTIA의 관련 자금 지원 프로그램을 통해 지원받고 있습니다. 아프리카와 같은 소규모 시장에서는 예산 제약으로 인해 통신 사업자들이 오픈소스 및 간단한 상용 도구에 의존할 수밖에 없지만, 장기적인 4G에서 5G로의 업그레이드 로드맵에 따라 평균 판매 가격(ASP)은 점차 상승할 전망입니다.
기타 혜택 :
- 엑셀 형식 시장 예측(ME) 시트
- 3개월간의 애널리스트 지원
자주 묻는 질문
목차
제1장 서론
제2장 조사 방법
제3장 시장 구도
제4장 시장 규모 및 성장 예측
제5장 경쟁 구도
제6장 시장 기회 및 향후 전망
KTH 26.08.28According to Mordor Intelligence, the network emulator market size was valued at USD 300 million in 2025 and estimated to grow from USD 330.63 million in 2026 to reach USD 538.1 million by 2031, at a CAGR of 10.21% during the forecast period (2026-2031).
This report is Segmented by Component (Hardware, Software, and Services), Application (SD-WAN and SASE, Cloud and Data Center, and More), End-User Vertical (Telecommunication Service Providers, Defense and Aerospace, Energy and Utilities, and More), Network Type (5G / LTE, Wi-Fi 6/7, and More), and Geography
Global Network Emulator Market Trends and Insights
5G Stand-Alone Core Roll-outs Accelerating Real-Time Test Demand
Standalone 5G subscriptions reached 1.2 billion in 2024, with China and India adding the largest absolute numbers. Operators must now validate service-based interfaces, network slicing, and microsecond synchronization without LTE anchors. NTT DoCoMo's lab work with Keysight illustrates how tier-1 carriers rely on emulation to replicate beamforming and URLLC scenarios before field deployment. Precision requirements spill over into automotive V2X and industrial automation, elevating demand for network emulators that deliver deterministic timing.
Surge in SD-WAN and SASE Enterprise Deployments
Enterprises shifting from MPLS to software-defined fabrics need to prove dynamic path-selection logic and zero-trust policies at scale. VIAVI's TeraVM emulates thousands of VPN clients to stress-test SASE links. Real-world evidence such as Sixt reducing latency 15% after adopting Cato Networks underscores why pre-deployment validation is now a board-level mandate. As vendors converge networking and security into single-vendor clouds, the network emulator market is widening toward multi-tenant SaaS test models.
Limited Availability of Nanosecond-Precision Impairment Hardware
High-frequency traders demand 5-85 ns precision across 130+ exchanges, yet only a handful of Grandmaster-clock silicon vendors can meet IEEE-1588 compliance at volume. MiFID II pushes banks to migrate from NTP to PTP, inflating hardware costs and lengthening lead times. Similar timing rigor now applies to URLLC and V2X, constraining rapid uptake in segments that rely on off-the-shelf appliances.
Other drivers and restraints analyzed in the detailed report include:
- Adoption of Cloud-Native Network Digital Twins for DevSecOps
- Growing Regulatory Focus on Critical-Infrastructure Resiliency Testing
- Fragmented Open-Source Tools Diluting Commercial ROI
For complete list of drivers and restraints, kindly check the Table Of Contents.
Segment Analysis
Hardware retained 60.20% share of the network emulator market in 2025, thanks to purpose-built impairment appliances for 400/800 G Ethernet and millimeter-wave 5G. Yet services revenue is pacing a 13.89% CAGR, outstripping any other component. Keysight reported that software-and-services now account for 39% of total sales, posting 16% ARR growth in Q1 2025, according to Keysight. Vendors are bundling perpetual licenses with managed support to monetize continuous testing across DevSecOps pipelines rather than one-time equipment drops.
The shift stems from cloud-native disaggregation: customers prefer subscription test-as-a-service that scales elastically with lab demand. Rohde & Schwarz positions its analytics service to benchmark 5G beamforming and MIMO, relieving operators from in-house tooling. Meanwhile, modular chassis like Anritsu's MT8000A extend lifespan through firmware keys, protecting capex while steering users toward recurring support. This service surge is a structural pivot, ensuring that the network emulator industry maintains profitability even as hardware ASPs flatten.
SD-WAN and SASE retained 31.12% revenue leadership in 2025, buoyed by MPLS offload projects. However, 5G RAN and Core verification is the fastest-rising application at a 13.12% CAGR, reflecting worldwide standalone roll-outs. The network emulator market size for 5G test systems is projected to expand steadily as network slicing, URLLC, and non-terrestrial networking add layers of protocol complexity.
Open-RAN interoperability checks need emulators that pair RF impairment shelves with cloud PaaS simulators. Joint solutions from Rohde & Schwarz and VIAVI deliver O-RU conformance kits, giving manufacturers a turnkey route to NTIA funding eligibility. In parallel, Spirent's A1 400G platform targets AI data-center fabrics, previewing demand beyond telecom toward high-density Ethernet. As SD-WAN penetrates even late-adopter SMBs, its growth moderates, but the installed base continues to purchase maintenance-heavy licenses, sustaining revenue.
Complete Report Scope:
- By Component
- Hardware
- Software
- Services
- By Application
- SD-WAN and SASE
- Cloud and Data-Centre
- IoT and Industrial
- 5G RAN and Core
- Satellite and Aerospace
- By End-user Vertical
- Telecommunication Service Providers
- Defense and Aerospace
- Banking and Financial Services
- Technology and Cloud Providers
- Automotive and Transportation
- Energy and Utilities
- Other Enterprises
- By Network Type
- 5G / LTE
- Wi-Fi 6/7
- Ethernet/IP
- LEO / GEO Satellite
- By Geography
- North America
- United States
- Canada
- Mexico
- South America
- Brazil
- Argentina
- Europe
- Germany
- United Kingdom
- France
- Italy
- Russia
- Asia Pacific
- China
- India
- Japan
- South Korea
- ASEAN
- Rest of Asia Pacific
- Middle East
- Saudi Arabia
- UAE
- Turkey
- Rest of Middle East
- Africa
- South Africa
- Rest of Africa
- South Africa
- North America
Geography Analysis
North America generated 37.35% of 2025 revenue, propelled by 5G mid-band deployments, Wall Street latency mandates, and cybersecurity statutes such as Executive Order 14144 that compel continuous resilience testing. The same region hosts head offices for VIAVI, Keysight, and Spirent's Ethernet unit, concentrating R&D and reinforcing home-market advantage. AI-centric data-centers in Silicon Valley and Northern Virginia are early adopters of 800 G traffic emulation, catalyzing local sales pipelines.
Asia-Pacific is the fastest-growing region with a 13.05% CAGR. China and India deploy standalone 5G at a massive scale, pushing local OEMs to procure advanced emulation gear. Median 5G download speeds already reach 524 Mbps in Kuala Lumpur, underscoring aggressive spectrum utilization. Japan fosters open-source-driven test labs such as ISL Networks' 5GC server, enabling lower TCO for domestic carriers upgrading rural coverage. Automotive supply chains in Japan and South Korea amplify demand for TSN and Ethernet validation.
Europe shows mature yet steady expansion. The WEEE Directive 2012/19/EU obliges vendors to design recyclable test equipment, increasing BOM scrutiny and nudging a shift toward modular, software-defined chassis. Germany's automotive cluster invests in in-vehicle network testing, while the EU's focus on open, secure supply chains makes Open-RAN conformance a strategic priority supported by NTIA's allied funding window. In smaller Middle East and African markets, budget limits steer operators toward open-source plus light commercial tooling, but the long-term 4G-to-5G upgrade path will slowly lift ASPs.
- Keysight Technologies, Inc.
- Spirent Communications plc
- Viavi Solutions Inc.
- Apposite Technologies, Inc.
- iTrinegy (now part of Calnex Solutions)
- Polaris Networks
- PacketStorm Communications, Inc.
- Aukua Systems, Inc.
- InterWorking Labs (IWL)
- GigaNet Systems
- Candela Technologies
- GL Communications
- Calnex Solutions plc
- Anritsu Corporation
- Rohde & Schwarz
- OctoScope (Spirent)
- Netropy (Apposite)
- Veryx Technologies
- IP NetFusion
- JDS Test & Measurement
Additional Benefits:
- The market estimate (ME) sheet in Excel format
- 3 months of analyst support
TABLE OF CONTENTS
1 INTRODUCTION
- 1.1 Study Assumptions and Market Definition
- 1.2 Scope of the Study
2 RESEARCH METHODOLOGY
3 MARKET LANDSCAPE
- 3.1 Market Overview
- 3.2 Market Drivers
- 3.2.1 5G Stand-Alone Core roll-outs accelerating real-time test demand
- 3.2.2 Surge in SD-WAN and SASE enterprise deployments
- 3.2.3 Adoption of cloud-native network digital-twins for DevSecOps
- 3.2.4 Growing regulatory focus on critical-infrastructure resiliency testing
- 3.2.5 Proliferation of LEO?satellite broadband driving multi-link emulation
- 3.2.6 Automotive software-defined vehicle (SDV) validation requirements
- 3.3 Market Restraints
- 3.3.1 Limited availability of nanosecond-precision impairment hardware
- 3.3.2 Fragmented open-source tools diluting commercial ROI
- 3.3.3 Budget freezes in 4G-focused CSPs of emerging economies
- 3.3.4 Environmental regulations on electronic test-bed e-waste
- 3.4 Value Chain Analysis
- 3.5 Regulatory Landscape
- 3.6 Technological Outlook
- 3.7 Porter's Five Forces Analysis
- 3.7.1 Threat of New Entrants
- 3.7.2 Bargaining Power of Buyers
- 3.7.3 Bargaining Power of Suppliers
- 3.7.4 Threat of Substitutes
- 3.7.5 Intensity of Rivalry
4 MARKET SIZE AND GROWTH FORECASTS (VALUE)
- 4.1 By Component
- 4.1.1 Hardware
- 4.1.2 Software
- 4.1.3 Services
- 4.2 By Application
- 4.2.1 SD-WAN and SASE
- 4.2.2 Cloud and Data-Centre
- 4.2.3 IoT and Industrial
- 4.2.4 5G RAN and Core
- 4.2.5 Satellite and Aerospace
- 4.3 By End-user Vertical
- 4.3.1 Telecommunication Service Providers
- 4.3.2 Defense and Aerospace
- 4.3.3 Banking and Financial Services
- 4.3.4 Technology and Cloud Providers
- 4.3.5 Automotive and Transportation
- 4.3.6 Energy and Utilities
- 4.3.7 Other Enterprises
- 4.4 By Network Type
- 4.4.1 5G / LTE
- 4.4.2 Wi-Fi 6/7
- 4.4.3 Ethernet/IP
- 4.4.4 LEO / GEO Satellite
- 4.5 By Geography
- 4.5.1 North America
- 4.5.1.1 United States
- 4.5.1.2 Canada
- 4.5.1.3 Mexico
- 4.5.2 South America
- 4.5.2.1 Brazil
- 4.5.2.2 Argentina
- 4.5.3 Europe
- 4.5.3.1 Germany
- 4.5.3.2 United Kingdom
- 4.5.3.3 France
- 4.5.3.4 Italy
- 4.5.3.5 Russia
- 4.5.4 Asia Pacific
- 4.5.4.1 China
- 4.5.4.2 India
- 4.5.4.3 Japan
- 4.5.4.4 South Korea
- 4.5.4.5 ASEAN
- 4.5.4.6 Rest of Asia Pacific
- 4.5.5 Middle East
- 4.5.5.1 Saudi Arabia
- 4.5.5.2 UAE
- 4.5.5.3 Turkey
- 4.5.5.4 Rest of Middle East
- 4.5.6 Africa
- 4.5.6.1 South Africa
- 4.5.6.2 Rest of Africa
- 4.5.6.3 South Africa
- 4.5.1 North America
5 COMPETITIVE LANDSCAPE
- 5.1 Market Concentration
- 5.2 Strategic Moves
- 5.3 Market Share Analysis
- 5.4 Company Profiles (includes Global level Overview, Market level overview, Core Segments, Financials as available, Strategic Information, Market Rank/Share for key companies, Products and Services, and Recent Developments)
- 5.4.1 Keysight Technologies, Inc.
- 5.4.2 Spirent Communications plc
- 5.4.3 Viavi Solutions Inc.
- 5.4.4 Apposite Technologies, Inc.
- 5.4.5 iTrinegy (now part of Calnex Solutions)
- 5.4.6 Polaris Networks
- 5.4.7 PacketStorm Communications, Inc.
- 5.4.8 Aukua Systems, Inc.
- 5.4.9 InterWorking Labs (IWL)
- 5.4.10 GigaNet Systems
- 5.4.11 Candela Technologies
- 5.4.12 GL Communications
- 5.4.13 Calnex Solutions plc
- 5.4.14 Anritsu Corporation
- 5.4.15 Rohde & Schwarz
- 5.4.16 OctoScope (Spirent)
- 5.4.17 Netropy (Apposite)
- 5.4.18 Veryx Technologies
- 5.4.19 IP NetFusion
- 5.4.20 JDS Test & Measurement
6 MARKET OPPORTUNITIES AND FUTURE OUTLOOK
- 6.1 White-space and Unmet-need Assessment