
|
시장보고서
상품코드
2114741
위조 의약품 탐지 기기 시장 : 점유율 분석, 업계 동향과 통계, 성장 예측(2026-2031년)Counterfeit Drug Detection Device - Market Share Analysis, Industry Trends & Statistics, Growth Forecasts (2026 - 2031) |
||||||
 Mordor Intelligence
Mordor Intelligence에 의하면, 위조 의약품 탐지 기기 시장 규모는 2025년 15억 3,000만 달러에서 2026년에는 16억 3,000만 달러로 확대되어 2026년부터 2031년까지 CAGR 6.30%로 성장을 지속하여, 2031년에는 22억 1,000만 달러에 이를 것으로 예측됩니다.
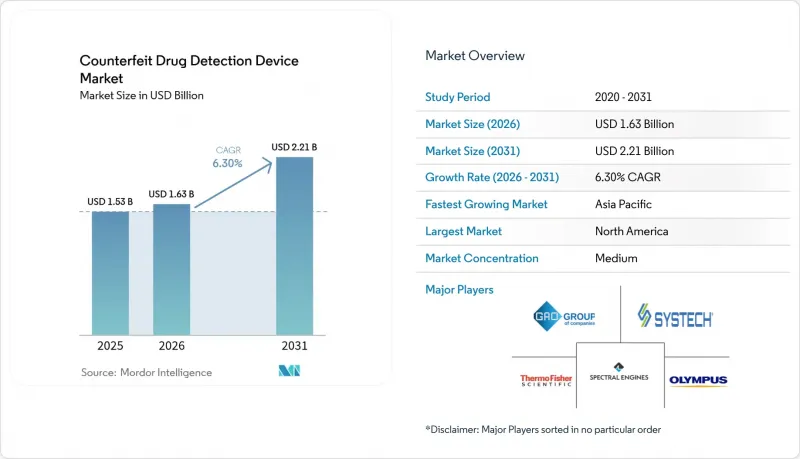
본 보고서는 기술별(적외선·근적외선 분광법 등), 형태별(휴대용 기기 등), 용도별(화학 조성 검증 등), 최종 사용자별(제약 제조업체 등), 지역별(북미, 유럽, 아시아태평양, 중동 및 아프리카, 남미)로 분류되어 있습니다. 시장 예측은 금액(달러) 기준으로 제시되어 있습니다.
전 세계 위조 의약품 탐지 기기 시장 동향 및 인사이트
고도화된 공급망 모니터링에 대한 집중
현재 전 세계 규제 당국은 종단 간 가시성을 요구하고 있으며, 검출 방식은 산발적인 불시 점검에서 지속적인 추적성으로 변화하고 있습니다. 미국의 ‘의약품 공급망 보안법(DSSA)’에서는 패키지 단위의 일련번호 데이터를 전자적이고 상호 운용 가능한 방식으로 교환하도록 규정하고 있으며, 공급망의 각 노드는 소유권 이전 전에 진위 여부를 검증할 의무가 있습니다. 유럽연합(EU)과 걸프협력회의(GCC)의 병행된 노력으로 일련번호 형식이 통일되어, 다국적 기업들은 규정 준수 워크플로우를 효율화할 수 있게 되었습니다. 이에 따라 각 의료기기 공급업체들은 분광 분석 플랫폼에 2D 데이터 매트릭스 디코더, RFID 판독기, 클라우드 커넥터를 통합하고 있습니다. 나이지리아에서는 사상 최고치인 70%의 위조품 보급률이 기록되었으며, 이는 디지털 기반이 성숙해지면 개발도상국 시장에서도 투자가 가속화될 것임을 여실히 보여줍니다. 저지연 데이터 공유가 사업 운영의 필수 조건이 됨에 따라, 조달 사양서에는 분석 성능뿐만 아니라 시스템 통합에 대한 대응 체계가 점점 더 명확히 명시되고 있습니다.
포장에서 투여 단위 수준의 보안으로의 전환
위조업자들은 정품의 2차 포장을 재사용하는 경우가 많기 때문에 패키지 수준의 마커 신뢰도는 떨어지고 있습니다. 제약 기업들은 현재 정제나 캡슐에 미세한 식별자를 삽입하고 있으며, 투여 단위 자체에 존재하는 화학적 또는 광학적 특징을 판독할 수 있는 광학 기술에 대한 수요를 주도하고 있습니다. 아시아태평양의 제네릭 의약품 제조업체들은 인도가 매출 상위 분자에 대해 QR 코드 도입을 의무화한 데 따라 이러한 변화를 주도하고 있습니다. 제형 표면에 결합된 SERS 마이크로 기판은 신속한 확인 판독을 가능하게 하며, 좁은 시야 탐지를 위해 구성된 휴대용 이미저를 통해 인라인 공정에의 도입을 보장합니다. 의약품 규제 당국은 이러한 추세를 환영하고 있습니다. 제형에 직접 부착된 기기는 의약품과 함께 이동하기 때문에 국경 검사 절차가 간소화되고, 전용 위험이 감소하기 때문입니다. 또한, 이러한 설계 개선을 통해 분석 담당자가 1차 포장을 개봉하지 않고도 의심스러운 로트를 검증할 수 있게 되어 조사 주기도 단축됩니다.
개발도상 지역에서의 낮은 인지도
1차 의료 예산이 여전히 부족한 지역에서는 진위 확인 기술에 대한 오해가 뿌리 깊게 남아 있습니다. 에티오피아의 조사에 따르면, 위조품 식별 기술에 대한 교육을 받은 약사는 고작 12%에 불과하여, 외부 자금을 통한 기기 지원이 있더라도 도입이 저해되고 있습니다. 제조업체들은 가상 교육 모듈을 결합한 기부 프로그램을 통해 이러한 부족함을 보완하려 하고 있지만, 네트워크 연결 환경의 격차가 원격 학습의 걸림돌이 되고 있습니다. 지역 규제 당국에는 압수된 샘플을 검증할 법과학 연구소가 부족한 경우가 많아, 일선에서 근무하는 임상의들에게 기기의 가치를 설명하는 데 필요한 피드백 루프가 차단되고 있습니다. 정부가 의약품 안전성 감시 교육 과정을 광범위하고 공식적으로 도입하기 전까지는 이러한 지역의 보급률은 세계 평균보다 계속 낮을 것입니다.
부문 분석
2025년 기준, 라만 분광법을 이용한 위조 의약품 탐지 기기 시장 규모는 40.92%를 차지했습니다. 이러한 기반에도 불구하고, SERS는 2031년까지 연평균 성장률(CAGR) 8.94%로 성장하여 모든 경쟁 기술을 앞지르며 매출 격차를 빠르게 좁혀갈 것으로 예측됩니다. 라만법이 우위를 점하고 있는 것은 비파괴적 특성과 최소한의 시료 전처리에 기인하지만, 위조업자들이 분자 구조가 유사한 혼입 물질로 전환함에 따라 기존의 라만법은 검출 한계에 도달하고 있습니다. SERS는 라만 신호를 증폭하는 플라즈모닉 나노 구조를 채택하여, 생물학적 제제 및 규제 물질에 있어 중요한 기준인 1 ppm 미만의 검출 한계를 실현하고 있습니다. 각 기기 제조업체는 AI 모델을 통합하여 배경 형광을 자동으로 보정하는 기능을 구현하고 있으며, 이를 통해 현장 직원이 측정 결과를 정확하게 해석할 수 있게 되었습니다. 적외선(IR) 및 근적외선(NIR) 방식은 부형제 검증에 있어 여전히 경제적인 선택지로 활용되고 있지만, 마이크로플루이딕스식 랩온칩 플랫폼은 시료 희석과 광학 측정을 단일 카트리지에서 통합함으로써 고처리량의 배치 출시에 유용합니다. 광학 분야 이외에서는 RFID와 블록체인을 결합한 태깅 기술이 가장 빠르게 보급되고 있으며, 위조 불가능한 이력 기록을 제공함으로써 분광 측정 결과를 보완하고 있습니다.
기술의 융합으로 인해 60초 이내에 라만, 형광, 초분광 영상을 순차적으로 실행할 수 있는 멀티모달 플랫폼의 개발이 가속화되고 있으며, 식별 확실성이 극대화되고 있습니다. 이전에는 분석 기능별로 분할되어 있던 자본 예산이 통합되고 있으며, 부서 간 통합 검출 스택의 조달이 진행되고 있습니다. 단일 광학 기법에만 초점을 맞추고 있는 스타트업은 데이터 분석 기업과 제휴하지 않는 한, 시장에서 존재감이 희미해질 위험이 있습니다. 스펙트럼 클라우드 저장소를 통해 참조 라이브러리에 대한 접근이 민주화되고 있지만, 유럽의 데이터 주권 관련 규제로 인해 일부 의약품 수탁 제조업체에서는 On-Premise 도입이 의무화되어 있어, 클라우드 도입 현황에 지역별 차이가 발생하고 있습니다.
2025년 기준, 위조 의약품 탐지 기기 시장에서 핸드헬드형 기기의 점유율은 51.05%를 차지했습니다. 휴대용 백팩 시스템은 레이저의 소형화와 온보드에서 화학계측 처리를 수행하는 GPU 탑재 마이크로컨트롤러의 혜택을 받아, 2031년까지의 연평균 성장률(CAGR)은 8.11%로 성장을 지속하고, 있습니다. 최종 사용자는 워크플로우의 처리 능력과 시료 접근성을 기준으로 측정 방식을 평가합니다. 창고 검사 담당자는 블리스터 팩을 몇 초 만에 스캔할 수 있는 핸드헬드형을 선호하는 반면, 현장 감시 팀은 더 깊은 투과 광학 성능을 갖춘 백팩형 기기를 선택하여 드럼통이나 IBC 토트를 분석했습니다. 벤치탑형 위조 의약품 탐지 기기 시장 규모는 규제된 환경에서 고정형 설치 및 최고 분해능 사양이 요구되는 품질 관리(QC) 실험실에서 여전히 견조한 추세를 보이고 있습니다.
새롭게 등장한 모듈식 설계 덕분에 사용자는 핸드헬드 프로브를 대형 베이스 유닛에 도킹하여 분광 범위를 확장할 수 있게 되었으며, 이로 인해 단편적인 범주가 아닌 연속적인 선택지가 생겨났습니다. 병원에서는 조제실에서 카트 탑재형 하이브리드 기기를 시범 도입하여, 휴대성을 저해하지 않으면서 병원 수준의 오염 관리를 실현하고 있습니다. 8시간 가동 주기를 가능하게 하는 배터리 관리 시스템의 통합으로, 가동 시간 제한으로 인해 발생하던 도입에 대한 주저함이 해소되었습니다. 검사 기법의 다양화는 공급망의 분산화와 훌륭하게 부합합니다. 로트 규모의 축소와 환자에게 직접 배송하는 경로의 확대에 따라, 진위성 확인 지점은 공장 경계를 넘어 확장되고 있으며, 제품의 흐름에 맞추어 이동할 수 있는 기기가 요구되고 있습니다.
지역별 분석
북미는 전자 검증을 의무화하는 ‘의약품 공급망 보안법(DSSA)’의 시행 시한을 호재로 삼아, 2025년 위조 의약품 탐지 기기 시장에서 38.22%의 시장 점유율을 유지하고 있습니다. 병원의 조제실이나 전문 도매업체에서의 기기 보급률은 여전히 세계 최고 수준을 유지하고 있으며, 공급업체의 지원 체계는 교정, 규정 준수 교육, 제3자 검증을 포괄하고 있습니다. 유럽연합(EU)에서는 ‘위조 의약품 지침’에 따라 일련번호가 부여된 포장 및 변조 방지 기능이 의무화됨에 따라 시장이 꾸준히 확대되고 있습니다. 베네룩스 국가에서는 분광 분석 스캐너와 연동되는 전국 규모의 블록체인 등록 제도를 선구적으로 도입하여, 진위 확인에 소요되는 시간을 5초 미만으로 단축했습니다.
아시아태평양은 현재 가장 급격한 성장을 보이고 있으며, 중국이 GMP 규제를 강화하고 인도가 처방약 상위 300개 브랜드에 QR 코드 표시를 의무화하는 가운데, 2031년까지의 연평균 성장률(CAGR)은 9.33%를 나타낼 것으로 전망됩니다. 한때 육안 검사에 의존하던 현지 제조업체들은 수출 시장의 감사 요건을 충족하기 위해 휴대용 라만 분광기로의 전환을 추진하고 있습니다. 지역 유통업체들도 정전으로 인해 신속한 합격·불합격 판정이 요구되는 지방의 콜드체인 경로에서 휴대용 SERS 기기를 도입하고 있습니다. 동남아시아 세관 당국은 유럽으로 운송되기 전에 아세안 전역에 걸친 불법 유통을 차단하기 위해 휴대용 스캐너를 채택하고 있습니다.
라틴아메리카 및 중동 및 아프리카는 전 세계 매출에서 차지하는 비중이 10% 미만이지만, 위조품이 특히 빈번하게 발생하는 지역입니다. 나이지리아에서는 위조품 발생률이 높기 때문에 탐지 기기와 역량 개발 워크숍을 결합한 기부금 지원 시범 사업이 진행되고 있습니다. 사우디아라비아의 추적·추적 가능성 플랫폼 ‘Tatmeen’은 GS1 규격을 준수하며, 2차원 데이터 매트릭스 스캔을 지원하는 기기의 구매를 촉진하고 있습니다. 도입 현황은 여전히 공공 부문의 조달 일정이나 다자간 원조 주기에 좌우되지만, 국제적인 의약품 안전성 감시 기준에 대한 꾸준한 부합은 중기적인 성장 가능성을 시사하고 있습니다.
기타 혜택:
- 엑셀 형식 시장 예측(ME) 시트
- 3개월간의 애널리스트 지원
자주 묻는 질문
목차
제1장 서론
제2장 조사 방법
제3장 주요 요약
제4장 시장 구도
제5장 시장 규모와 성장 예측
제6장 경쟁 구도
제7장 시장 기회와 향후 전망
JHS 26.08.26According to Mordor Intelligence, the counterfeit drug detection device market size is expected to grow from USD 1.53 billion in 2025 to USD 1.63 billion in 2026 and is forecast to reach USD 2.21 billion by 2031 at 6.30% CAGR over 2026-2031.
This report is Segmented by Technology (Infrared & Near-Infrared Spectroscopy, and More), Modality (Handheld Devices, and More), Application (Chemical-Composition Verification, and More), End User (Pharmaceutical Manufacturers, and More), and Geography (North America, Europe, Asia-Pacific, Middle East & Africa, South America). The Market Forecasts are Provided in Terms of Value (USD).
Global Counterfeit Drug Detection Device Market Trends and Insights
Emphasis on Advanced Supply-Chain Surveillance
Global regulators now demand end-to-end visibility, transforming detection from sporadic spot checks to continuous traceability. The Drug Supply Chain Security Act in the United States stipulates electronic interoperable exchange of serialized data at the package level, obliging every supply-chain node to validate authenticity before ownership transfer. Parallel efforts in the European Union and Gulf Cooperation Council align serialization formats, allowing multinational companies to streamline compliance workflows. Device vendors therefore embed 2D-data-matrix decode, RFID interrogators, and cloud connectors into spectroscopic platforms. Nigeria's historically high 70% counterfeit prevalence underscores why developing markets also accelerate investment once digital frameworks mature. As low-latency data sharing becomes a license to operate, procurement specifications increasingly list integration readiness alongside analytical performance.
Shift From Packaging to On-Dosage Security
Counterfeiters often recycle authentic secondary packaging, making pack-level markers less reliable. Pharmaceutical firms now embed microscopic identifiers on tablets and capsules, driving demand for optics that can read chemical or photonic signatures resident on the dosage itself. Asia Pacific generics manufacturers champion this shift following India's QR code order for top-selling molecules. SERS micro-substrates bonded to dosage surfaces offer quick confirmatory reads, and portable imagers configured for narrow field-of-view detection ensure in-line process adoption. Drug-regulatory agencies welcome the trend because on-dosage devices travel with the medicine, simplifying border inspection procedures and reducing diversion risk. The design update also shortens investigation cycles because analysts can validate suspect lots without opening primary packs.
Low Awareness in Developing Regions
Misconceptions about authentication technologies persist where primary healthcare budgets remain pressured. Surveys in Ethiopia show only 12% of pharmacists trained on counterfeit recognition techniques, hindering uptake even when external funding subsidizes devices. Manufacturers counter the deficit through donation programs bundled with virtual training modules, yet network connectivity gaps limit remote learning. Regional regulatory agencies often lack forensic labs to validate confiscated samples, suppressing the feedback loop needed to illustrate device value to frontline clinicians. Until governments formalize widespread pharmacovigilance curricula, penetration in these regions will trail global averages.
Other drivers and restraints analyzed in the detailed report include:
- Supportive Government & Regulatory Mandates
- AI-Powered SERS Enabling Sub-PPM Field Tests
- High Upfront Cost of Spectroscopy Devices
For complete list of drivers and restraints, kindly check the Table Of Contents.
Segment Analysis
The counterfeit drug detection device market size for raman spectroscopy accounted for 40.92% in 2025. Despite this base, SERS will outpace all rival techniques with a projected 8.94% CAGR to 2031, narrowing the revenue gap rapidly. Raman's dominance stems from its non-destructive nature and minimal sample prep, yet counterfeiters' switch to molecularly similar adulterants pushes traditional Raman to its detection ceiling. SERS employs plasmonic nano-structures that intensify Raman signals, unlocking a detection threshold below 1 ppm, a crucial benchmark for biologics and controlled substances. Instrument builders integrate AI models to autosubtract background fluorescence, enabling frontline staff to interpret outputs accurately. Infrared (IR) and near-infrared (NIR) methods continue as affordable options for excipient verification, while microfluidic lab-on-chip platforms appeal to high-throughput batch release by merging sample dilution and optical interrogation on a single cartridge. RFID-plus-blockchain tagging rises fastest outside optical families, complementing spectroscopic reads by delivering immutable provenance records.
Technological convergence accelerates multi-modal platforms capable of sequential Raman, fluorescence, and hyperspectral imaging in under 60 seconds, maximizing identification certainty. Capital budgets formerly siloed by analytical function are consolidating, encouraging cross-department procurement of unified detection stacks. Start-ups focusing solely on one optical path risk marginalization unless partnering with data-analytics players. Spectral cloud repositories democratize access to reference libraries, but data-sovereignty rules in Europe compel on-premises deployment among some pharmaceutical contract manufacturers, spawning regional variations in cloud uptake.
Handheld units held a 51.05% of counterfeit drug detection device market share in 2025. Portable backpack systems now record an 8.11% CAGR through 2031, benefiting from miniaturized lasers and GPU-equipped micro-controllers that execute onboard chemometrics. End-users evaluate modalities against workflow throughput and sample accessibility: warehouse inspectors favor handhelds that scan blister packs within seconds, whereas field surveillance teams choose backpack rigs to assay drums or IBC totes with deeper penetration optics. The counterfeit drug detection device market size for benchtop instruments remains resilient in QC laboratories where regulated environments justify stationary setups and peak resolution specifications.
Emerging modular designs allow users to dock handheld probes into larger base units for extended spectral range, creating a continuum rather than discrete categories. Hospitals trial cart-mounted hybrids in pharmacy compounding rooms, achieving hospital-grade contamination control without sacrificing portability. Integration of battery management systems offering eight-hour duty cycles resolves earlier adoption hesitations tied to runtime limitations. Modality diversification aligns neatly with supply-chain decentralization smaller batch sizes and direct-to-patient distribution lines stretch authenticity checkpoints beyond plant walls, requiring devices that travel where the product flows.
Complete Report Scope:
- By Technology
- Infrared & Near-Infrared Spectroscopy
- Raman Spectroscopy
- Surface-Enhanced Raman (SERS)
- Microfluidic Lab-on-Chip
- Rapid Chemical Testing Kits
- RFID / Blockchain Tagging
- Other Emerging Technologies
- By Modality
- Handheld Devices
- Benchtop Devices
- Portable/Back-pack Systems
- By Application
- Chemical-Composition Verification
- Packaging & Labelling Authentication
- Mixed-Dosage Analysis
- By End User
- Pharmaceutical Manufacturers
- Drug Testing Laboratories
- Other End Users
- By Geography
- North America
- United States
- Canada
- Mexico
- Europe
- Germany
- United Kingdom
- France
- Italy
- Spain
- Rest of Europe
- Asia-Pacific
- China
- Japan
- India
- Australia
- South Korea
- Rest of Asia-Pacific
- Middle East & Africa
- GCC
- South Africa
- Rest of Middle East & Africa
- South America
- Brazil
- Argentina
- Rest of South America
- North America
Geography Analysis
North America's held market share of 38.22% in the counterfeit drug detection device market in 2025, buoyed by the Drug Supply Chain Security Act deadline that makes electronic verification compulsory. Device penetration in hospital pharmacies and specialty distributors remains among the world's highest, and vendor support ecosystems cover calibration, compliance training, and third-party validation. The European Union maintains steady expansion as the Falsified Medicines Directive demands serialized packs and anti-tamper features. Benelux countries pioneer nation-wide blockchain registries interfacing with spectroscopy scanners, shortening authentication checks to under five seconds.
Asia Pacific now provides the steepest incline, with a 9.33% CAGR through 2031 as China tightens GMP rules and India enforces QR codes on the top 300 prescription brands. Local manufacturers, once reliant on visual inspection, pivot toward portable Raman units to satisfy export-market audits. Regional distributors also deploy mobile SERS devices in rural cold-chain routes where electricity outages mandate quick pass-fail decisions. Southeast Asian customs agencies adopt handheld scanners to intercept ASEAN-wide illicit flows before onward transit to Europe.
Latin America and Middle East-Africa collectively account for less than 10% of global revenue but represent outsized counterfeiting hotspots. Nigeria's high counterfeit incidence drives donor-funded pilots that bundle detection devices with capacity-building workshops. Saudi Arabia's track-and-trace platform Tatmeen aligns with GS1 standards, incentivizing device purchases compatible with 2D-data-matrix scans. Adoption remains sensitive to public-sector procurement schedules and multilateral aid cycles, but steady alignment with international pharmacovigilance norms signals medium-term upside.
- Thermo Fisher Scientific
- Rigaku Analytical Devices
- Agilent Technologies
- B&W Tek (Part of Metrohm)
- Bruker
- HORIBA
- Renishaw plc
- Smiths Detection Group Ltd.
- DetectaChem LLC
- Spectral Engines Oy
- Stratio
- Systech International
- GAO Group
- Metrohm AG (Mira devices)
- ChemImage Corporation
- TruTag Technologies Inc.
- Enspectr LLC
- TSI Incorporated
- SciAps Inc.
- Bayer
Additional Benefits:
- The market estimate (ME) sheet in Excel format
- 3 months of analyst support
TABLE OF CONTENTS
1 Introduction
- 1.1 Study Assumptions & Market Definition
- 1.2 Scope of the Study
2 Research Methodology
3 Executive Summary
4 Market Landscape
- 4.1 Market Overview
- 4.2 Market Drivers
- 4.2.1 Emphasis on Advanced Supply-Chain Surveillance
- 4.2.2 Shift From Packaging to On-Dosage Security
- 4.2.3 Supportive Government & Regulatory Mandates
- 4.2.4 AI-Powered SERS Enabling Sub-Ppm Field Tests
- 4.2.5 Iot-Integrated Smart Packaging Validation
- 4.2.6 Demand Surge from Cannabis Edibles & Personalized Meds
- 4.3 Market Restraints
- 4.3.1 Low Awareness in Developing Regions
- 4.3.2 High Upfront Cost of Spectroscopy Devices
- 4.3.3 Laser-Safety Limits on Hospital Use of Handheld Raman
- 4.3.4 Lack of Spectral Libraries for Novel Drug-Polymer Combos
- 4.4 Regulatory Landscape
- 4.5 Technological Outlook
- 4.6 Porter's Five Forces Analysis
- 4.6.1 Threat of New Entrants
- 4.6.2 Bargaining Power of Buyers
- 4.6.3 Bargaining Power of Suppliers
- 4.6.4 Threat of Substitutes
- 4.6.5 Intensity of Competitive Rivalry
5 Market Size & Growth Forecasts (Value in USD)
- 5.1 By Technology
- 5.1.1 Infrared & Near-Infrared Spectroscopy
- 5.1.2 Raman Spectroscopy
- 5.1.3 Surface-Enhanced Raman (SERS)
- 5.1.4 Microfluidic Lab-on-Chip
- 5.1.5 Rapid Chemical Testing Kits
- 5.1.6 RFID / Blockchain Tagging
- 5.1.7 Other Emerging Technologies
- 5.2 By Modality
- 5.2.1 Handheld Devices
- 5.2.2 Benchtop Devices
- 5.2.3 Portable/Back-pack Systems
- 5.3 By Application
- 5.3.1 Chemical-Composition Verification
- 5.3.2 Packaging & Labelling Authentication
- 5.3.3 Mixed-Dosage Analysis
- 5.4 By End User
- 5.4.1 Pharmaceutical Manufacturers
- 5.4.2 Drug Testing Laboratories
- 5.4.3 Other End Users
- 5.5 By Geography
- 5.5.1 North America
- 5.5.1.1 United States
- 5.5.1.2 Canada
- 5.5.1.3 Mexico
- 5.5.2 Europe
- 5.5.2.1 Germany
- 5.5.2.2 United Kingdom
- 5.5.2.3 France
- 5.5.2.4 Italy
- 5.5.2.5 Spain
- 5.5.2.6 Rest of Europe
- 5.5.3 Asia-Pacific
- 5.5.3.1 China
- 5.5.3.2 Japan
- 5.5.3.3 India
- 5.5.3.4 Australia
- 5.5.3.5 South Korea
- 5.5.3.6 Rest of Asia-Pacific
- 5.5.4 Middle East & Africa
- 5.5.4.1 GCC
- 5.5.4.2 South Africa
- 5.5.4.3 Rest of Middle East & Africa
- 5.5.5 South America
- 5.5.5.1 Brazil
- 5.5.5.2 Argentina
- 5.5.5.3 Rest of South America
- 5.5.1 North America
6 Competitive Landscape
- 6.1 Market Concentration
- 6.2 Market Share Analysis
- 6.3 Company Profiles (includes Global level Overview, Market-level Overview, Core Segments, Financials, Strategic Info, Market Rank/Share, Products & Services, Recent Developments)
- 6.3.1 Thermo Fisher Scientific Inc.
- 6.3.2 Rigaku Analytical Devices
- 6.3.3 Agilent Technologies Inc.
- 6.3.4 B&W Tek (Part of Metrohm)
- 6.3.5 Bruker Corporation
- 6.3.6 Horiba Ltd.
- 6.3.7 Renishaw plc
- 6.3.8 Smiths Detection Group Ltd.
- 6.3.9 DetectaChem LLC
- 6.3.10 Spectral Engines Oy
- 6.3.11 Stratio Inc.
- 6.3.12 Systech International
- 6.3.13 GAO Group
- 6.3.14 Metrohm AG (Mira devices)
- 6.3.15 ChemImage Corporation
- 6.3.16 TruTag Technologies Inc.
- 6.3.17 Enspectr LLC
- 6.3.18 TSI Incorporated
- 6.3.19 SciAps Inc.
- 6.3.20 Bayer AG
7 Market Opportunities & Future Outlook
- 7.1 White-space & Unmet-Need Assessment