

|
시장보고서
상품코드
2114747
세포독성 약물 시장 : 점유율 분석, 업계 동향과 통계, 성장 예측(2026-2031년)Cytotoxic Drugs - Market Share Analysis, Industry Trends & Statistics, Growth Forecasts (2026 - 2031) |
||||||
 Mordor Intelligence
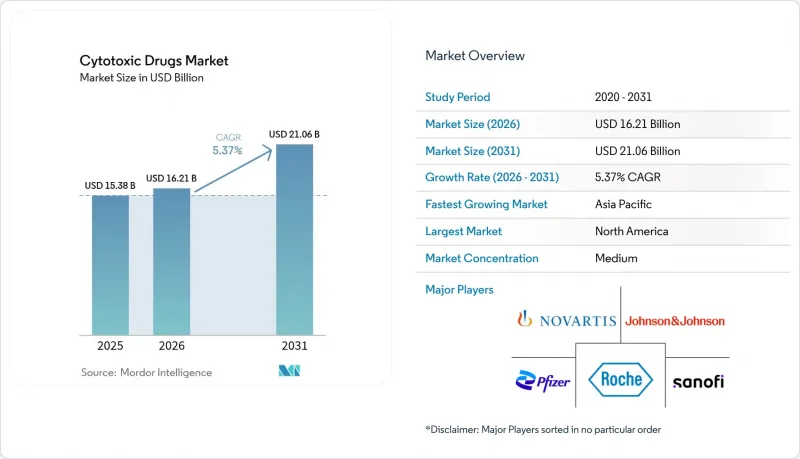
Mordor Intelligence에 의하면, 2026년 세포독성 약물 시장 규모는 162억 1,000만 달러로 추정되고 있어 2025년 153억 8,000만 달러에서 확대해, 2031년에는 210억 6,000만 달러에 이를 것으로 예측됩니다.
2026년부터 2031년까지 연평균 성장률(CAGR) 5.37%로 성장할 것으로 전망됩니다.
본 보고서는 투여 경로(비경구 및 경구), 약제 유형(알킬화제, 항종양성 항생제, 항대사제 등), 적응증(유방암, 전립선암, 폐암 등), 유통 채널(병원 약국, 온라인 약국 등), 지역(북미, 유럽 등)별로 분류되어 있습니다. 시장 전망은 금액(달러) 기준으로 제시되어 있습니다.
전 세계 세포독성 약물 시장 동향 및 인사이트
암 발병률 증가와 조기 진단
2025년, 미국의 신규 암 진단 건수는 사상 처음으로 204만 건을 돌파하여, 세포독성 약물의 거대한 치료 대상층을 더욱 공고히 했습니다. 영상 진단 기술의 향상, AI를 활용한 선별 검사, 그리고 고령화로 인해 세포독성 약물이 여전히 표준 치료법인 병기에서 악성 종양이 임상적으로 주목받고 있습니다. 신흥국에서는 전체 인구를 대상으로 한 선별 검사가 도입되어 초기 단계의 종양이 발견됨에 따라, 비용 대비 효과가 높은 화학요법에 대한 수요가 촉발되고 있습니다. 이러한 요인들이 복합적으로 작용하여 치료 건수가 증가하고 치료 기간이 연장됨에 따라, 세포독성 항암제 시장의 기초적인 성장이 강화되고 있습니다.
항암요법 요법의 보험 적용 범위 확대
메디케어가 2025년에 도입할 환자 약제 본인 부담금에 대한 연간 2,000달러 상한선 설정으로 인해, 다제 병용 화학요법의 경제적 장벽이 대폭 낮아질 것입니다. 민간 보험사들도 이 상한선을 따르는 경향이 강해지고 있어, 이전에는 가계에 부담을 주던 고용량 요법이나 병용 요법에 대한 접근성이 원활해지고 있습니다. 중국에서도 유사한 개혁이 이루어지고 있으며, 중국의 국민의료보험 목록에 최근 승인된 세포독성 약물이 추가되었습니다. 한편, 유럽의 보험사들도 종합적인 암 치료 패키지를 유지하고 있습니다. 이러한 보상 범위 확대로 인해 치료 순응도 향상, 지지 요법 약물의 광범위한 사용, 그리고 새로 출시된 세포독성 약물의 신속한 보급으로 이어지고 있습니다.
심각한 부작용 프로파일이 투여 순응도를 제한
독성으로 인한 치료 중단은 여전히 지속되고 있으며, 대장암 치료의 중도 탈락률은 27%에서 53%에 이릅니다. 2023년에 시스플라틴 등 핵심 약제가 부족하면서 대체 약물에 대한 의존도가 높아졌고, 많은 화학요법에서 치료 선택의 폭이 좁다는 점이 부각되었습니다. 지지 요법이나 약사가 주도하는 복약 순응도 프로그램을 통해 일부 과제는 완화되고 있지만, 근본적인 독성 프로파일이 치료법의 광범위한 적용을 제약하고 있으며, 실제 임상에서의 치료 성과에 영향을 미치고 있습니다.
부문 분석
2025년에는 급성 투여 및 병용 요법에서의 투여량 관리에 대한 임상의의 신뢰를 바탕으로, 비경구용 약물이 시장 점유율의 68.87%를 차지하며 시장을 주도했습니다. 그러나 환자 중심의 치료 모델이 재택 투여로 전환됨에 따라, 경구용 세포독성 약물은 2031년까지 연평균 성장률(CAGR) 8.79%를 기록하며 이 부문에서 가장 빠른 성장을 보일 것으로 예측됩니다. 경구용 세포독성 약물 시장 규모는 생체이용률이 향상된 제제가 널리 보험 적용을 받게 되면 병원 전용 투여량을 넘어설 것으로 예측됩니다. 서방형 정제와 같은 기술적 진보로 인해 효능을 유지하면서 혈장 내 최고 농도의 독성을 낮출 수 있게 됨에 따라, 종양 전문의들은 장기 병용 요법 계획에 경구용 약제를 포함시키고 있습니다.
약사가 원격의료 플랫폼을 통해 복약 일정을 모니터링하고, 복약 누락을 경고하거나 부작용을 관리함으로써 편의성이 향상되고 복약 순응도가 높아집니다. 급속한 종양 축소가 필수적인 도입 요법이나 구제 요법 프로토콜에서는 주사제가 여전히 중요하지만, 정제나 캡슐에 대한 환자의 수용도가 확대됨에 따라 수익의 성장세는 경구 제형으로 이동하고 있습니다. 전자 처방전 생태계가 성숙해짐에 따라, 온라인 약국을 통한 유통이 재택 치료의 보급을 더욱 가속화하여 제제 개발 혁신 기업들에게 새로운 경쟁 우위를 창출하고 있습니다.
알킬화제는 광범위한 작용기전과 의사들의 오랜 숙련도 덕분에 2025년에는 30.10%의 시장 점유율을 차지했습니다. 이 계열에 속하는 세포독성 약물 시장 점유율은 혈액암 및 고형암의 기본 치료 요법에서 차지하는 확고한 역할을 뒷받침하고 있습니다. 항대사제는 독성 감소와 병용 가능성을 특징으로 하며, 연평균 성장률(CAGR) 7.02%로 다른 모든 유형을 앞지르고 있습니다. AI를 활용한 약물의 용도 전환을 통해, 내성 암의 치료 성과를 향상시키는 시너지 효과를 가진 항대사제 조합이 확인되고 있습니다.
개발 파이프라인에서는 토포이소머라제 억제제나 식물 알칼로이드 유도체를 항원 발현 종양으로 전달하는 ADC(항체-약물 복합체)가 점점 더 많이 활용되고 있으며, 이는 지금까지 충분히 활용되지 못했던 유효 성분에 새로운 상업적 활력을 불어넣고 있습니다. 트레오설판에 대한 FDA의 승인은 항대사제가 성장세를 이어가는 가운데, 최적화된 알킬화제에 대한 규제 당국의 신뢰를 보여줍니다. 점진적인 혁신과 새로운 결합 전략의 상호작용이 전반적인 약물 유형에 걸친 경쟁 역학을 재편하고 있습니다.
지역별 분석
2025년에는 종합적인 보험 적용과 활발한 임상시험 활동에 힘입어 북미가 매출의 42.15%를 차지하며 1위를 차지했습니다. 2025년부터 시행되는 메디케어 비용 분담 상한제로 인해 다제 병용 요법의 대상 환자층이 확대되고, 치료 순응도 향상도 촉진될 것입니다. 벤처 투자와 유리한 희귀질환 치료제(오펀 드럭)에 대한 우대 조치 덕분에, 미국은 ADC 및 경구 제제 분야에서 획기적인 진전의 최전선에 계속 서 있습니다. 캐나다에서는 머신러닝을 활용한 발병률 예측을 통해 분석의 정확도를 높이고 있으며, 이를 통해 각 주 보건 당국은 화학요법 약제의 재고에 대해 정확한 예산 편성이 가능해졌습니다.
아시아태평양은 10.07%라는 강력한 연평균 성장률(CAGR)을 기록하고 있으며, 현재 완제 의약품 비용을 절감하는 전 세계적인 제조 규모 확대를 뒷받침하는 핵심 역할을 하고 있습니다. 중국에서는 2024년에 국가약품감독관리국(NMPA)이 228개의 의약품을 승인했으며, 그중 37%가 항종양제로 분류되어 있어 이는 국내 혁신 기업을 지원하는 규제적 추세를 보여줍니다. NexCAR19 및 대규모 API 단지로 대표되는 인도의 현지화 추진,다발성 골수종에 대한 이사츠키시맙의 조건부 승인을 인정한 일본, 그리고 한국의 바이오접합체 임상시험은 이 모든 요소가 어우러져 임상 도입과 수출 가능성 모두를 가속화하는 활기찬 생태계를 형성하고 있습니다.
유럽에서는 기업들에게 27개 시장에 대한 단일 진입 경로를 제공하는 조화로운 EMA 절차를 통해 균형 잡힌 진전이 유지되고 있습니다. EMA가 로슈사의 ‘알레켄사’를 보조 요법으로 승인한 것은 세포독성 약물을 질환의 초기 단계에 통합한다는 점에서 정밀 종양학 분야의 리더십을 부각시키고 있습니다. 론자(Lonza)와 같은 대형 수탁 개발 기업들은 증가하는 ADC 수요에 대응하기 위해 스위스의 접합체 제조 시설을 확장하고 있습니다. 공공 의료 제도는 환자들의 폭넓은 접근성을 보장하는 한편, 가격에 대한 감시를 강화하고 있어 공급업체들은 증분적 편익을 정당화해야 할 필요가 있습니다.
중동 및 아프리카 및 남미는 절대적인 규모는 작지만, 다자간 보건 이니셔티브를 통해 화학요법의 보급이 확대되면서 두 자릿수 성장을 기록하고 있습니다. 걸프 국가들의 정부계 펀드가 공동 출자하는 종양 센터 등의 인프라 프로젝트는 지역 특유공급망 구축을 촉진하고 있습니다. ‘Access to Oncology Medicines Coalition’은 기술 지원 및 공동 조달 도구를 제공하고, 공급 리드타임을 단축함으로써 세포독성 항암제 시장에서 신흥 시장의 기여도를 공고히 하고 있습니다.
기타 혜택:
- 엑셀 형식 시장 예측(ME) 시트
- 3개월간의 애널리스트 지원
자주 묻는 질문
목차
제1장 서론
제2장 조사 방법
제3장 주요 요약
제4장 시장 구도
제5장 시장 규모와 성장 예측
제6장 경쟁 구도
제7장 시장 기회와 향후 전망
JHS 26.08.26According to Mordor Intelligence, the cytotoxic drugs market size in 2026 is estimated at USD 16.21 billion, growing from 2025 value of USD 15.38 billion with 2031 projections showing USD 21.06 billion, growing at 5.37% CAGR over 2026-2031.
This report is Segmented by Route of Administration (Parenteral and Oral), Drug Type (Alkylating Agents, Antitumor Antibiotics, Antimetabolites, and More), Application (Breast Cancer, Prostate Cancer, Lung Cancer, and More), Distribution Channel (Hospital Pharmacies, Online Pharmacies, and More), and Geography (North America, Europe, and More). The Market Forecasts are Provided in Terms of Value (USD).
Global Cytotoxic Drugs Market Trends and Insights
Rising Cancer Incidence & Earlier Diagnosis
The number of newly diagnosed cancer cases crossed 2.04 million in the United States for the first time in 2025, reinforcing a large treatment pool for cytotoxic agents. Improved imaging, AI-enabled screening, and aging demographics bring malignancies to clinical attention at stages where cytotoxics remain standard of care. Emerging nations roll out population-wide screening that uncovers earlier-stage tumors and unlocks demand for cost-effective chemotherapy. These factors collectively raise treatment volumes and extend therapy durations, strengthening baseline growth for the cytotoxic drugs market.
Expanding Reimbursement For Chemotherapy Regimens
Medicare's 2025 introduction of a USD 2,000 annual cap on patient out-of-pocket drug costs slashes financial barriers for multi-agent chemotherapy. Private insurers increasingly mirror this ceiling, smoothing access to high-dose and combination protocols that previously strained household budgets. Similar reforms appear in China, where the national medical insurance list now includes recently approved cytotoxics, while European payers sustain comprehensive oncology packages. The resulting reimbursement expansion translates into higher treatment adherence, broader use of supportive care drugs, and faster uptake of newly launched cytotoxics.
Severe Adverse-Effect Profile Limits Dosage Adherence
Toxicity-driven discontinuation persists, with dropout rates ranging from 27% to 53% in colorectal cancer treatments. Shortages of cornerstone agents such as cisplatin in 2023 amplified reliance on alternative drugs and spotlighted the narrow therapeutic margins of many chemotherapies. Although supportive care and pharmacist-led adherence programs mitigate some challenges, the core toxicity profile constrains broader application and affects real-world outcomes.
Other drivers and restraints analyzed in the detailed report include:
- Pipeline Approvals Of Next-Gen Cytotoxic Formulations
- Surging Demand Across Low- And Middle-Income Countries
- Shift Of R&D Budgets Toward Targeted & Immuno-Oncology Drugs
For complete list of drivers and restraints, kindly check the Table Of Contents.
Segment Analysis
Parenteral drugs dominated with 68.87% market share in 2025, anchored by clinician confidence in controlled dosing for acute and combination regimens. Oral cytotoxics, however, record the segment's quickest expansion at 8.79% CAGR through 2031 as patient-centric care models pivot toward home administration. The cytotoxic drugs market size for oral treatments is projected to outgrow hospital-exclusive volumes when improved bioavailability formulations reach widespread reimbursement. Advances such as sustained-release tablets reduce peak plasma toxicity while maintaining efficacy, driving oncologists to integrate oral options into long-term combination plans.
Convenience bolsters adherence when pharmacists monitor dosing schedules through telehealth platforms that flag missed pills and manage side effects. Injectables remain critical in induction and salvage protocols where rapid cytoreduction is essential, yet broader patient acceptance of tablets and capsules shifts revenue momentum toward oral formats. As e-prescription ecosystems mature, online pharmacy distribution further accelerates uptake of at-home regimens, creating fresh competitive angles for formulation innovators.
Alkylating agents commanded 30.10% share in 2025 owing to their broad mechanistic reach and longstanding physician familiarity. The cytotoxic drugs market share attributed to this class underscores its entrenched role in foundation regimens for hematologic and solid tumors. Antimetabolites, featuring refined toxicity and combination potential, outpace all other types at a 7.02% CAGR. AI-enabled drug repurposing identifies synergistic antimetabolite partners that enhance outcomes in resistant cancers.
Development pipelines increasingly leverage ADCs that carry topoisomerase inhibitors and plant alkaloid derivatives into antigen-expressing tumors, breathing new commercial life into underutilized payloads. FDA endorsement of treosulfan demonstrates regulators' confidence in optimized alkylators even as antimetabolites seize growth momentum. The interplay of incremental innovation and novel conjugation strategies reshapes competitive dynamics across the drug-type spectrum.
Complete Report Scope:
- By Route of Administration
- Parenteral
- Oral
- By Drug Type
- Alkylating Agents
- Antitumor Antibiotics
- Antimetabolites
- Plant Alkaloids
- Topoisomerase Inhibitors
- Others
- By Application
- Breast Cancer
- Prostate Cancer
- Lung Cancer
- Pancreatic Cancer
- Colorectal Cancer
- Others
- By Distribution Channel
- Hospital Pharmacies
- Retail Pharmacies & Drug Stores
- Online Pharmacies
- Other Distribution Channels
- Geography
- North America
- United States
- Canada
- Mexico
- Europe
- Germany
- United Kingdom
- France
- Italy
- Spain
- Rest of Europe
- Asia-Pacific
- China
- Japan
- India
- South Korea
- Australia
- Rest of Asia-Pacific
- Middle East and Africa
- GCC
- South Africa
- Rest of Middle East and Africa
- South America
- Brazil
- Argentina
- Rest of South America
- North America
Geography Analysis
North America led revenue with 42.15% share in 2025, propelled by comprehensive insurance coverage and robust clinical trial activity. Medicare's cost-sharing cap beginning in 2025 widens the addressable patient base for multi-agent cycles and supports higher therapy adherence. Venture investment and favorable orphan-drug incentives keep the United States at the forefront of ADC and oral formulation breakthroughs. Canada adds analytical depth through machine-learning incidence forecasts that allow provincial health authorities to budget accurately for chemotherapy inventories.
Asia-Pacific registers a vigorous 10.07% CAGR and now anchors global manufacturing scaleouts that lower finished-dose costs. China's NMPA clearance of 228 drugs in 2024, with 37% classified as antineoplastics, signals regulatory momentum supporting domestic innovators. India's localization drive exemplified by NexCAR19 and large API parks, Japan's conditional nods for isatuximab in multiple myeloma, and Korea's bioconjugate trials collectively form a vibrant ecosystem that accelerates both clinical adoption and export potential.
Europe maintains balanced progress through harmonized EMA procedures that give companies a single pathway to 27 markets. The agency's approval of Roche's Alecensa as adjuvant therapy highlights precision oncology leadership in integrating cytotoxic payloads into early disease settings. Contract development giants such as Lonza expand Swiss conjugation suites to serve escalating ADC demand. Public healthcare frameworks secure broad patient access yet heighten price scrutiny, pressing suppliers to justify incremental benefits.
Middle East and Africa plus South America are smaller in absolute terms yet register double-digit upticks where multilateral health initiatives lift chemotherapy availability. Infrastructure projects, such as oncology centers co-funded by Gulf sovereign wealth funds, facilitate region-specific supply networks. The Access to Oncology Medicines Coalition channels technical assistance and pooled procurement tools that shorten supply timelines, solidifying emerging-market contributions to the cytotoxic drugs market.
- Baxter
- Cipla
- Eli Lilly and Company
- Fresenius
- Johnson & Johnson
- Viatris
- Novartis
- Pfizer
- Sun Pharmaceuticals Industries
- Teva Pharmaceutical Industries
- Sanofi
- Roche
- AstraZeneca
- Merck
- Amgen
- Lonza Group (HPAPI CDMO)
- Dr. Reddy's Laboratories
- Hikma Pharmaceuticals
- Intas Pharmaceuticals
- Alvogen
Additional Benefits:
- The market estimate (ME) sheet in Excel format
- 3 months of analyst support
TABLE OF CONTENTS
1 Introduction
- 1.1 Study Assumptions & Market Definition
- 1.2 Scope of the Study
2 Research Methodology
3 Executive Summary
4 Market Landscape
- 4.1 Market Overview
- 4.2 Market Drivers
- 4.2.1 Rising Cancer Incidence & Earlier Diagnosis
- 4.2.2 Expanding Reimbursement For Chemotherapy Regimens
- 4.2.3 Pipeline Approvals Of Next-Gen Cytotoxic Formulations
- 4.2.4 Surging Demand Across Low- And Middle-Income Countries
- 4.2.5 AI-Driven Drug-Repurposing Accelerating Cytotoxic Combos
- 4.2.6 ADC (Antibody-Drug Conjugate) Payload Demand For Cytotoxics
- 4.3 Market Restraints
- 4.3.1 Severe Adverse-Effect Profile Limits Dosage Adherence
- 4.3.2 High Cost Of HPAPI Containment & Compliance (USP-800, EMA)
- 4.3.3 Shift Of R&D Budgets Toward Targeted & Immuno-Oncology Drugs
- 4.3.4 Environmental Regulations On Cytotoxic Effluent Disposal
- 4.4 Supply-Chain Analysis
- 4.5 Porter's Five Forces
- 4.5.1 Threat of New Entrants
- 4.5.2 Bargaining Power of Buyers
- 4.5.3 Bargaining Power of Suppliers
- 4.5.4 Threat of Substitutes
- 4.5.5 Intensity of Competitive Rivalry
5 Market Size & Growth Forecasts (Value, USD)
- 5.1 By Route of Administration
- 5.1.1 Parenteral
- 5.1.2 Oral
- 5.2 By Drug Type
- 5.2.1 Alkylating Agents
- 5.2.2 Antitumor Antibiotics
- 5.2.3 Antimetabolites
- 5.2.4 Plant Alkaloids
- 5.2.5 Topoisomerase Inhibitors
- 5.2.6 Others
- 5.3 By Application
- 5.3.1 Breast Cancer
- 5.3.2 Prostate Cancer
- 5.3.3 Lung Cancer
- 5.3.4 Pancreatic Cancer
- 5.3.5 Colorectal Cancer
- 5.3.6 Others
- 5.4 By Distribution Channel
- 5.4.1 Hospital Pharmacies
- 5.4.2 Retail Pharmacies & Drug Stores
- 5.4.3 Online Pharmacies
- 5.4.4 Other Distribution Channels
- 5.5 Geography
- 5.5.1 North America
- 5.5.1.1 United States
- 5.5.1.2 Canada
- 5.5.1.3 Mexico
- 5.5.2 Europe
- 5.5.2.1 Germany
- 5.5.2.2 United Kingdom
- 5.5.2.3 France
- 5.5.2.4 Italy
- 5.5.2.5 Spain
- 5.5.2.6 Rest of Europe
- 5.5.3 Asia-Pacific
- 5.5.3.1 China
- 5.5.3.2 Japan
- 5.5.3.3 India
- 5.5.3.4 South Korea
- 5.5.3.5 Australia
- 5.5.3.6 Rest of Asia-Pacific
- 5.5.4 Middle East and Africa
- 5.5.4.1 GCC
- 5.5.4.2 South Africa
- 5.5.4.3 Rest of Middle East and Africa
- 5.5.5 South America
- 5.5.5.1 Brazil
- 5.5.5.2 Argentina
- 5.5.5.3 Rest of South America
- 5.5.1 North America
6 Competitive Landscape
- 6.1 Market Concentration
- 6.2 Market Share Analysis
- 6.3 Company Profiles (includes Global level Overview, Market level overview, Core Business Segments, Financials, Headcount, Key Information, Market Rank, Market Share, Products and Services, and analysis of Recent Developments)
- 6.3.1 Baxter International Inc.
- 6.3.2 Cipla Ltd
- 6.3.3 Eli Lilly and Company
- 6.3.4 Fresenius Kabi AG
- 6.3.5 Johnson & Johnson
- 6.3.6 Viatris Inc
- 6.3.7 Novartis AG
- 6.3.8 Pfizer Inc.
- 6.3.9 Sun Pharmaceutical Industries
- 6.3.10 Teva Pharmaceutical Industries
- 6.3.11 Sanofi SA
- 6.3.12 Roche Holding AG
- 6.3.13 AstraZeneca PLC
- 6.3.14 Merck & Co., Inc.
- 6.3.15 Amgen Inc.
- 6.3.16 Lonza Group (HPAPI CDMO)
- 6.3.17 Dr. Reddy's Laboratories
- 6.3.18 Hikma Pharmaceuticals
- 6.3.19 Intas Pharmaceuticals
- 6.3.20 Alvogen
7 Market Opportunities & Future Outlook
- 7.1 White-space & unmet-need assessment


