|
시장보고서
상품코드
2114974
식품용 윤활유 시장 : 시장 점유율 분석, 업계 동향 및 통계, 성장 예측(2026-2031년)Food Grade Lubricants - Market Share Analysis, Industry Trends & Statistics, Growth Forecasts (2026 - 2031) |
||||||
 Mordor Intelligence
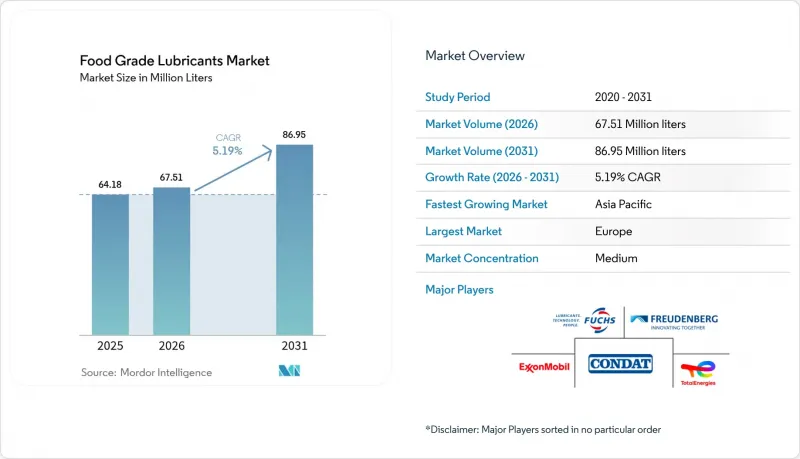
Mordor Intelligence에 의하면, 식품용 윤활유 시장 규모는 2025년에 6,418만 리터로 평가되었고, 2026년 6,751만 리터에서 2031년까지 8,695만 리터에 이를 것으로 예측되며, 예측 기간(2026-2031년) CAGR은 5.19%를 나타낼 전망입니다.
본 보고서는 분류별(H1, H2, H3), 기유별(광물유, 합성유, 바이오유), 제품 유형별(그리스, 작동유, 기어 오일, 기타 제품), 최종 사용자 산업별(식음료, 화장품, 식용유, 기타), 지역별(아시아태평양, 북미, 유럽, 남미, 중동 및 아프리카)로 분류되어 있습니다.
세계의 식품용 윤활유 시장 동향 및 인사이트
전 세계적으로 강화되는 식품 안전 규제
각국 정부는 식품 접촉 관련 규제를 더욱 강화하는 방향으로 발맞추고 있으며, 윤활유 공급업체는 배합을 개선할 수밖에 없는 상황에 놓여 있고, 그렇지 않을 경우 등록 취소 위험에 직면하게 됩니다. 중국에서 개정된 GB 2760-2024는 해당 국가의 포지티브 리스트를 확대하고 가공 보조제에 관한 허점을 메우는 것으로, 이에 따라 NSF 및 ISO 21469 감사에 부합하며 완벽하게 문서화된 H1 유체에 대한 수요가 증가하고 있습니다. 유럽에서는 EFSA의 MOSH 및 MOAH 평가에 따라 가공업체들이 미량의 광물유가 혼입되지 않은 합성 윤활유를 선호하는 추세입니다. 또한, ISO 21469 인증은 기본적인 NSF 등록보다 더 높은 보증 수준을 나타내는 것으로 자리 잡았습니다. 미국 FDA는 계속해서 21 CFR 178.3570에 대한 모니터링을 강화하고 있으며, 30개 이상의 주에서 PFAS 금지 조례를 제정하여 간접적으로 윤활유의 화학 조성에 영향을 미치고 있습니다. 전 세계에 규제 대응 팀을 보유한 공급업체들은 이러한 복잡성을, 사내에 전문 지식이 없는 고객을 위한 고부가가치 컨설팅으로 전환하고 있습니다. 이러한 시너지 효과로 인해 진입 장벽이 낮아지고, 장기 계약이 공고해지며, 식품용 윤활유 시장 전체의 물량 확대를 뒷받침하고 있습니다.
식품용 윤활유가 필요한 가공식품 및 즉석식품 수요의 급증
식생활은 높은 처리량을 자랑하는 기계에 의존하는 편의식품, 1인분 포장, 옴니채널 식료품 판매 모델로 전환되고 있습니다. AI를 활용한 예측 유지보수 등 ‘푸드 인더스트리 5.0’ 개념으로 인해 허용되는 가동 중단 시간의 폭이 줄어들고 있습니다. 따라서 윤활유는 선정의 타당성을 입증하기 위해 더 긴 교환 주기와 오염에 대한 내성을 제공해야 합니다. 제품의 SKU 수가 증가함에 따라 교체 빈도도 높아지고 있으며, 윤활유에는 변동하는 부하와 온도에 대한 내성이 요구되고 있습니다. 이러한 편의식품의 성장과 공장 자동화의 시너지 효과로 인해, 식품용 윤활유 시장 전체에서 윤활유 수요량뿐만 아니라 성능에 대한 기대치도 높아지고 있습니다.
기존 산업용 오일에 비해 높은 가격 프리미엄
합성 H1 윤활유는 여전히 일반 광물유에 비해 25%의 가격 프리미엄이 책정되어 있어, 이익 마진이 극히 적은 소규모 가공업체에게는 장벽이 되고 있습니다. 총 수량의 불과 1-5%를 차지하는 바이오 그리스는 생분해성이라는 장점이 있음에도 불구하고, 더 높은 가격 프리미엄이 부과되고 있습니다. 인건비가 낮고 설비 교체 주기가 긴 지역에서는 경영진이 감사나 대형 소매 고객의 요청이 있을 때까지 윤활유 업그레이드를 미루는 경우가 많습니다. 현지 혼합, 기유 수율 향상, 경쟁으로 인해 식품용 윤활유 시장 전체의 이익률이 압박을 받으면서, 이러한 가격 장벽은 점차 해소될 것으로 예측됩니다.
부문 분석
H1 윤활유는 2025년 수량의 64.70%를 차지했으며, 2031년까지 연평균 성장률(CAGR) 5.52%로 그 리드를 확대하여 식품용 윤활유 시장에서 지배적인 부문이자 가장 빠르게 성장하는 부문이라는 이중 역할을 확고히 할 전망입니다. 가공업체들은 유지보수 시나 부품 고장 시 오염 위험을 줄이기 위해 비접촉으로 간주되는 장비라 하더라도 H1 인증 제품을 선호하고 있습니다. 따라서 H1 제품으로 인한 식품용 윤활유 시장 규모는 생물학적 및 화학적 유해 요소를 엄격하게 심사하게 된, 더욱 엄격해진 ISO 21469 감사의 진전에 따라 확대될 것으로 보입니다.
한때 밀폐형 시스템에서 인기를 끌었던 H2 계열 윤활유는 조달 부서가 이론적인 노출 평가보다 종합적인 규정 준수를 우선시하게 됨에 따라 현재는 수세적인 틈새 시장에 머물러 있습니다. H3 계열 수용성 오일은 물 세척성이 최우선으로 고려되는 육류 가공 공장의 후크 윤활 등 특수한 부문에 국한되어 있습니다. 임박한 PFAS 금지 조치는 간접적으로 H1에 대한 지지를 강화하고 있습니다. 이는 재조제된 합성 윤활유가 더 넓은 작동 온도 범위에서 높은 부하 용량을 발휘하여 H2 등급과의 성능 격차에 대한 인식을 더욱 희미하게 만들고 있기 때문입니다. 그 결과, 예측 기간 동안 시장 구성은 H1 쪽으로 더욱 크게 기울어질 것으로 예상되며, 인증에 관한 전문 지식이 식품용 윤활유 시장에서의 경쟁에 있어 필수적인 축이 될 것으로 보입니다.
광물유 혼합 제품은 2025년에 52.08%의 점유율을 유지하며, 식품용 윤활유 시장에서 물량 기준의 핵심 역할을 확고히 했습니다. 이러한 지위는 확립된 공급망, 예측 가능한 첨가제 반응, 대량 생산을 하는 제빵 및 유제품 제조업체에 적합한 단가에 의해 뒷받침되고 있습니다. 그럼에도 불구하고 바이오 대체재의 채택률은 비율상 합성 윤활유를 상회하며, 시장 전체를 웃도는 5.86%의 연평균 성장률(CAGR)을 기록하고 있습니다. 따라서 바이오 제품과 관련된 식품용 윤활유 시장 규모는 여전히 작지만, 기업의 탄소 목표와 소매업체의 ‘친환경’ 조달 요구에 힘입어 빠르게 확대되고 있습니다.
합성 기유는 가격이 비싸지만, 가동 중단 위험이 윤활유 비용을 훨씬 상회하는 24시간 365일 가동되는 자동화 설비를 운영하는 가공업체에게는 매력적인 선택지입니다. 뛰어난 온도 범위와 강력한 세제에 대한 내성 덕분에 오일 교환 주기가 연장되어, 많은 공장에서 윤활유 관련 유지보수 작업 총량을 두 자릿수 비율로 줄이고 있습니다.
지역별 분석
2025년에 유럽이 38.80%의 점유율을 차지하게 된 배경에는 수십 년에 걸친 규제 강화, 밀집된 가공 인프라, 고품질 배합을 중시하는 지속적인 개선 문화가 있습니다. EFSA의 MOSH 및 MOAH에 대한 엄격한 심사로 인해 가공업체들은 완전 합성 저방향족 혼합으로의 전환을 강요받고 있으며, 이는 평균을 상회하는 단가와 PFAS 프리 제품의 조기 도입을 촉진하고 있습니다.
아시아태평양은 현재 규모는 작지만, 산업화, 식생활의 변화, 규제 강화에 힘입어 연평균 성장률(CAGR) 5.74%라는 가장 빠른 속도로 성장하고 있습니다. 중국에서 개정된 GB 2760-2024는 규정 준수 기준을 높였으며, 다층적인 인증에 정통한 다국적 공급업체를 우대하고 있습니다. 아세안(ASEAN)의 식품 수출업체들은 EU 및 미국 시장 진출을 위해 국제 기준을 채택하고 있으며, H1 유체의 대상 시장을 확대되고 있습니다.
북미에서는 FDA의 우발적 접촉 관련 규정 시행과 배합 변경을 가속화하는 주 차원의 PFAS 금지 조치에 힘입어, 시장이 성숙 단계에 접어들었음에도 여전히 역동적인 수요가 나타나고 있습니다. 멕시코의 가공업체 기반은 NAFTA 공급망을 활용하고 있으며, 국경 간 감사 요건을 충족하기 위해 이중 인증을 받은 윤활유가 필요합니다.
남미, 중동 및 아프리카는 여전히 초기 단계에 있지만, 인프라 투자와 슈퍼마켓의 확장으로 인해 범용 산업용 오일에서 인증 제품으로의 전환이 촉진되고 있습니다. 브라질에서 유니버솔루션즈와 알쿠사다 간의 유통 제휴는 위조 위험이 높은 지역에서 신뢰할 수 있는 공급 체계를 구축하기 위한 경쟁이 치열해지고 있음을 여실히 보여줍니다.
기타 혜택
- 엑셀 형식 시장 예측(ME) 시트
- 3개월간의 애널리스트 지원
자주 묻는 질문
목차
제1장 서론
제2장 조사 방법
제3장 주요 요약
제4장 시장 구도
제5장 시장 규모 및 성장 예측
제6장 경쟁 구도
제7장 시장 기회 및 향후 전망
AJY 26.08.28According to Mordor Intelligence, the food grade lubricants market size was valued at 64.18 Million liters in 2025 and estimated to grow from 67.51 Million liters in 2026 to reach 86.95 Million liters by 2031, at a CAGR of 5.19% during the forecast period (2026-2031).
This report is Segmented by Classification (H1, H2, and H3), Base Oil (Mineral Oil, Synthetic Oil, and Bio-Based Oil), Product Type (Grease, Hydraulic Fluid, Gear Oil, and Other Products), End-User Industry (Food and Beverage, Cosmetics, Edible Oil, and Others), and Geography (Asia-Pacific, North America, Europe, South America, and Middle-East and Africa).
Global Food Grade Lubricants Market Trends and Insights
Increasing Food-Safety Regulations Tightening Globally
Governments are converging toward more rigorous food-contact rules, forcing lubricant suppliers to upgrade formulations or risk delisting. China's updated GB 2760-2024 extends the country's positive list and closes loopholes around processing aids, triggering demand for fully documented H1 fluids that align with NSF and ISO 21469 audits. In Europe, the EFSA evaluation of MOSH and MOAH has led processors to favor synthetic fluids that eliminate mineral-oil traces, while ISO 21469 certification now signals a higher assurance level than basic NSF registration. The U.S. FDA continues to police 21 CFR 178.3570, and more than 30 individual states have enacted PFAS bans that indirectly shape lubricant chemistry. Suppliers with global regulatory teams convert this complexity into value-added consulting for customers who lack in-house expertise. The cumulative effect lifts entry barriers and cements long-term contracts, fueling volume expansion across the food grade lubricants market.
Surge in Demand for Processed and Ready-To-Eat Foods Requiring Food-Grade Lubricants
Dietary patterns are pivoting to convenience meals, single-serve packages, and omnichannel grocery models that rely on high-throughput machinery. Food Industry 5.0 concepts, such as AI-enabled predictive maintenance, shorten acceptable downtime windows; lubricants, therefore, must deliver longer drain intervals and contamination immunity to justify their selection. As product SKU counts rise, changeover frequency increases, pushing lubricants to tolerate variable loads and temperatures. This synergy between convenience food growth and factory automation amplifies lubricant demand volume as well as performance expectations across the food-grade lubricants market.
High Price Premium Vs. Conventional Industrial Oils
Synthetic H1 fluids still carry a 25% surcharge relative to ordinary mineral oils, deterring small processors that operate on razor-thin margins. Bio-based greases, which make up only 1-5% of total volume, face steeper premiums despite biodegradability advantages. In regions with lower labor costs and longer equipment replacement cycles, management often delays lubricant upgrades until compelled by audits or large retail clients. The price hurdle is expected to erode gradually as local blending, higher base-oil yields, and competition compress margins across the food grade lubricants market.
Other drivers and restraints analyzed in the detailed report include:
- Rapid Automation of Food and Beverage Plants Intensifying Lubricant Duty Cycles
- Phase-Out of PFAS Chemicals Driving Reformulation Demand
- Proliferation of Counterfeit/Non-Certified "H1" Products
For complete list of drivers and restraints, kindly check the Table Of Contents.
Segment Analysis
H1 lubricants captured 64.70% of 2025 volume and are projected to widen their lead at 5.52% CAGR to 2031, cementing a dual role as dominant and fastest-growing segment in the food grade lubricants market share landscape. Processors favor H1 registration even for equipment deemed non-contact to offset contamination risk during maintenance or component failure. The food grade lubricants market size attributed to H1 products will therefore advance alongside more demanding ISO 21469 audits that now scrutinize biological as well as chemical hazards.
H2 fluids, once popular for sealed systems, now occupy a defensive niche as procurement teams prioritize universal compliance over theoretical exposure assessments. H3 soluble oils remain confined to specialized areas such as hook lubrication in meat plants where water-washability is paramount. The impending PFAS ban is indirectly reinforcing H1 loyalty because reformulated synthetics offer strong load capacity at wider operating temperatures, further eroding any perceived performance gap with H2 grades. As a result the classification mix is expected to tilt more heavily toward H1 throughout the forecast horizon, making certification expertise an indispensable pillar of competition within the food grade lubricants market.
Mineral oil blends retained 52.08% share in 2025, securing their role as the volume anchor of the food grade lubricants market. The position rests on well-established supply chains, predictable additive response, and unit costs that suit high-volume bakeries and dairies. Even so, adoption of bio-based alternatives is running ahead of synthetics in percentage terms, clocking a 5.86% CAGR that outpaces the broader market. The food grade lubricants market size linked to bio-based products therefore remains small but is scaling quickly, propelled by corporate carbon targets and retailer pressure for "planet-friendly" sourcing.
Synthetic base stocks, though premium priced, attract processors running 24/7 automation where downtime risks dwarf fluid costs. Superior thermal range and resistance to aggressive cleaners extend drain intervals, slicing total lubricant-related maintenance tasks by double-digit margins in many plants.
Complete Report Scope:
- By Classification
- H1 (Incidental contact)
- H2 (No contact)
- H3 (Soluble oils)
- By Base Oil
- Mineral Oil
- Synthetic Oil
- Bio-based Oil
- By Product Type
- Grease
- Hydraulic Fluid
- Gear Oil
- Other Products Types (Compressor Oil, Chain Oil, etc.)
- By End-user Industry
- Food and Beverage
- Cosmetics
- Edible Oil
- Other End-user Industries (Packaging and Logistics Equipment, etc.)
- By Geography
- Asia-Pacific
- China
- Japan
- India
- South Korea
- ASEAN Countries
- Rest of Asia-Pacific
- North America
- United States
- Canada
- Mexico
- Europe
- Germany
- United Kingdom
- France
- Italy
- Spain
- Russia
- NORDIC Countries
- Rest of Europe
- South America
- Brazil
- Argentina
- Rest of South America
- Middle-East and Africa
- Saudi Arabia
- South Africa
- Rest of Middle-East and Africa
- Asia-Pacific
Geography Analysis
Europe's 38.80% share in 2025 stems from decades-old regulatory depth, dense processing infrastructure, and continuous improvement cultures that reward premium formulations. EFSA scrutiny of MOSH and MOAH pushes processors toward fully synthetic, low-aromatic blends, driving above-average unit prices and early adoption of PFAS-free options.
Asia-Pacific, though smaller today, registers the fastest pace at 5.74% CAGR, fueled by industrialization, dietary shifts, and tightening standards. China's revised GB 2760-2024 elevates baseline compliance and favors multinational suppliers versed in multilayer certification. ASEAN food exporters are adopting international standards to gain EU and U.S. market access, broadening the addressable base for H1 fluids.
North America commands mature yet still dynamic demand, underpinned by FDA enforcement of incidental-contact rules and state-level PFAS bans that expedite formulation changeovers. Mexico's processor base leverages NAFTA supply chains and requires dual-certified lubricants to satisfy cross-border audits.
South America, and the Middle-East and Africa remain early-stage, yet infrastructure spending and supermarket expansion are catalyzing upgrades from generic industrial oils to certified products. Brazil's distribution partnership between Univar Solutions and Arxada underscores the race to establish credible supply in jurisdictions where counterfeit risk runs high.
- CITGO Petroleum Corporation
- Condat
- Dow
- DuPont
- Exxon Mobil Corporation
- Freudenberg SE
- FUCHS
- Interflon Belgium NV
- Lubrication Engineers
- Lubriplate Lubricants Company.
- Matrix Specialty Lubricants
- Petro-Canada Lubricants Inc.
- Renewable Lubricants, Inc.
- Schaeffer Manufacturing Co.,
- TotalEnergies
- UMW GRANTT International Sdn Bhd.
Additional Benefits:
- The market estimate (ME) sheet in Excel format
- 3 months of analyst support
TABLE OF CONTENTS
1 Introduction
- 1.1 Study Assumptions and Market Definition
- 1.2 Scope of the Study
2 Research Methodology
3 Executive Summary
4 Market Landscape
- 4.1 Market Overview
- 4.2 Market Drivers
- 4.2.1 Increasing Food-Safety Regulations Tightening Globally
- 4.2.2 Surge in Demand for Processed and Ready-to-Eat Foods Requiring Food-Grade Lubricants
- 4.2.3 Rapid Automation of Food and Beverage Plants Intensifying Lubricant Duty Cycles
- 4.2.4 Expanding Food Processing Infrastructure in Developing Regions
- 4.2.5 Phase-out of PFAS Chemicals Driving Reformulation Demand
- 4.3 Market Restraints
- 4.3.1 High Price Premium Vs. Conventional Industrial Oils
- 4.3.2 Limited User Awareness and Training in Emerging Economies
- 4.3.3 Proliferation of Counterfeit/Non-Certified H1 Products
- 4.4 Value Chain Analysis
- 4.5 Porter's Five Forces
- 4.5.1 Bargaining Power of Suppliers
- 4.5.2 Bargaining Power of Buyers
- 4.5.3 Threat of New Entrants
- 4.5.4 Threat of Substitutes
- 4.5.5 Competitive Rivalry
5 Market Size and Growth Forecasts (Volume)
- 5.1 By Classification
- 5.1.1 H1 (Incidental contact)
- 5.1.2 H2 (No contact)
- 5.1.3 H3 (Soluble oils)
- 5.2 By Base Oil
- 5.2.1 Mineral Oil
- 5.2.2 Synthetic Oil
- 5.2.3 Bio-based Oil
- 5.3 By Product Type
- 5.3.1 Grease
- 5.3.2 Hydraulic Fluid
- 5.3.3 Gear Oil
- 5.3.4 Other Products Types (Compressor Oil, Chain Oil, etc.)
- 5.4 By End-user Industry
- 5.4.1 Food and Beverage
- 5.4.2 Cosmetics
- 5.4.3 Edible Oil
- 5.4.4 Other End-user Industries (Packaging and Logistics Equipment, etc.)
- 5.5 By Geography
- 5.5.1 Asia-Pacific
- 5.5.1.1 China
- 5.5.1.2 Japan
- 5.5.1.3 India
- 5.5.1.4 South Korea
- 5.5.1.5 ASEAN Countries
- 5.5.1.6 Rest of Asia-Pacific
- 5.5.2 North America
- 5.5.2.1 United States
- 5.5.2.2 Canada
- 5.5.2.3 Mexico
- 5.5.3 Europe
- 5.5.3.1 Germany
- 5.5.3.2 United Kingdom
- 5.5.3.3 France
- 5.5.3.4 Italy
- 5.5.3.5 Spain
- 5.5.3.6 Russia
- 5.5.3.7 NORDIC Countries
- 5.5.3.8 Rest of Europe
- 5.5.4 South America
- 5.5.4.1 Brazil
- 5.5.4.2 Argentina
- 5.5.4.3 Rest of South America
- 5.5.5 Middle-East and Africa
- 5.5.5.1 Saudi Arabia
- 5.5.5.2 South Africa
- 5.5.5.3 Rest of Middle-East and Africa
- 5.5.1 Asia-Pacific
6 Competitive Landscape
- 6.1 Market Concentration
- 6.2 Strategic Moves
- 6.3 Market Share(%)/Ranking Analysis
- 6.4 Company Profiles (includes Global level Overview, Market level overview, Core Segments, Financials as available, Strategic Information, Market Rank/Share for key companies, Products and Services, Recent Developments)
- 6.4.1 CITGO Petroleum Corporation
- 6.4.2 Condat
- 6.4.3 Dow
- 6.4.4 DuPont
- 6.4.5 Exxon Mobil Corporation
- 6.4.6 Freudenberg SE
- 6.4.7 FUCHS
- 6.4.8 Interflon Belgium NV
- 6.4.9 Lubrication Engineers
- 6.4.10 Lubriplate Lubricants Company.
- 6.4.11 Matrix Specialty Lubricants
- 6.4.12 Petro-Canada Lubricants Inc.
- 6.4.13 Renewable Lubricants, Inc.
- 6.4.14 Schaeffer Manufacturing Co.,
- 6.4.15 TotalEnergies
- 6.4.16 UMW GRANTT International Sdn Bhd.
7 Market Opportunities and Future Outlook
- 7.1 White-space and Unmet-need Assessment