|
시장보고서
상품코드
2114995
유화 방지제 시장 : 시장 점유율 분석, 업계 동향 및 통계, 성장 예측(2026-2031년)Demulsifier - Market Share Analysis, Industry Trends & Statistics, Growth Forecasts (2026 - 2031) |
||||||
 Mordor Intelligence
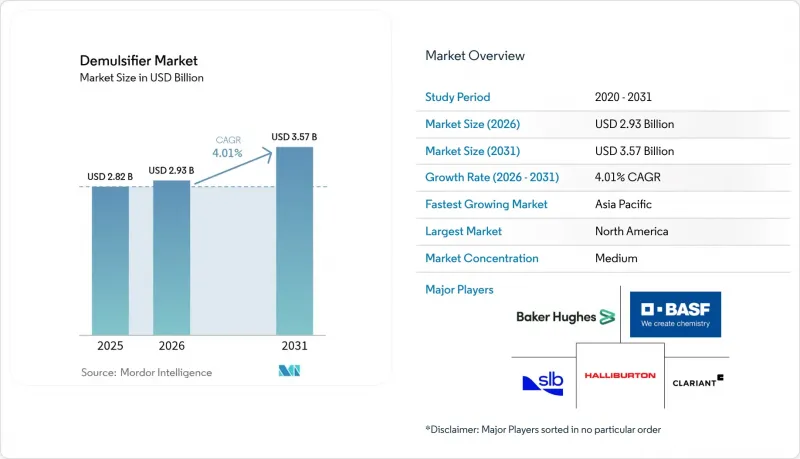
Mordor Intelligence에 의하면, 2026년 유화 방지제 시장 규모는 29억 3,000만 달러로 추정되고, 2025년 28억 2,000만 달러에서 성장하여 2031년에는 35억 7,000만 달러에 이를 것으로 예측됩니다.
2026-2031년 연평균 성장률(CAGR) 4.01%로 성장할 것으로 전망됩니다.
본 보고서는 용해성별(수용성 및 유용성), 화학적 성질별(음이온성, 양이온성 등), 유전 위치별(육상 및 해상), 용도별(원유 처리, 정유시설 등), 지역별(아시아태평양, 북미, 유럽, 남미, 중동 및 아프리카)로 분류되어 있습니다. 시장 전망은 금액(달러) 기준으로 제시되어 있습니다.
세계의 유화 방지제 시장 동향 및 인사이트
성숙한 유전 공급망 보안 요구
생산량이 감소하는 추세에 있는 저류층에서 수분 비율이 증가함에 따라, 생산자들은 기존 자산을 유지하기 위해 개별적으로 조정된 분리 프로그램을 도입할 수밖에 없습니다. 베이커 휴즈(Baker Hughes)의 보고서에 따르면, 현재 전 세계 원유 생산량의 70%는 성숙 유전에서 생산되고 있으며, 이러한 비율 증가는 고효율 유화 방지제에 대한 의존도를 높이고 있습니다. 현장 시험에 따르면, 스퀴즈 처리 패키지를 통해 생산량을 50%에서 200%까지 향상시키면서 유정당 화학약품 비용을 2,500달러로 억제할 수 있어, 화학적 개입의 높은 비용 효율성이 입증되었습니다. 각 운영사는 이러한 이점을 저류층 압력 저하와 이익률 축소를 상쇄하는 데 필수적인 요소로 간주하고 있습니다. 그 결과, 유화 방지제 시장 수요는 기존 자산의 수명 연장 프로그램과 밀접하게 연결되어 있습니다. 전 세계 생산자들이 원유 가격 변동 위험을 헤지하기 위해 브라운필드 포트폴리오를 최적화해 나가는 가운데, 이러한 추세는 중기적인 성장의 주축으로 계속될 것으로 예측됩니다.
더 깊은 해저에서의 생산 및 고수분 유정으로의 전환
멕시코만, 북해 및 브라질의 프리솔트층에 대한 심해 투자는 유화 방지제 기술에 대해 매우 엄격한 성능 요건을 부과하고 있습니다. 부유식 생산 시스템의 분리 장치는 수분 함량이 80%를 초과할 가능성이 있는 유화액을 처리하면서, 1리터당 40mg 미만의 유분 배출 제한을 충족해야 합니다. 따라서 유화 방지제 시장에서는 탈수 효율을 저하시키지 않으면서 고압·고온을 견딜 수 있는 배합 혁신이 진행되고 있습니다. 각 운영사가 탑사이드의 중량을 줄이기 위해 화학 약품을 소형 코어레서나 멤브레인 스키드와 결합하고 있기 때문에 해양 용도는 연평균 성장률(CAGR) 5.08%로 성장을 지속하고, 있습니다. 이러한 프로젝트는 본질적으로 장기간에 걸쳐 진행되며, 유전 수명 주기 전반에 걸쳐 지속적인 화학 약품 수요가 보장됩니다. 가혹한 해저 환경에서 입증된 성능을 제공하는 공급업체들은 다년간의 계약을 수주하며 수익 전망을 확고히 하고 있습니다.
원유 가격 변동이 생산용 화학약품에 대한 설비 투자를 억제
국제에너지포럼(IEF)은 2025년에 140만 배럴/일공급 과잉이 예상된다고 예측하고 있으며, 이러한 시나리오로 인해 운영사들은 재량적 화학약품 지출을 미룰 수밖에 없는 상황에 몰리고 있습니다. 현물 가격이 손익분기점을 밑돌면 조달 팀은 기본 조달량을 우선시하고 가격 지수 연동형 계약을 재협상하게 되어 공급업체의 이익률이 압박받게 됩니다. 이온 액체 등 단위 비용이 높은 특수 블렌드 제품은 단기적인 감축의 주요 대상이 됩니다. 이러한 주기적인 침체는 단기적으로 가장 큰 역풍이며, 예상 연평균 성장률(CAGR)을 1.1포인트 끌어내리고 있습니다. 가격 회복에 따라 화학제품 채택은 회복될 것, 이러한 억제 경향은 유화방지제 시장이 석유의 거시 주기에 민감하다는 점을 여실히 드러내고 있습니다.
부문 분석
2025년 매출액 중 유용성 제품이 63.62%를 차지했으며, 1차 탈수 유닛 및 분리 장치에 주입되는 데 있어 그 확고한 역할이 부각되고 있습니다. 이러한 우위는 유정 입구에서 유수 분리를 촉진하는 신속한 계면 작용에 기인하며, 이는 부식 및 탈염 설비의 문제를 최소화하기 위한 중요한 단계입니다. 수용성 제품은 현재 시장 점유율이 낮지만, 더욱 엄격한 폐기 제한에 대응하기 위해 사업자들이 생산수 처리 인프라를 확충하고 있어 연평균 성장률(CAGR) 5.78%로 빠르게 확대되고 있습니다. 이러한 급증은 원유 품질에만 초점을 맞추는 것이 아니라, 종합적인 물 관리로 전환되고 있는 유화방지제 시장 동향과 일치합니다.
2세대 막 생물 반응기(MBR) 시스템에서는 공급 유량을 전처리하기 위해 수용성 유화 방지제의 사용이 점점 더 많이 지정되고 있으며, 이로 인해 물 속의 유분 정제 단계의 효율이 향상되고 있습니다. 응집 매체나 고분자 흡착제를 채택한 하이브리드 처리 라인은 업스트림 공정에서 수용성 화학 물질이 유화 불안정화를 촉진함으로써 효율이 향상됩니다. 그 결과, 각 공급업체들은 기존의 수지계 제품에 그치지 않고, 폭넓은 pH 범위에서 성능을 발휘하는 폴리에틸렌글리콜,폴리에테르아민, 생분해성 에스테르를 주성분으로 하는 제품으로 포트폴리오를 확대되고 있습니다. 이러한 동향은 사양 패턴의 완만하지만 분명한 변화를 보여주고 있으며, 향후 유화방지제 시장 수요 구조를 재편하게 될 것입니다.
2025년에는 비이온성 블렌드가 매출의 34.74%를 차지한 것으로 평가되었으며, 라이트·타이트 오일부터 초중질 원유에 이르기까지 모든 원유 등급에 대응할 수 있는 범용성이 높이 평가받고 있습니다. 이들은 부식 방지제, 스케일 억제제, 파라핀 용제와 원활하게 통합되어, 여러 유정이 있는 패드에서의 화학 물질 관리를 단순화합니다. 대조적으로, 이온 액체는 연평균 성장률(CAGR) 6.47%라는 눈부신 성장을 보이고 있으며, 200°C까지의 저류층 조건이나 200,000 ppm을 초과하는 염분 농도에서도 뛰어난 안정성을 보여주는 실험실 데이터를 뒷받침하고 있습니다.
비용 측면의 장벽과 공급망의 미성숙으로 인해 상용화의 기세는 다소 주춤하고 있지만, 남중국해와 멕시코만에서 진행된 시범 시험의 성공은 그 잠재력을 입증하고 있습니다. 양성 및 양이온성 제품은 전하에 기반한 분리 메커니즘이 산성 원유에서 더 높은 효율을 가져오기 때문에 틈새 시장에서 수요를 유지하고 있습니다. 한편, 음이온성 계면활성제는 정유시설의 탈염 공정에서 안정적인 수요가 예상되며, 염수 탈염과 호환성이 좋아 염화물 제거에 기여하고 있습니다. 향후 10년 동안 경쟁 우위는 이온성 액체의 기능성과 비이온성 계면활성제의 비용 효율성을 융합하는 공급업체의 능력에 달려 있으며, 이러한 전망은 유화 방지제 시장에 더 큰 변화를 가져올 가능성이 있습니다.
지역별 분석
북미는 풍부한 셰일 액체 생산량과 멕시코만의 복잡한 심해 자산을 바탕으로 2025년에는 매출의 30.24%를 차지하며 전 세계 유화 방지제 시장을 주도했습니다. 미국 운영사들은 2025년에 생산량을 늘릴 전망이며, ESG 규제로 인해 배출 허가 요건이 엄격해지는 상황에서도 분리용 화학제품에 대한 안정적인 수요가 유지될 것입니다. 캐나다의 PAH(다환 방향족 탄화수소)에 대한 규제 강화는 공급업체들이 페놀계 전구체를 피하고 친환경 화학 물질로 전환하도록 더욱 촉진하고 있습니다. 지역 서비스 기업들은 주요 화학 제조업체와 제휴하여 통합적인 최적화 솔루션을 제공하고 있으며, 퍼미안 및 몬토니 지층 전역에서 시추 패드 수가 증가함에 따라 유화 방지제 선정을 종합적인 물 관리 전략에 통합하고 있습니다.
아시아태평양은 중국의 정제 처리량이 사상 최고치인 1,480만 배럴/일(bpd)에 도달하고, 절강성과 광둥성 클러스터에서 석유화학에 대한 투자가 지속되고 있는 것을 배경으로 연평균 성장률(CAGR) 6.52%라는 놀라운 성장세를 보이고 있습니다. 통합형 복합 시설에서는 안정적인 유화액을 생성하는 중질 원유나 잔류물 계열 원료를 처리함으로써 유화 방지제 사용량이 증가하고 있습니다. 동남아시아의 화학 시장은 2030년까지 4,480억 달러로 거의 두 배로 증가할 전망이며, 이에 따라 특수 화학제품 제조업체들이 베트남, 인도네시아, 말레이시아로 진출하고 있습니다. 인도에서는 정유시설의 생산 라인 확대와 석탄층 메탄(CBM) 개발이 진행되고 있으며, 현지 사업자들이 ‘바랏 스테이지 VI’ 연료 기준을 충족하기 위해 첨단 포장 기술을 도입함에 따라 수요량이 더욱 증가할 것으로 예측됩니다.
유럽 및 중동 및 아프리카에서는 엄격한 REACH 규정 준수 및 북해와 아라비아 반도의 대규모 기존 시설 개보수를 배경으로, 성숙기에 접어들었음에도 불구하고 견조한 수요가 나타나고 있습니다. 유럽의 사업자들은 ‘물 프레임워크 지침’의 기준을 충족하기 위해 생분해성 유화방지제를 우선적으로 채택하고 있는 반면, 중동의 생산자들은 고염분 농도의 저류층에서 수처리 비용 절감에 주력하고 있습니다. 남미에서는 브라질의 프리솔트층 포트폴리오 확대와 아르헨티나의 비전통 자원 개발이 견인차 역할을 하며 완만한 성장이 예상됩니다. 이러한 지역별 차이는 현지 생산 상황, 규제 체계, 투자 주기가 유화방지제 시장 동향을 어떻게 형성하고 있는지를 여실히 보여줍니다.
기타 혜택 :
- 엑셀 형식 시장 예측(ME) 시트
- 3개월간의 애널리스트 지원
자주 묻는 질문
목차
제1장 서론
제2장 조사 방법
제3장 주요 요약
제4장 시장 구도
제5장 시장 규모 및 성장 예측
제6장 경쟁 구도
제7장 시장 기회 및 향후 전망
AJY 26.08.28According to Mordor Intelligence, demulsifier market size in 2026 is estimated at USD 2.93 billion, growing from 2025 value of USD 2.82 billion with 2031 projections showing USD 3.57 billion, growing at 4.01% CAGR over 2026-2031.
This report is Segmented by Solubility (Water Soluble and Oil Soluble), Chemistry (Anionic, Cationic, and More), Oilfield Location (Onshore and Offshore), Application (Crude Oil Processing, Petro Refineries, and More), and Geography (Asia-Pacific, North America, Europe, South America, Middle East and Africa). The Market Forecasts are Provided in Terms of Value (USD).
Global Demulsifier Market Trends and Insights
Supply-chain Security Needs in Mature Oilfields
Rising water-cut levels in declining reservoirs are forcing producers to adopt tailored separation programs that keep established assets viable. Baker Hughes reports that 70% of global crude flows now originate from mature fields, a share that heightens dependence on high-efficiency demulsifiers. Field trials demonstrate that squeeze-treatment packages can lift production between 50% and 200% while bringing per-well chemical costs down to USD 2,500, reinforcing the cost-effectiveness of chemical intervention. Operators view these gains as vital for offsetting lower reservoir pressures and shrinking margins. As a result, demulsifier market demand is tightly linked to life-extension programs for legacy assets. The trend is expected to remain a medium-term growth pillar as global producers optimize brownfield portfolios to hedge against crude-price volatility.
Shift Toward Deeper Offshore Production & Higher Water-Cut Wells
Deepwater investments in the Gulf of Mexico, the North Sea, and pre-salt Brazil place exacting performance requirements on demulsifier technology. Separators on floating production systems must process emulsions that may exceed 80% water content while meeting discharge limits below 40 mg oil per liter. The demulsifier market is therefore innovating around formulations that tolerate high pressure and temperature without sacrificing dehydration efficiency. Offshore applications are delivering a 5.08% CAGR as operators pair chemicals with compact coalescers and membrane skids to save topside weight. These projects are inherently long-cycle, locking in durable chemical demand across the life of field. Suppliers that provide proven performance under extreme subsea conditions secure multi-year contracts, anchoring revenue visibility.
Volatile Crude-Oil Prices Curbing CapEx on Production Chemicals
The International Energy Forum predicts a 1.4 million bpd surplus in 2025, a scenario that pressures operators to defer discretionary chemical spend. When spot prices slide below breakeven thresholds, procurement teams prioritize base-load volumes and renegotiate price-indexed contracts that compress supplier margins. Specialty blends carrying higher unit costs, including ionic liquids, become prime targets for short-term cutbacks. This cyclical pullback is the strongest near-term headwind and subtracts 1.1 percentage points from the projected CAGR. Although chemical adoption rebounds with pricing recovery, the restraint underscores the demulsifier market's sensitivity to macro-oil cycles.
Other drivers and restraints analyzed in the detailed report include:
- Stringent Water-Discharge Norms Raising Separation Performance Specs
- Growing Demand from Increasing Production of Crude Oil
- Increasing Bans on Alkyl-Phenol Ethoxylates
For complete list of drivers and restraints, kindly check the Table Of Contents.
Segment Analysis
Oil-soluble products controlled 63.62% of 2025 revenues, underscoring their entrenched role in primary dehydration units and separator train injections. Their dominance is rooted in quick interfacial action that expedites free-water drop-out at the wellhead, a critical step in minimizing corrosion and desalter upsets. Water-soluble alternatives, though smaller today, are scaling quickly at a 5.78% CAGR as operators expand produced-water treatment infrastructure to meet stricter disposal limits. This surge aligns with the demulsifier market's pivot toward holistic water management rather than singular focus on crude quality.
Second-generation membrane-bioreactor systems increasingly specify soluble demulsifiers to pre-condition feed streams, boosting oil-in-water polishing stages. Hybrid treatment trains employing coalescing media and polymeric adsorbents gain efficiency when soluble chemistries improve emulsion destabilization upstream. Consequently, suppliers broaden portfolios beyond conventional resin bases to polyethylene glycol, polyetheramine, and biodegradable ester backbones that perform across varying pH windows. The trend signals a gradual but unmistakable shift in specification patterns that will reshape future demulsifier market demand profiles.
Non-ionic blends held 34.74% revenue in 2025, prized for versatility across crude grades from light tight oil to extra-heavy. They integrate seamlessly with corrosion inhibitors, scale squeezes, and paraffin solvents, simplifying chemical management for multi-well pads. Ionic liquids, in contrast, are the breakout story with a 6.47% CAGR, buoyed by laboratory data showing superior stability under reservoir conditions up to 200 °C and salinities above 200,000 ppm.
Commercial momentum is tempered by cost barriers and supply-chain immaturity, yet pilot successes in the South China Sea and Gulf of Mexico underscore their potential. Amphoteric and cationic products retain niche appeal where charge-based separation mechanisms yield higher efficiency in acidic crudes. Meanwhile, anionic surfactants see steady demand in refinery desalter circuits, where their compatibility with brine desalting aids in chloride removal. Over the coming decade, competitive edge will hinge on suppliers' ability to hybridize ionic-liquid functionalities with non-ionic cost profiles, a prospect that could further disrupt the demulsifier market.
Complete Report Scope:
- By Solubility
- Water Soluble
- Oil Soluble
- By Chemistry
- Anionic
- Cationic
- Non-ionic
- Amphoteric
- Ionic Liquids
- By Oilfield Location
- Onshore
- Offshore
- By Application
- Crude Oil Processing
- Petro Refineries
- Sludge Oil Treatment
- Oil-based Power Plants
- Lubricant Manufacturing
- Other Applications (Enhanced Oil Recovery, etc.)
- By Geography
- Asia-Pacific
- China
- Japan
- India
- South Korea
- ASEAN Countries
- Rest of Asia-Pacific
- North America
- United States
- Canada
- Mexico
- Europe
- Germany
- United Kingdom
- France
- Italy
- Spain
- Russia
- NORDIC Countries
- Rest of Europe
- South America
- Brazil
- Argentina
- Rest of South America
- Middle East and Africa
- Saudi Arabia
- South Africa
- Asia-Pacific
Geography Analysis
North America led the global demulsifier market with 30.24% revenue in 2025, anchored by prolific shale liquids output and complex Gulf of Mexico deepwater assets. Operators in the United States are set to boost 2025 production, reinforcing a steady draw on separation chemicals even as ESG mandates tighten discharge permits. Canada's heightened scrutiny of PAHs further nudges suppliers toward eco-friendly chemistries that avoid phenolic precursors. Regional service companies partner with chemical majors to deliver bundled optimization offerings, embedding demulsifier selection into holistic water-management strategies as pad counts rise across the Permian and Montney formations.
Asia-Pacific stands out with a 6.52% CAGR, underpinned by China's record 14.8 million bpd refining throughput and sustained petrochemical investment across Zhejiang and Guangdong clusters. Integrated complexes amplify demulsifier usage by processing heavier crudes and resid-based feeds that generate stable emulsions. Southeast Asia's chemical market is poised to nearly double to USD 448 billion by 2030, drawing specialty-chemical players into Vietnam, Indonesia, and Malaysia. India's expanded refinery slate and coal-bed methane developments present additional volume upside as local operators adopt advanced separation packages to meet Bharat Stage-VI fuel standards.
Europe and the Middle East & Africa display mature yet resilient demand, guided by stringent REACH compliance and large-scale brownfield upgrades in the North Sea and Arabian Peninsula. European operators prioritize biodegradable demulsifiers to satisfy Water Framework Directive thresholds, whereas Middle Eastern producers focus on reducing water-handling costs in high-salinity reservoirs. South America offers moderate growth led by Brazil's expanding pre-salt portfolio and Argentina's unconventional drives. Collectively, geographic variations reveal how local production profiles, regulatory regimes, and investment cycles shape the trajectory of the demulsifier market.
- Baker Hughes Company
- BASF
- Clariant
- Croda International Plc
- Dorf Ketal
- Dow
- Ecolab
- Halliburton Company
- Innospec
- NCPIQ8 (National Chemical & Petroleum Industries Co.)
- PT Eonchemicals Putra
- Sasol
- SLB
- Solvay
- Stepan Company
Additional Benefits:
- The market estimate (ME) sheet in Excel format
- 3 months of analyst support
TABLE OF CONTENTS
1 Introduction
- 1.1 Study Assumptions & Market Definition
- 1.2 Scope of the Study
2 Research Methodology
3 Executive Summary
4 Market Landscape
- 4.1 Market Overview
- 4.2 Market Drivers
- 4.2.1 Supply-chain security needs in mature oilfields
- 4.2.2 Shift toward deeper offshore production & higher water-cut wells
- 4.2.3 Stringent water-discharge norms raising separation performance specs
- 4.2.4 Growing Demand from Increasing Production of Crude Oil
- 4.2.5 Commercialisation of biodegradable polyester-based demulsifiers
- 4.3 Market Restraints
- 4.3.1 Volatile crude-oil prices curbing CapEx on production chemicals
- 4.3.2 Increasing bans on alkyl-phenol ethoxylates
- 4.3.3 Scale-up challenges for ionic-liquid formulations
- 4.4 Value Chain Analysis
- 4.5 Porter's Five Forces
- 4.5.1 Threat of New Entrants
- 4.5.2 Bargaining Power of Buyers
- 4.5.3 Bargaining Power of Suppliers
- 4.5.4 Threat of Substitutes
- 4.5.5 Intensity of Competitive Rivalry
5 Market Size & Growth Forecasts (Value)
- 5.1 By Solubility
- 5.1.1 Water Soluble
- 5.1.2 Oil Soluble
- 5.2 By Chemistry
- 5.2.1 Anionic
- 5.2.2 Cationic
- 5.2.3 Non-ionic
- 5.2.4 Amphoteric
- 5.2.5 Ionic Liquids
- 5.3 By Oilfield Location
- 5.3.1 Onshore
- 5.3.2 Offshore
- 5.4 By Application
- 5.4.1 Crude Oil Processing
- 5.4.2 Petro Refineries
- 5.4.3 Sludge Oil Treatment
- 5.4.4 Oil-based Power Plants
- 5.4.5 Lubricant Manufacturing
- 5.4.6 Other Applications (Enhanced Oil Recovery, etc.)
- 5.5 By Geography
- 5.5.1 Asia-Pacific
- 5.5.1.1 China
- 5.5.1.2 Japan
- 5.5.1.3 India
- 5.5.1.4 South Korea
- 5.5.1.5 ASEAN Countries
- 5.5.1.6 Rest of Asia-Pacific
- 5.5.2 North America
- 5.5.2.1 United States
- 5.5.2.2 Canada
- 5.5.2.3 Mexico
- 5.5.3 Europe
- 5.5.3.1 Germany
- 5.5.3.2 United Kingdom
- 5.5.3.3 France
- 5.5.3.4 Italy
- 5.5.3.5 Spain
- 5.5.3.6 Russia
- 5.5.3.7 NORDIC Countries
- 5.5.3.8 Rest of Europe
- 5.5.4 South America
- 5.5.4.1 Brazil
- 5.5.4.2 Argentina
- 5.5.4.3 Rest of South America
- 5.5.5 Middle East and Africa
- 5.5.5.1 Saudi Arabia
- 5.5.5.2 South Africa
- 5.5.1 Asia-Pacific
6 Competitive Landscape
- 6.1 Market Concentration
- 6.2 Strategic Moves
- 6.3 Market Share Analysis
- 6.4 Company Profiles (includes Global level Overview, Market level overview, Core Segments, Financials as available, Strategic Information, Market Rank/Share for key companies, Products & Services, and Recent Developments)
- 6.4.1 Baker Hughes Company
- 6.4.2 BASF
- 6.4.3 Clariant
- 6.4.4 Croda International Plc
- 6.4.5 Dorf Ketal
- 6.4.6 Dow
- 6.4.7 Ecolab
- 6.4.8 Halliburton Company
- 6.4.9 Innospec
- 6.4.10 NCPIQ8 (National Chemical & Petroleum Industries Co.)
- 6.4.11 PT Eonchemicals Putra
- 6.4.12 Sasol
- 6.4.13 SLB
- 6.4.14 Solvay
- 6.4.15 Stepan Company
7 Market Opportunities & Future Outlook
- 7.1 White-space & Unmet-need Assessment