|
시장보고서
상품코드
2115027
버스 좌석 시장 : 점유율 분석, 업계 동향과 통계, 성장 예측(2026-2031년)Bus Seat - Market Share Analysis, Industry Trends & Statistics, Growth Forecasts (2026 - 2031) |
||||||
 Mordor Intelligence
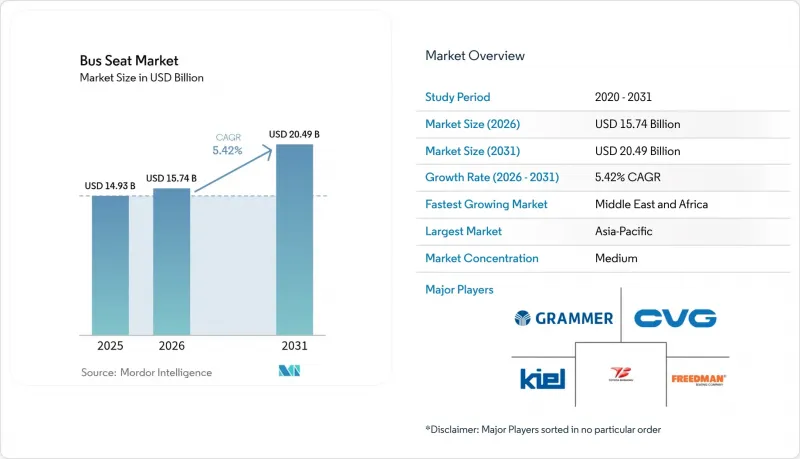
Mordor Intelligence에 의하면, 버스 좌석 시장 규모는 2025년 149억 3,000만 달러에서 2026년에는 157억 4,000만 달러로 확대되어 2026년부터 2031년까지 CAGR 5.42%로 성장을 지속하여, 2031년에는 204억 9,000만 달러에 이를 것으로 예측됩니다.
본 보고서는 좌석 유형(표준, 리클라이닝 등), 구성 부품(프레임(강철, 알루미늄, 마그네슘) 등), 버스 유형(노선버스/도시버스, 기타),좌석 수(40석 이하, 그 이상), 용도(OEM 순정 장비, 애프터마켓/개조), 지역별로 분류되어 있습니다. 시장 예측은 금액(달러) 기준으로 제시되어 있습니다.
전 세계 버스 좌석 시장 동향 및 인사이트
전기 버스 및 전기 스쿨버스 조달 급증
전기 버스 도입이 확대됨에 따라 중량 제한이 재검토되고 있으며, 배터리 주행 거리를 확보하기 위해 1kg 단위로 경량화를 도모하는 좌석 설계가 요구되고 있습니다. 수용 인원별 부문에서는 편차가 나타납니다. 40석 미만 버스는 견조한 연평균 성장률(CAGR)을 기록하고 있는 반면, 41-70석 버스는 14.91%의 연평균 성장률(CAGR)로 확대되고 있습니다. 블루버드(Bluebird)사의 보고서에 따르면, 전기 스쿨버스는 현재 매출의 10분의 1 가까이 차지하고 있으며, 평균 거래 가격은 30만 달러를 초과하는데, 이는 디젤 차량의 3배에 해당합니다.
대도시의 대중교통 설비 투자(CAPEX) 증가
도시 지역의 교통 정체와 대기질 목표를 배경으로, 메가시티의 기획 담당자들은 고급 인테리어를 갖춘 버스 차량 군에 대한 설비 투자(CAPEX)를 확대하는 방향으로 나아가고 있습니다. 아시아태평양은 여전히 성장의 원동력이 되고 있으며, 중국, 인도,동남아시아의 견인에 힘입어, 이 지역의 버스 좌석 시장은 2025-2030년 연평균 성장률(CAGR) 8.33%를 나타낼 것으로 예측됩니다. 당국은 승객 유지를 위해 USB 충전 포트, 에어컨 통풍구, 인체공학적으로 설계된 쿠션 등을 표준 사양으로 지정하는 것이 일반적입니다. 41-70인승 버스가 주류를 이루는 이유는 혼잡한 도로에서 수송 능력과 기동성의 균형이 잘 잡혀 있기 때문입니다. 북미의 도시 버스 인도 대수는 2023년에 4,349대에 달하고,, 2022년 대비 전년 대비 7% 증가했습니다.
철강 및 폴리우레탄 가격 변동
원자재 가격의 불안정성은 이익률을 압박하고 있으며, 제조업체들은 장기 OEM 계약에 부담을 주는 동적인 가격 전략을 시행할 수밖에 없는 상황에 처해 있습니다. 폴리우레탄 가격의 급등은 내장재 분야로 파급되어, 공급업체들은 헤지 조치를 취하거나 재활용 소재 및 바이오 유래 화학 물질로 대체해야 하는 상황에 몰리고 있습니다. 수직 통합형 기업들은 장기 계약을 확보함으로써 수익을 보호하고 있지만, 중소기업들은 현금 흐름 부족에 직면해 있으며, 이는 업계 재편을 가속화할 가능성이 있습니다.
부문 분석
2025년 버스 좌석 시장에서는 비용 효율성을 중시하는 도시 지역 사업자를 중심으로 표준 시트가 53.12%의 점유율을 차지했습니다. 리클라이닝 시트는 견조한 점유율을 유지하고 있으며, 연평균 성장률(CAGR) 8.78%라는 기하급수적인 성장이 예상되어, 도시 간 및 고급 대중교통 서비스를 혁신할 것으로 전망됩니다. 접이식 좌석은 유연한 셔틀 운행에 대응하고 있는 반면, 운전자/운영자용 좌석에는 서스펜션 및 조절 기능이 탑재되어 단가를 끌어올리고 있습니다. 일체형 어린이용 시트는 여전히 틈새 시장이지만, UNECE(유엔 유럽 경제 위원회) 규정에 따라 규제 측면에서 호재를 맞이하고 있습니다. 프리미엄화 추세에 따라 평균 판매 가격이 상승하고 있으며, 특히 항공사나 라이드셰어 서비스가 승객 확보를 놓고 경쟁하는 노선에서 리클라이닝 시트 제품의 버스 좌석 시장 규모가 확대되고 있습니다. 풀 리클라이닝 기구나 마사지 시스템에 투자하는 공급업체는 가격 결정력을 확보하고 있으며, OEM의 차별화 전략과의 연계를 강화하고 있습니다.
버스 좌석 업계는 점점 더 엄격해지는 충돌 안전 시험을 준수해야 합니다. 따라서 리클라이닝 좌석 프레임에는 UNECE R80 규격을 충족하면서도 중량 제한을 준수하기 위해 고장력 강철과 알루미늄이 결합되어 있습니다. 각 OEM 업체들은 표준 좌석과 프리미엄 좌석을 조합한 레이아웃을 추진하고 있으며, 이를 통해 각 업체는 평면도를 재설계하지 않고도 쾌적성 등급을 업그레이드할 수 있게 되었습니다.
모든 좌석은 견고한 구조에서 시작되기 때문에 2025년 매출에서 프레임 어셈블리가 48.05%를 차지했으나, 스마트 액세서리와 센서는 2031년까지 연평균 성장률(CAGR)이 11.08%로 가장 빠른 성장세를 보이고 있습니다. 자동 승객 계수 시스템의 정확도는 98% 이상을 달성하고 있어, 이를 통해 각 사업자는 운행 간격을 조정하여 운임 수익을 향상시킬 수 있습니다. 이러한 풍부한 데이터 기능을 통해 공급업체는 분석 서비스 구독을 번들로 제공할 수 있게 되어, 물리적 하드웨어를 넘어 지속적인 수익을 창출하며 버스 좌석 시장을 확대되고 있습니다.
3D 프린팅된 티타늄 또는 알루미늄 브래킷을 사용하면 50석 규모의 버스에서 최대 350kg까지 무게를 줄일 수 있어, UNECE 충돌 안전 기준을 저해하지 않으면서도 전기차의 주행 거리를 연장할 수 있습니다. 프레임 공급업체는 적층 가공 기업과 협력하여 필요한 부분에만 강성을 확보하는 격자 구조를 채택함으로써 원자재 사용량과 탄소 발자국을 줄이고 있습니다. 내장재 제조업체는 향후 시행될 유럽의 미세 플라스틱 규정을 준수하기 위해 항균 코팅 및 재활용 가능한 섬유를 채택하고 있습니다.
지역별 분석
아시아태평양은 2025년 41.92%의 점유율로 버스 좌석 시장을 독점하고 있으며, 인도의 ‘스마트 시티 미션’, 중국의 지속적인 도시화, 그리고 동남아시아의 급속한 차량 전동화에 힘입어 견조한 연평균 성장률(CAGR)을 나타낼 전망입니다. 중국의 전기 버스 판매는 2017년 이후 둔화되고 있지만, 생산 거점은 여전히 매우 중요하며, 좌석 공급업체에 규모의 경제와 수출 우위를 가져다주고 있습니다. 일본의 통근자 조사에 따르면, 주민의 80% 이상이 버스를 이용하고 있으며, 그 대부분이 단거리 이동인 만큼 사업자들은 수송 능력 확대보다 쾌적성 향상에 주력하고 있습니다. 인도의 AIS-052부터 중국의 GB 규격에 이르기까지 다양한 규제 체계가 존재하기 때문에 여러 규격에 대응하는 인증 포트폴리오를 보유한 좌석 제조업체에게는 유리하게 작용하고 있습니다.
2025년에는 차량 교체와 제로 에미션 규제가 맞물려 유럽이 시장의 5분의 2 이상을 차지했습니다. 엄격한 UNECE R80 규격 및 난연성 관련 규제로 인해 시험 비용이 발생하여 저비용으로 시장에 신규 진입하는 것을 막는 한편, 기존 공급업체에게는 유리한 환경이 조성되고 있습니다. 정부의 보조금은 저탄소 기술을 대상으로 하며, 각 기관이 경량 프레임 및 재생 섬유의 사용을 지정하도록 장려하고 있습니다. 북미는 이에 근소한 차이로 뒤를 잇고 있으며, 미국의 ‘인프라 투자 및 고용법’과 캐나다의 ‘제로 배출 교통 기금’에 힘입고 있습니다. 전기 스쿨버스 도입으로 인해, 어린이 안전 좌석 시스템과 중량이 최적화된 프레임이 중시되는 좌석에 대한 안정적인 수요가 창출되고 있습니다.
아프리카는 라고스나 나이로비 등 도시들이 버스 고속 수송 시스템(BRT) 회랑에 투자하고 있어 연평균 성장률(CAGR) 7.18%로 성장하고 있지만, 예산 측면에서는 여전히 고급 기능보다 비용이 우선시되고 있습니다. 남아프리카공화국과 이집트의 현지 조립 프로그램은 표준화되고 조달하기 쉬운 좌석에 대한 수요를 창출하고 있습니다. 남미의 브라질은 견실한 섀시 산업을 보유하고 있어 지역적 조달 우위를 점하고 있습니다. 경제 변동으로 인해 사업자들은 가격에 민감하기 때문에 공급업체들은 UNECE 충돌 안전 기준을 충족하면서도 경쟁력 있는 가격으로 제공 가능한 내구성이 뛰어난 표준 좌석을 통해 입찰에서 승리하고 있습니다.
기타 혜택:
- 엑셀 형식 시장 예측(ME) 시트
- 3개월간의 애널리스트 지원
자주 묻는 질문
목차
제1장 서론
제2장 조사 방법
제3장 주요 요약
제4장 시장 구도
제5장 시장 규모와 성장 예측
제6장 경쟁 구도
제7장 시장 기회와 향후 전망
JHS 26.08.26According to Mordor Intelligence, the bus seat market size is expected to grow from USD 14.93 billion in 2025 to USD 15.74 billion in 2026 and is forecast to reach USD 20.49 billion by 2031 at 5.42% CAGR over 2026-2031.
This report is Segmented by Seat Type (Standard, Recliner and More), Component (Frame (Steel, Al, and Mg) and More), Bus Type (Transit /City and Others), Seating Capacity (Less Than or Equal To 40 Seats and More), End-Use (OEM Fitment and Aftermarket/Retro-fit), and Geography. The Market Forecasts are Provided in Terms of Value (USD).
Global Bus Seat Market Trends and Insights
Surge in E-Bus and Electric-School-Bus Procurements
Electric bus roll-outs are redefining weight budgets, prompting seat designs that trim every kilogram to protect battery range. Capacity segments vary: buses below 40 seats grow at a robust CAGR, while 41-70 seaters expand at 14.91% CAGR. Blue Bird reported that electric school buses now generate almost one tenth of revenue and command average transaction prices above USD 300,000, triple a diesel equivalent.
Rising Public-Transport CAPEX in Megacities
Urban congestion and air-quality targets push megacity planners toward higher CAPEX for bus fleets with premium interiors. Asia-Pacific remains the growth engine, with the regional bus seat market projected to post an 8.33% CAGR between 2025 and 2030, aided by China, India, and Southeast Asia. Authorities routinely specify USB charging, climate-control vents, and ergonomic cushions to retain riders. The 41-70 capacity range dominates because it balances throughput and maneuverability on congested streets. North American city-bus deliveries reached 4,349 units in 2023, a 7% year-over-year increase compared to 2022.
Steel and Polyurethane Price Volatility
Raw material price instability is compressing margins and forcing manufacturers to implement dynamic pricing strategies that strain long-term OEM contracts. Polyurethane price spikes ripple through the upholstery slice, pressing suppliers to hedge or substitute recycled and bio-based chemistries. Vertically integrated players insulate earnings by securing long-term contracts, while small firms face cash-flow stress that may hasten consolidation.
Other drivers and restraints analyzed in the detailed report include:
- Stricter Seat-Safety and Fire-Retardancy Mandates
- Comfort-Driven OEM Spec Upgrades
- High Tooling Costs for Low-Volume Variants
For complete list of drivers and restraints, kindly check the Table Of Contents.
Segment Analysis
Standard seats controlled 53.12% of the bus seat market 2025, anchored by cost-sensitive urban operators. Recliners held a decent share and are slated for an exponentially growth with a CAGR of 8.78%, transforming intercity and higher-end transit services. Folding seats cater to flexible shuttle operations, whereas driver/operator designs include suspension and adjustment features that raise unit value. Integrated child seats remain niche but gain regulatory tailwinds from UNECE rules. The premium shift lifts average selling prices and magnifies the bus seat market size for recliner offerings, particularly in corridors where airlines and ride-hailing compete for passengers. Suppliers investing in full-recline mechanisms and massage systems enjoy pricing power and closer alignment with OEM differentiation strategies.
The bus seat industry must comply with rising crash-worthiness tests, so recliner frames now blend high-strength steel and aluminum to meet UNECE R80 while staying within mass limits. OEMs promote layouts that mix standard and premium rows, letting agencies upsell comfort tiers without redesigning floor plans.
Frame assemblies accounted for 48.05% of 2025 revenue because every seat begins with a rigid structure, while smart accessories and sensors represent the fastest growth at an 11.08% CAGR through 2031. Automatic passenger-counting systems achieve more than 98% accuracy, letting agencies adjust headways for higher fare yield. Such data-rich functionality lets suppliers bundle analytics subscriptions, creating recurring revenue beyond physical hardware and expanding the bus seat market.
3D-printed titanium or aluminum brackets trim up to 350 kg from a 50-seat bus, extending electric range without compromising UNECE crash standards. Frame suppliers collaborate with additive-manufacturing firms to merge lattice structures that deliver stiffness only where necessary, curbing raw-material tonnage and carbon footprints. Upholstery makers add antimicrobial coatings and recyclable textiles to comply with forthcoming European micro-plastic rules.
Complete Report Scope:
- By Seat Type
- Standard
- Recliner
- Folding
- Driver/Operator
- Integrated Child
- By Component
- Frame (Steel, Al, and Mg)
- Upholstery (Fabric, Vinyl, and Leather)
- Accessories (Armrest, Seat-belt, Trim, and Sensors)
- By Bus Type
- Transit / City
- Coach / Intercity
- School
- Shuttle & Others
- By Seating Capacity
- Less than or equal to 40 Seats
- 41 to 70 Seats
- More than 70 Seats
- By End-Use
- OEM Fitment
- Aftermarket / Retro-fit
- By Geography
- North America
- United States
- Canada
- Rest of North America
- South America
- Brazil
- Argentina
- Rest of South America
- Europe
- Germany
- United Kingdom
- France
- Italy
- Spain
- Rest of Europe
- Asia-Pacific
- China
- India
- Japan
- South Korea
- Rest of Asia-Pacific
- Middle East and Africa
- Saudi Arabia
- United Arab Emirates
- Turkey
- South Africa
- Rest of Middle East and Africa
- North America
Geography Analysis
Asia-Pacific dominated the bus seat market with 41.92% share in 2025 and is set to log a decent CAGR, driven by India's Smart Cities Mission, continued Chinese urbanization, and Southeast Asia's rapid fleet electrification. Chinese e-bus sales have cooled since 2017, but the production base remains pivotal, giving seat suppliers scale and export leverage. Japan's commuter surveys show more than 80% of residents use buses, mostly on short trips, prompting operators to focus on comfort upgrades instead of capacity additions. Diverse regulatory frameworks-from India's AIS-052 to China's GB standards-reward seat makers with multi-standard certification portfolios.
Europe held more than two fifth of share in 2025, as fleet renewals converge with zero-emission mandates. Strict UNECE R80 and fire-retardancy rules impose test costs that hinder low-cost entrants, creating a premium climate for established suppliers. Government subsidies target low-carbon technology, encouraging agencies to specify lighter frames and recycled textiles. North America followed closely, lifted by the U.S. Infrastructure Investment and Jobs Act and Canada's Zero-Emission Transit Fund. Electric school bus allocations provide steady seat volumes that emphasize child-restraint systems and weight-optimized frames.
Africa grows at 7.18% CAGR as cities like Lagos and Nairobi invest in bus rapid transit corridors, although budgets still prioritize cost over premium features. Local assembly programs in South Africa and Egypt create demand for standardized, easily sourced seating. South America's Brazil has robust chassis industry offering regional sourcing advantages. Economic volatility keeps operators price-sensitive, so suppliers win tenders with durable standard seats that meet UNECE crash norms at competitive cost.
- Toyota Boshoku Corporation
- Grammer AG
- Commercial Vehicle Group Inc.
- Franz Kiel GmbH
- Freedman Seating Company
- Harita Seating Systems Ltd
- Magna International Inc.
- Lear Corporation
- NHK Spring Co.
- Pinnacle Industries Ltd
- RECARO Automotive
- Gentherm Inc.
- Adient PLC
- Faurecia SE (FORVIA)
- TACHI-S Co. Ltd
- Vogelsitze GmbH
- Isringhausen GmbH & Co. KG
- Bharat Seats Limited
- Minda Industries Ltd
- Prakash Seating Private Ltd
Additional Benefits:
- The market estimate (ME) sheet in Excel format
- 3 months of analyst support
TABLE OF CONTENTS
1 Introduction
- 1.1 Study Assumptions & Market Definition
- 1.2 Scope of the Study
2 Research Methodology
3 Executive Summary
4 Market Landscape
- 4.1 Market Overview
- 4.2 Market Drivers
- 4.2.1 Surge in e-bus and electric-school-bus procurements
- 4.2.2 Rising public-transport CAPEX in megacities
- 4.2.3 Stricter seat-safety and fire-retardancy mandates
- 4.2.4 Comfort-driven OEM spec upgrades (recliner, USB, HVAC)
- 4.2.5 AI-enabled occupancy monetisation for transit operators
- 4.2.6 3-D-printed lightweight metal frames cut curb weight
- 4.3 Market Restraints
- 4.3.1 Steel and polyurethane price volatility
- 4.3.2 High tooling costs for low-volume variants
- 4.3.3 UNECE R80 crash-compliance delays in emerging markets
- 4.3.4 Forthcoming micro-plastic emission rules on seat foams
- 4.4 Supply-Chain Analysis
- 4.5 Porter's Five Forces
- 4.5.1 Threat of New Entrants
- 4.5.2 Bargaining Power of Buyers
- 4.5.3 Bargaining Power of Suppliers
- 4.5.4 Threat of Substitutes
- 4.5.5 Competitive Rivalry
5 Market Size & Growth Forecasts (Value (USD))
- 5.1 By Seat Type
- 5.1.1 Standard
- 5.1.2 Recliner
- 5.1.3 Folding
- 5.1.4 Driver/Operator
- 5.1.5 Integrated Child
- 5.2 By Component
- 5.2.1 Frame (Steel, Al, and Mg)
- 5.2.2 Upholstery (Fabric, Vinyl, and Leather)
- 5.2.3 Accessories (Armrest, Seat-belt, Trim, and Sensors)
- 5.3 By Bus Type
- 5.3.1 Transit / City
- 5.3.2 Coach / Intercity
- 5.3.3 School
- 5.3.4 Shuttle & Others
- 5.4 By Seating Capacity
- 5.4.1 Less than or equal to 40 Seats
- 5.4.2 41 to 70 Seats
- 5.4.3 More than 70 Seats
- 5.5 By End-Use
- 5.5.1 OEM Fitment
- 5.5.2 Aftermarket / Retro-fit
- 5.6 By Geography
- 5.6.1 North America
- 5.6.1.1 United States
- 5.6.1.2 Canada
- 5.6.1.3 Rest of North America
- 5.6.2 South America
- 5.6.2.1 Brazil
- 5.6.2.2 Argentina
- 5.6.2.3 Rest of South America
- 5.6.3 Europe
- 5.6.3.1 Germany
- 5.6.3.2 United Kingdom
- 5.6.3.3 France
- 5.6.3.4 Italy
- 5.6.3.5 Spain
- 5.6.3.6 Rest of Europe
- 5.6.4 Asia-Pacific
- 5.6.4.1 China
- 5.6.4.2 India
- 5.6.4.3 Japan
- 5.6.4.4 South Korea
- 5.6.4.5 Rest of Asia-Pacific
- 5.6.5 Middle East and Africa
- 5.6.5.1 Saudi Arabia
- 5.6.5.2 United Arab Emirates
- 5.6.5.3 Turkey
- 5.6.5.4 South Africa
- 5.6.5.5 Rest of Middle East and Africa
- 5.6.1 North America
6 Competitive Landscape
- 6.1 Market Concentration
- 6.2 Strategic Moves
- 6.3 Market Share Analysis
- 6.4 Company Profiles (Includes Global Level Overview, Market Level Overview, Core Segments, Financials as Available, Strategic Information, Market Rank/Share for Key Companies, Products and Services, SWOT Analysis, and Recent Developments)
- 6.4.1 Toyota Boshoku Corporation
- 6.4.2 Grammer AG
- 6.4.3 Commercial Vehicle Group Inc.
- 6.4.4 Franz Kiel GmbH
- 6.4.5 Freedman Seating Company
- 6.4.6 Harita Seating Systems Ltd
- 6.4.7 Magna International Inc.
- 6.4.8 Lear Corporation
- 6.4.9 NHK Spring Co.
- 6.4.10 Pinnacle Industries Ltd
- 6.4.11 RECARO Automotive
- 6.4.12 Gentherm Inc.
- 6.4.13 Adient PLC
- 6.4.14 Faurecia SE (FORVIA)
- 6.4.15 TACHI-S Co. Ltd
- 6.4.16 Vogelsitze GmbH
- 6.4.17 Isringhausen GmbH & Co. KG
- 6.4.18 Bharat Seats Limited
- 6.4.19 Minda Industries Ltd
- 6.4.20 Prakash Seating Private Ltd
7 Market Opportunities & Future Outlook
- 7.1 Low-toxicity bio-based foam adoption
- 7.2 Subscription-based seat-maintenance services
- 7.3 Seat-embedded passenger-wellness sensors
- 7.4 Carbon-credit revenue from lightweighting
- 7.5 Refurbishment demand from ageing transit fleets