|
시장보고서
상품코드
2115168
Lighting As A Service(LaaS) 시장 : 점유율 분석, 업계 동향과 통계, 성장 예측(2026-2031년)Lighting As A Service (LaaS) - Market Share Analysis, Industry Trends & Statistics, Growth Forecasts (2026 - 2031) |
||||||
 Mordor Intelligence
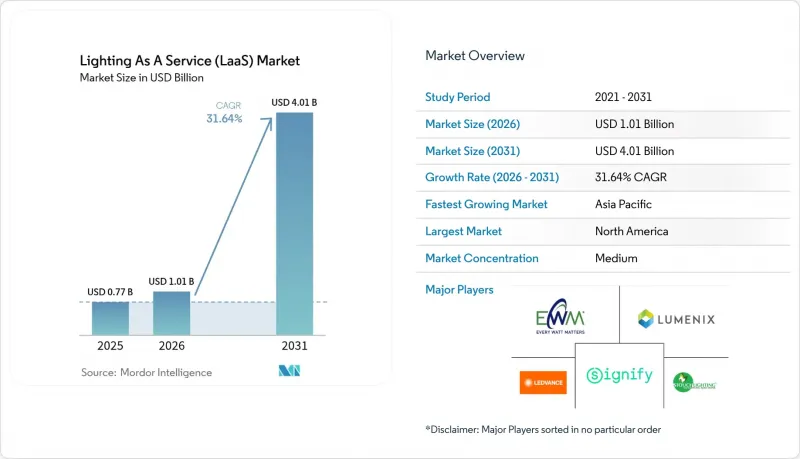
Mordor Intelligence에 의하면, 2026년 Lighting As A Service(LaaS) 시장 규모는 10억 1,000만 달러로 추정되고 있어 2025년 7억 7,000만 달러에서 성장하여 2031년에는 40억 1,000만 달러에 이를 것으로 예측됩니다.
2026년부터 2031년까지 연평균 성장률(CAGR) 31.64%로 성장할 것으로 전망됩니다.
본 보고서는 설치 유형(실내 및 실외), 구성 요소(조명 기구 및 제어 기기, 소프트웨어 및 분석, 서비스), 계약 유형(리모델링 프로젝트 및 신규 설치), 최종 사용자(상업, 지자체, 산업, 주택) 및 지역(북미, 유럽, 아시아태평양, 남미, 중동 및 아프리카)별로 분류되어 있습니다.
전 세계 Lighting As A Service(LaaS) 시장 동향 및 인사이트
정부의 에너지 효율화 의무화
2028년 7월 시행될 미국 에너지부의 ‘1와트당 120루멘’ 기준 등 새로운 규제로 인해 조명 기구의 광범위한 노후화가 초래되고 있으며, 막대한 초기 설비 투자를 피할 수 있는 규정 준수의 지름길로서 서비스 계약이 주목받고 있습니다. 캘리포니아주의 지방 유틸리티체는 2022년 에너지 절약 프로그램에 2억 2,300만 달러를 투자했으며, 연간 총 절감액의 34%를 조명이 차지하여 구매의 시급성을 여실히 보여주고 있습니다. 서비스 제공업체가 교체 및 규제 관련 위험을 부담함에 따라, 지자체와 기업은 규정 준수를 보장하면서 측정 가능한 탄소 감축 기준을 달성하는 성과 기반 계약으로 전환하고 있습니다.
LED 및 센서 비용 하락
LED 패키지 가격이 급락함에 따라 서비스 제공업체는 이익률을 유지하면서도 기존 유틸리티체보다 저렴한 가격으로 구독 서비스를 제공할 수 있게 되었습니다. 2024년에는 이미 LED 제품이 전 세계 출하량의 70%를 차지하고 있으며, 2030년까지 87%를 나타낼 것으로 예측됨에 따라 58억 개 램프에 해당하는 2차 교체 수요가 발생하여 지속적인 수익 전망이 개선되고 있습니다. 센서를 통한 조광 기능과 LED 고유의 효율성을 결합함으로써, 커넥티드 조명 기구는 에너지 소비를 최대 80%까지 절감하여 서비스의 가치 제안을 한층 더 높입니다.
총 계약 비용(TCC)과 자본 지출(Cap-Ex)을 통한 구매 비교
LED 조명 기구는 백열등에 비해 전력 소비가 75% 적고 수명도 25배 길지만, 일회성 구매와 비교하면월이용료가 부담스럽게 느껴질 수 있습니다. 특히 환율 변동의 영향을 받기 쉬워 서비스 요금이 상대적으로 비싸지는 경향이 있는 경제권에서는 풍부한 현금 유동성을 보유한 조직이 비용 절감 효과를 극대화하기 위해 자금을 투입하여 장비를 직접 구매하는 경우가 많습니다. 공급업체는 높은 가격에 대한 고객의 우려를 완화하기 위해 가동 시간 보장, 교체 주기 및 성능 보증을 강조해야 합니다.
부문 분석
2025년 기준, LaaS 시장의 69.92%를 실내 프로젝트가 차지하고 있으며, 이는 사무실, 물류 거점, 제조 시설에서의 활발한 수요를 반영합니다. 이러한 시설에서는 표준화된 천장 그리드 덕분에 설계상의 편차가 줄어들어 서비스 가격 책정이 간소화됩니다. 공급업체들은 예측 유지보수 및 향후 기술 업그레이드를 계약에 포함함으로써, 제어 프로토콜의 발전에 따라 고객이 ‘좌초 자산’을 떠안게 되는 상황을 방지하고 있습니다. 북미 및 EU 전역에서 에너지 규제가 강화됨에 따라 실내 환경에 대한 관심이 높아지는 한편, AI를 활용한 재실 상황 분석을 통해 평방피트당 새로운 수익 기회가 창출되고 있습니다. 실외 도입은 지자체의 스마트 스트리트 프로그램 덕분에 연평균 성장률(CAGR) 37.6%의 속도로 급속히 확대되고 있으며, 가로등 기둥에는 현재 카메라, 5G 스몰 셀, 환경 센서가 설치되어 있습니다. 워싱턴 D.C.의 3억 900만 달러 규모 양도 계약은 50%의 에너지 절감 효과와 데이터 서비스를 통한 수익 분배를 결합함으로써 그 경제성을 입증하고 있습니다. 이 사례는 마이애미-데이드 카운티의 2억 1,170만 달러 규모 다중 센서 도입 프로젝트에서도 그대로 적용되고 있습니다. 이러한 프로젝트들은 가로등 기둥이 디지털 도시 인프라로 진화하는 과정을 보여주고 있으며, ‘Lighting as a Service(조명 서비스)’ 시장에 종사하는 팀들에게 지자체와의 더 깊은 협력의 신호탄이 되고 있습니다.
실외 분야의 확대에 따라 각 벤더들은 15년간의 부채 상환 일정에 부합하도록 내후성이 뛰어난 하드웨어, 적응형 조광 알고리즘, 그리고 민관 협력(PPP)과 같은 자금 조달 구조의 개선을 추진하고 있습니다. 이 부문의 성장은 보안 분석, 주차 관리, 공기질 모니터링과 같은 부수적인 시장도 활성화시키고 있습니다. 더 많은 도시가 기존 조명 기구의 재입찰을 진행함에 따라, 설계·건설·자금 조달·유지보수를 종합적으로 제공하는 턴키형 패키지를 보유한 공급업체는 상업적 우위를 강화하고 있습니다. 실내 환경이 여전히 판매 수량의 주도권을 쥐고 있지만, 실외 솔루션의 노드당 수익성이 높고 공공 부문의 장기 계약 덕분에 LaaS 시장에서 주요 공급업체의 전체 포트폴리오 리스크는 균형을 이룰 전망입니다.
2025년 매출 중 하드웨어가 여전히 59.10%를 차지하고 있지만, 소프트웨어 및 분석 분야는 2031년까지 연평균 성장률(CAGR) 41.2%로 급속히 성장하고 있어, 데이터 인사이트가 ‘Lighting as a Service’ 업계의 새로운 경쟁 최전선으로 변모하고 있습니다. 에너지 대시보드, 예측 유지보수 알림 및 통합 API를 통해 조명 네트워크는 보다 광범위한 빌딩 관리 시스템에 통합되고 있습니다. 분석 기능과 연동된 ‘Lighting as a Service’ 시장 규모 확대로 인해 성과 기반 과금이 가능해졌으며, 공급업체는 조명 기구 단위의 엄격한 과금 대신 kW시 절감이나 생산성 향상을 수익화할 수 있게 되었습니다. AI를 활용한 최적화를 통해 멀티테넌트 오피스에서 LED를 통한 에너지 절약 효과에 더해 최대 26%의 추가적인 에너지 절감 효과를 실현하고 있습니다.
자산 금융, 예방 정비, 조명 기구 재활용을 아우르는 서비스 모듈은 계속해서 공급업체의 현금 흐름을 뒷받침하고 있습니다. 그러나 이익률 확대는 시간대, 점유 상황, 자연광 활용 정보를 바탕으로 조도 조정을 최적화하는 독자적인 알고리즘에서도 비롯됩니다. 오픈 프로토콜을 통한 상호 운용성을 유지하는 플랫폼은 타사 센서 및 HVAC 시스템과의 원활한 통합을 가능하게 함으로써 폐쇄형 생태계를 능가하고 있습니다. 이러한 차별화 추세로 인해 기존 제조업체들은 기존 고객 기반을 지키기 위해 소프트웨어 분야 인재에 대한 투자나 SaaS 전문 기업의 인수를 피할 수 없게 되었습니다. 고객은 수명 주기 비용의 투명성과 기능의 확장성을 통해 혜택을 받으며, 이를 통해 ‘Lighting as a Service’ 시장 내 고객 유지율이 강화되고 있습니다.
지역별 분석
북미는 2025년에 44.12%의 점유율을 차지했습니다. 이는 성숙한 민관 파트너십 체계와 투자 회수 기간을 단축하는 리베이트 제도에 힘입은 결과입니다. 워싱턴 D.C.의 3억 900만 달러 규모 가로등 현대화 사업은 지자체가 어떻게 50%의 에너지 절감을 달성하면서 동시에 감시 및 5G 백홀 용도로 전신주를 업그레이드하고 있는지를 보여줍니다. 2028년까지 와트당 120루멘을 의무화하는 연방 효율화 규제는 학교, 공항, 도로 개보수 작업에 시급성을 더하고 있습니다. 오스틴 에너지(Austin Energy)가 제공하는 1kW당 420달러의 크레딧과 같은 유틸리티자의 인센티브는 계약의 경제성을 더욱 향상시키고 있습니다.
아시아태평양은 고밀도 도시화와 정부 주도의 스마트 시티 예산에 힘입어 43.9%라는 가장 높은 연평균 성장률(CAGR)을 기록하고 있습니다. 인도의 ‘가로등 국가 프로그램’에서는 이미 2,950만 개의 조명 기구가 개조되어, 이를 통해 연간 3,930만 톤의 CO2 배출 감축으로 이어지고 있습니다. 중국에서는 21억 500만 필리핀 페소 규모의 ‘바콜로드 슈퍼시티’ 이니셔티브 등 여러 도시에서 디지털 트윈 실증 실험 및 프로젝트가 진행되고 있으며, 조명, 연결성, 전자 행정을 포함하는 대규모 ‘Lighting as a Service’ 시장에 대한 지역적 수요가 증가하고 있습니다.
유럽 시장은 엄격한 기후 변화 관련 법규와 노후화된 나트륨 증기등 네트워크를 배경으로 안정적인 교체 주기를 유지하고 있습니다. 코펜하겐에서는 1만 8,800기의 가로등을 LED로 교체하여 에너지 소비를 55% 절감하고, 연간 3,200톤의 CO2 배출을 줄이는 한편, 환경 센서 설치를 대비한 미래 지향적인 원격 모니터링 플랫폼을 도입했습니다. EU 지침이 데이터 보호에 중점을 두고 있기 때문에 공급업체 간의 경쟁은 주로 서비스 수준 준수 현황과 사이버 보안 실적을 바탕으로 이루어지고 있습니다. 중동 및 아프리카, 남미의 신흥 지역에서는 지역에 따라 편차가 있지만 관심이 높아지고 있으며, 다자간 금융 기관과 수출 신용 기관이 자금 조달 격차를 메움으로써 아직 초기 단계에 있는 ‘Lighting as a Service’ 시장의 확산을 위한 길을 밝히고 있습니다.
기타 혜택:
- 엑셀 형식 시장 예측(ME) 시트
- 3개월간의 애널리스트 지원
자주 묻는 질문
목차
제1장 서론
제2장 조사 방법
제3장 주요 요약
제4장 시장 구도
제5장 시장 규모와 성장 예측
제6장 경쟁 구도
제7장 시장 기회와 향후 전망
JHS 26.08.26According to Mordor Intelligence, lighting as a service market size in 2026 is estimated at USD 1.01 billion, growing from 2025 value of USD 0.77 billion with 2031 projections showing USD 4.01 billion, growing at 31.64% CAGR over 2026-2031.
This report is Segmented by Installation Type (Indoor and Outdoor), Component (Luminaires and Controls, Software and Analytics, and Services), Contract Type (Retrofit Projects and New Installations), End User (Commercial, Municipal, Industrial, and Residential), and Geography (North America, Europe, Asia-Pacific, South America, and Middle East and Africa).
Global Lighting As A Service (LaaS) Market Trends and Insights
Government Energy-Efficiency Mandates
New rules, such as the U.S. Department of Energy's 120 lumens-per-watt standard, effective July 2028, trigger widespread fixture obsolescence, positioning service contracts as a compliance shortcut that avoids heavy upfront cap-ex. Municipal utilities in California invested USD 223 million in 2022 efficiency programs, with lighting accounting for 34% of the gross annual savings, underscoring the urgency of purchasing. Because service providers assume replacement and regulatory risk, cities and corporates pivot toward outcome-based agreements that guarantee standards alignment while delivering measurable carbon-cutting baselines.
Declining LED & Sensor Costs
LED package prices have fallen sharply, enabling service providers to offer subscriptions at prices below those of incumbent utilities while maintaining their margins. With LED units already accounting for 70% of global shipments in 2024 and projected to reach 87% by 2030, a secondary replacement demand of 5.8 billion lamps emerges, boosting recurring revenue prospects. Connected luminaires reduce energy consumption by up to 80% when sensor-guided dimming is combined with native LED efficiency, enhancing the service value proposition.
High Total Contract Cost vs. Cap-Ex Purchase
Monthly fees can appear burdensome when compared with spot purchases, despite LEDs consuming 75% less power and lasting 25 times longer than incandescent fixtures. Organisations possessing strong cash reserves often decide to self-finance equipment to capture full savings, especially in economies prone to currency swings that inflate service premiums. Providers need to emphasize guaranteed uptime, refresh cycles, and performance warranties to offset sticker shock.
Other drivers and restraints analyzed in the detailed report include:
- Corporate Net-Zero & ESG Targets
- IoT-Enabled Smart-Building Retrofits
- Utility Rebate Uncertainty
For complete list of drivers and restraints, kindly check the Table Of Contents.
Segment Analysis
Indoor projects accounted for 69.92% of the Lighting as a Service market in 2025, reflecting abundant demand in offices, logistics hubs, and manufacturing facilities where standardized ceiling grids reduce engineering variance and simplify service pricing. Providers bundle predictive maintenance and future technology upgrades into contracts, ensuring clients avoid stranded assets as control protocols evolve. Energy code tightening across North America and the EU intensifies the focus on indoor environments, while AI-driven occupancy analytics unlock new revenue opportunities per square foot. Outdoor implementations are scaling quickly at a 37.6% CAGR thanks to municipal smart-street programs; poles now support cameras, 5G small cells, and environmental sensors. Washington D.C.'s USD 309 million concession validates the economics by pairing 50% energy savings with revenue-sharing from data services, an example that is being mirrored in Miami-Dade's USD 211.7 million multi-sensor rollout. These projects demonstrate how lighting poles evolve into digital urban infrastructure, signaling a deeper level of municipal engagement for Lighting as a Service market teams.
Outdoor's expansion prompts vendors to refine ruggedized hardware, adaptive dimming algorithms, and financial structures, such as public-private partnerships, that align with 15-year debt amortization schedules. The segment's growth also stimulates ancillary markets for security analytics, parking management, and air-quality monitoring. As more cities re-tender legacy fixtures, providers with turnkey design-build-finance-maintain packages gain commercial leverage. Indoor environments will remain volume leaders, but the higher per-node revenue and public-sector tenures of outdoor solutions will balance overall portfolio risk for top vendors within the Lighting as a Service market.
Hardware still accounts for 59.10% of 2025 revenue, yet software and analytics are racing ahead at a 41.2% CAGR through 2031, transforming data insights into the new competitive frontier for the Lighting as a Service industry. Energy dashboards, predictive failure alerts, and integration APIs embed lighting networks inside broader building-management stacks. The Lighting as a Service market size tied to analytics unlocks performance-based billing, allowing providers to monetize kilowatt-hour savings and productivity improvements rather than billing strictly per luminaire. AI-enabled optimisation now delivers up to 26% incremental energy cut on top of LED gains across multi-tenant offices.
Service modules covering asset financing, preventive maintenance, and luminaire recycling continue to underpin vendor cash flows. However, margin expansion also arises from proprietary algorithms that refine light-level tuning based on time-of-day, occupancy, and daylight harvesting inputs. Platforms that maintain open-protocol interoperability outpace closed ecosystems by facilitating seamless integration of third-party sensors and HVAC systems. The differentiation shift forces legacy manufacturers to invest in software talent or acquire SaaS-native firms to protect their installed bases. Customers benefit through lifecycle cost transparency and feature extensibility, reinforcing stickiness inside the Lighting as a Service market.
Complete Report Scope:
- By Installation Type
- Indoor
- Outdoor
- By Component
- Luminaires and Controls
- Software and Analytics
- Services (Maintenance, Financing)
- By Contract Type
- Retrofit Projects
- New Installations
- By End User
- Commercial
- Municipal
- Industrial
- Residential
- By Geography
- North America
- United States
- Canada
- Mexico
- Europe
- Germany
- United Kingdom
- France
- Italy
- NORDIC Countries
- Russia
- Rest of Europe
- Asia-Pacific
- China
- India
- Japan
- South Korea
- ASEAN Countries
- Rest of Asia-Pacific
- South America
- Brazil
- Argentina
- Rest of South America
- Middle East and Africa
- Saudi Arabia
- United Arab Emirates
- South Africa
- Egypt
- Rest of Middle East and Africa
- North America
Geography Analysis
North America held a 44.12% share in 2025, driven by mature public-private partnership frameworks and rebate portfolios that reduce payback horizons. Washington D.C.'s USD 309 million street-lighting overhaul illustrates how city governments achieve 50% energy cuts while upgrading poles for surveillance and 5G backhaul. Federal efficiency rules mandating 120 lumens per watt by 2028 inject urgency into school, airport, and roadway retrofits. Utility incentives such as Austin Energy's USD 420-per-kW credits further sweeten contract economics.
The Asia-Pacific region posts the fastest 43.9% CAGR, undergirded by high-density urbanization and state-engineered smart-city budgets. India's Street Lighting National Program already retrofitted 29.5 million fixtures, translating into 39.30 million tonnes of annual CO2 abatement. China's multi-city digital-twin demonstrations and projects, such as the PHP 2.105 billion Bacolod Super City initiative, amplify the regional appetite for large-scale Lighting as a Service market convergence, Including Lighting, connectivity, and e-governance.
Europe's market follows a stable replacement rhythm anchored to stringent climate legislation and aging sodium-vapor networks. Copenhagen switched 18,800 streetlights to LED, saving 55% of energy and eliminating 3,200 tons of CO2 each year, while installing a remote-monitoring platform that future-proofs the poles for environmental sensors. Providers compete primarily on service-level adherence and cybersecurity credentials, as EU directives focus on data protection. Emerging regions in the Middle East, Africa, and South America display uneven but rising interest, where multilateral lenders and export-credit agencies bridge financing gaps, lighting the way for nascent Lighting as a Service market penetration.
- Signify Holding
- GE Current, a Daintree company
- Acuity Brands
- Zumtobel Group
- Enlighted Inc (Siemens)
- LEDVANCE GmbH
- Ameresco Inc.
- Orion Energy Systems
- Lumenix
- Stouch Lighting
- LumenServe Inc.
- Lime Energy (now Willdan)
- RAB Lighting
- Revolution Lighting Technologies
- EnergyFocus Inc.
- Helvar Oy
- WattMan Lighting
- Every Watt Matters
- Lighthouse Technologies
- ESB Group (Energy Services)
Additional Benefits:
- The market estimate (ME) sheet in Excel format
- 3 months of analyst support
TABLE OF CONTENTS
1 Introduction
- 1.1 Study Assumptions & Market Definition
- 1.2 Scope of the Study
2 Research Methodology
3 Executive Summary
4 Market Landscape
- 4.1 Market Overview
- 4.2 Market Drivers
- 4.2.1 Government energy-efficiency mandates
- 4.2.2 Declining LED & sensor costs
- 4.2.3 Corporate net-zero & ESG targets
- 4.2.4 IoT-enabled smart-building retrofits
- 4.2.5 Green-bond financing for lighting OPEX models
- 4.2.6 AI-driven lighting-as-a-platform upsell potential
- 4.3 Market Restraints
- 4.3.1 High total contract cost vs. cap-ex purchase
- 4.3.2 Utility rebate uncertainty
- 4.3.3 Cyber-security concerns in connected luminaires
- 4.3.4 Limited LaaS awareness in mid-sized enterprises
- 4.4 Supply-Chain Analysis
- 4.5 Regulatory Landscape
- 4.6 Technological Outlook
- 4.7 Porter's Five Forces
- 4.7.1 Bargaining Power of Suppliers
- 4.7.2 Bargaining Power of Buyers
- 4.7.3 Threat of New Entrants
- 4.7.4 Threat of Substitutes
- 4.7.5 Intensity of Competitive Rivalry
5 Market Size & Growth Forecasts
- 5.1 By Installation Type
- 5.1.1 Indoor
- 5.1.2 Outdoor
- 5.2 By Component
- 5.2.1 Luminaires and Controls
- 5.2.2 Software and Analytics
- 5.2.3 Services (Maintenance, Financing)
- 5.3 By Contract Type
- 5.3.1 Retrofit Projects
- 5.3.2 New Installations
- 5.4 By End User
- 5.4.1 Commercial
- 5.4.2 Municipal
- 5.4.3 Industrial
- 5.4.4 Residential
- 5.5 By Geography
- 5.5.1 North America
- 5.5.1.1 United States
- 5.5.1.2 Canada
- 5.5.1.3 Mexico
- 5.5.2 Europe
- 5.5.2.1 Germany
- 5.5.2.2 United Kingdom
- 5.5.2.3 France
- 5.5.2.4 Italy
- 5.5.2.5 NORDIC Countries
- 5.5.2.6 Russia
- 5.5.2.7 Rest of Europe
- 5.5.3 Asia-Pacific
- 5.5.3.1 China
- 5.5.3.2 India
- 5.5.3.3 Japan
- 5.5.3.4 South Korea
- 5.5.3.5 ASEAN Countries
- 5.5.3.6 Rest of Asia-Pacific
- 5.5.4 South America
- 5.5.4.1 Brazil
- 5.5.4.2 Argentina
- 5.5.4.3 Rest of South America
- 5.5.5 Middle East and Africa
- 5.5.5.1 Saudi Arabia
- 5.5.5.2 United Arab Emirates
- 5.5.5.3 South Africa
- 5.5.5.4 Egypt
- 5.5.5.5 Rest of Middle East and Africa
- 5.5.1 North America
6 Competitive Landscape
- 6.1 Market Concentration
- 6.2 Strategic Moves (M&A, Partnerships, PPAs)
- 6.3 Market Share Analysis (Market Rank/Share for key companies)
- 6.4 Company Profiles (includes Global level Overview, Market level overview, Core Segments, Financials as available, Strategic Information, Products & Services, and Recent Developments)
- 6.4.1 Signify Holding
- 6.4.2 GE Current, a Daintree company
- 6.4.3 Acuity Brands
- 6.4.4 Zumtobel Group
- 6.4.5 Enlighted Inc (Siemens)
- 6.4.6 LEDVANCE GmbH
- 6.4.7 Ameresco Inc.
- 6.4.8 Orion Energy Systems
- 6.4.9 Lumenix
- 6.4.10 Stouch Lighting
- 6.4.11 LumenServe Inc.
- 6.4.12 Lime Energy (now Willdan)
- 6.4.13 RAB Lighting
- 6.4.14 Revolution Lighting Technologies
- 6.4.15 EnergyFocus Inc.
- 6.4.16 Helvar Oy
- 6.4.17 WattMan Lighting
- 6.4.18 Every Watt Matters
- 6.4.19 Lighthouse Technologies
- 6.4.20 ESB Group (Energy Services)
7 Market Opportunities & Future Outlook
- 7.1 White-Space & Unmet-Need Assessment