|
시장보고서
상품코드
2115181
평면형 고체 산화물 연료전지 시장 : 시장 점유율 분석, 업계 동향 및 통계, 성장 예측(2026-2031년)Planar Solid Oxide Fuel Cell - Market Share Analysis, Industry Trends & Statistics, Growth Forecasts (2026 - 2031) |
||||||
 Mordor Intelligence
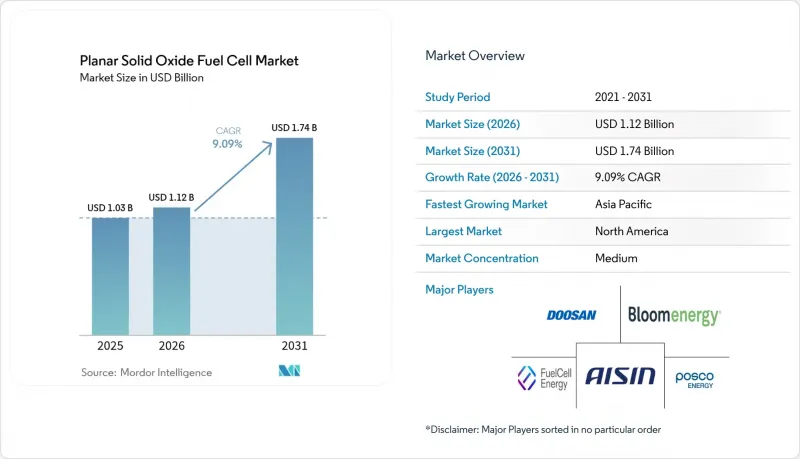
Mordor Intelligence에 의하면, 평면형 고체 산화물 연료전지 시장 규모는 2025년 10억 3,000만 달러로 평가되었고, 2026년에는 11억 2,000만 달러로 추정되고, 2026-2031년 CAGR 9.09%로 성장을 지속할 전망이며, 2031년까지 17억 4,000만 달러에 이를 것으로 예측됩니다.
본 보고서는 연료 유형별(천연가스/LNG, 수소, 기타), 전해질 소재별(이트리아 안정화 지르코니아, 갈레이트계 란탄, 기타), 출력별(5kW 이하, 1MW 이상, 기타), 용도별(고정형 발전, 백업 전원·주 전원, 기타), 최종 사용자별(상업 및 산업용, 데이터센터, 기타), 지역별(북미, 아시아태평양, 기타)로 분류되어 있습니다.
세계의 평면형 고체 산화물 연료전지 시장 동향 및 인사이트
정부의 탈탄소화 목표 및 수소 관련 우대 조치
세계 각국 정부는 기후 중립 목표와 평면형 고체 산화물 연료전지 시장에 직접적인 혜택을 가져다주는 파격적인 재정 조치를 결합하고 있습니다. 미국의 ‘인플레이션 억제법’에서는 청정 수소 생산에 대해 1kg당 최대 3달러의 세액 공제가 제공되며, 캐나다에서는 15-40%의 ‘청정 수소 투자 세액 공제’가 적용되고 있고, 독일은 23건의 IPCEI 수소 프로그램 프로젝트에 46억 유로를 투입하고 있습니다. 호주가 계획 중인 80억 호주 달러 규모의 수소 생산 장려책은 2027년에 시작될 예정이며, 영국의 ‘가스 시퍼 의무(Gas Shipper Obligation)’는 저탄소 수소와 화석 연료 간의 비용 격차를 줄이는 것을 목표로 하고 있습니다. 이러한 장려책은 신규 설비 도입에 대한 투자 회수 기간을 단축하고, 지역 공급망을 활성화하며, 유럽과 아시아에서의 대규모 제조 계획 추진을 가속화하고 있습니다. 재정 조치, 탄소 가격 책정, 인허가 제도 개혁이 조화를 이루면서, 현재 향후 10년 동안 평면형 고체 산화물 연료전지 시장을 견인할 자금 조달이 가능한 프로젝트 파이프라인이 형성되고 있습니다.
데이터센터·상업 및 산업(C&I) 시설의 내결함성 전원 수요
생성형 AI와 고성능 컴퓨팅의 폭발적인 성장으로 인해 전 세계 데이터센터 클러스터의 전력 소비량이 두 배로 증가함에 따라, 운영 사업자들은 대기용 디젤 발전에 대한 의존도를 재검토할 수밖에 없는 상황에 처해 있습니다. 평면형 고체 산화물 연료전지 시스템은 60%의 순발전 효율을 달성하며, 냉수 루프와 통합할 경우 시스템 총 효율이 90%를 넘기도 하여 하이퍼스케일 캠퍼스에 매우 적합한 솔루션입니다. 벨기에의 상업시설에서 최근 진행된 9.75MW 규모의 도입 사례와 캘리포니아주에서 계획 중인 20MW 규모의 도입 사례는 구매자들이 대규모 송전망 연결 업그레이드가 필요 없이 설치할 수 있는 모듈식 SOFC 어레이를 선호하고 있음을 보여줍니다. 상업 및 산업 시설에서 이 기술을 통해 기업은 가동 시간을 희생하지 않고도 정전 위험을 헤지하고, 폐열을 수익화하며, ESG 지표를 달성할 수 있게 됩니다. 이러한 추세에 따라 수 메가와트 규모의 수주가 촉진될 것이며, 데이터센터 사업자는 평면형 고체 산화물 연료전지 시장에서 가장 빠르게 성장하는 최종 사용자 중 하나로 자리매김할 것으로 예측됩니다.
기존 발전기에 비해 높은 초기 투자 비용
평면형 SOFC 시스템은 100kW에서 수 MW 범위에서 여전히 1kW당 5,000-1만 달러의 가격대에 있어, 디젤 발전기나 가스 터빈보다 훨씬 비쌉니다. 1-10kW의 소형 모델의 경우 1kW당 3만 달러에 달하는 경우도 있어, 이는 주택 부문에서의 도입을 가로막는 장벽이 되고 있습니다. 균등화 발전 원가(LCOE) 조사에 따르면, 수소를 연료로 하는 장치의 비용은 1kWh당 0.527파운드로, 천연가스 대비 3배에 달할 전망입니다. 이는 탄소 제로 운영에 있어 비용이 상대적으로 비싸다는 것을 의미합니다. 소매 전력 가격이 높고, 지원적인 고정가격매입제도가 정비된 지역에서는 경제성이 향상되지만, 세계적인 비용 경쟁력을 확보하기 위해서는 양산이 관건입니다. 업계 로드맵에 따르면, 연간 생산량이 수백 메가와트를 초과하면 스택 비용이 1kW당 500달러에서 100달러 이하로 떨어질 가능성이 있으며, 이 전환점에 도달하면 가격 차이는 대폭 축소될 것으로 예측됩니다.
부문 분석
2025년, 천연가스/LNG는 기존 가스 공급망과 이 구조에 통합된 수증기 개질 능력을 바탕으로 평면형 고체 산화물 연료전지 시장에서 64.45%의 점유율을 유지했습니다. 그러나 수소 프로젝트는 연평균 성장률(CAGR) 12.35%로 발전하고 있으며, 그린 수소의 비용 감소와 탄소 가격 상승에 따라 2027년 이후에는 가격 차이가 급격히 축소될 것으로 예측됩니다. 바이오가스와 합성가스의 통합은 매립지 및 농업 폐기물 흐름을 수익화함으로써 순환형 경제의 경제성을 강화하는 한편, 암모니아 및 e-연료 시범 프로젝트는 탄소 제로 대체 수단을 모색하는 중량 운송 틈새 시장에 기여하고 있습니다. 연료전지 모드와 전해 모드를 전환할 수 있는 가역형 SOFC 모듈을 통해 산업 시설은 수요가 낮은 시간대에 수소를 생산하고, 피크 요금 시간대에 전력을 공급함으로써 추가적인 수익원을 확보할 수 있습니다. 또한, 탄소 포집에 대응한 스택 설계는 넷제로(Net Zero)를 모색하는 정유시설 및 제철소의 목표 시장을 더욱 확대합니다.
수소의 보급은 2031년까지 평면형 고체 산화물 연료전지(SOFC) 시장 규모를 탄소 제로 용도로 계속 견인할 것으로 보입니다. 각국 정부가 전해조에 수천억 달러의 세액 공제를 할당함에 따라, 플랜트 개발업체들은 미래의 원자재 가격 변동에 대한 헤지 수단이 될 수 있는 듀얼 모드 SOFC/SOEC 라인을 선택하고 있습니다. 수소 호환성, 미래 연료에 대한 유연성, 스택 가격 하락이 결합되어 SOFC 어레이는 전 세계 산업 탈탄소화 전략의 핵심 솔루션으로서의 입지를 확고히 하고 있습니다.
이트륨 안정화 지르코니아(YSZ)는 700-800°C의 작동 범위 내에서 뛰어난 이온 전도성과 성숙한 공급 기반을 바탕으로 2025년 평면형 고체 산화물 연료전지 시장에서 66.80%의 점유율을 차지했습니다. 개발자들이 기계적 응력을 완화하고 플랜트 부대 설비(BoP) 비용을 절감할 수 있는 중온 옵션을 모색함에 따라, 갈레이트계 란탄(LSGM)은 연평균 성장률(CAGR) 10.21%로 시장을 확대되고 있습니다. 가돌리늄이 첨가된 세리아는 급속한 출력 상승률이 필요한 주택 및 소규모 상업용 유닛에 대한 틈새 수요를 충족시키고 있습니다.
3층 구조의 세리아-지르코니아-세리아(C-Z-C) 구성은 면적당 저항을 0.01Ωcm²까지 낮추고 650°C에서 1.2W/cm² 이상을 달성하는 한편,냉간 등방성 압축 성형(CIP)으로 제조된 2층 구조의 YSZ-GDC 구성은 같은 온도에서 1.251W/cm²에 달할 전망입니다. 나노웹 음극과 같은 계면 공학은 크롬에 의한 억제를 억제하고 산소 환원 반응 속도를 향상시키는 데 도움이 됩니다. 이러한 전해질 관련 혁신을 통해 예측 기간 동안 YSZ의 우위가 유지되는 동시에, LSGM 하이브리드가 휴대용 및 mCHP 부문에서 높은 성장률을 기록하며 시장 점유율을 확보할 수 있을 것으로 예측됩니다.
지역별 분석
아시아태평양은 중국의 수소 연료전지 시장이 2019년 16억 3,000만 위안에서 2023년 39억 3,000만 위안으로 급성장함에 따라, 2025년 출하 대수 점유율 47.10%를 유지했습니다. 2024년 지출액은 59억 9,000만 위안으로 예측됩니다. 일본과 한국은 SOEC 및 SOFC 양쪽 플랫폼에 대한 투자를 계속하고 있습니다. 한국이 개발한 하루 5.7kg의 수소(H2)를 생산하는 8kW 전해조 스택은 해당 국가에서 지금까지 최대 규모입니다. 이 지역의 탄탄한 부품 공급망과 적극적인 수소 로드맵 덕분에 평면형 고체 산화물 연료전지 시장 솔루션에 대한 안정적인 수요가 확보되고 있습니다.
북미는 연평균 성장률(CAGR) 10.53%를 기록하며 가장 빠르게 성장하는 지역입니다. ‘인플레이션 억제법’에 따른 생산 세액 공제에 더해, 미국 에너지부(DOE)의 연구 보조금 및 데이터센터 확장이 맞물려 수 메가와트 규모의 연료전지 단지에 대한 수주를 뒷받침하고 있습니다. 캐나다의 15-40%에 달하는 ‘청정 수소 투자 세액 공제’와 15억 캐나다 달러 규모의 ‘청정 연료 기금’도 북미 전체의 성장세를 더욱 강화하고 있습니다. 주거 부문에서의 도입도 진행 중이며, 웨스트버지니아주의 ‘WATT HOME’ 프로그램이 대표적인 사례입니다.
유럽의 전략은 중공업과 CCUS(이산화탄소 포집·활용·저장)의 연계에 중점을 두고 있습니다. 독일의 10GW 전해수소 생산 목표와 46억 유로의 IPCEI 지출, 영국의 ‘가스 시퍼 의무(Gas Shipper Obligation)’, Topsoe가 EU의 자금 지원을 받아 건설하는 9,400만 유로 규모의 SOEC 기가팩토리가 해당 지역공급 측면 생산 능력을 확고히 하고 있습니다. 벨기에의 9.75MW SOFC 도입은 북유럽에서의 상업적 실현 가능성을 보여주고 있으며, 한편 EU 시장 전체에서는 가동 중인 CCUS 사이트 41곳과 개발 중인 프로젝트 392건이 이점을 제공하고 있어, 탄소 포집에 대응하는 SOFC 하이브리드 발전소와의 연계가 용이해지고 있습니다.
기타 혜택
- 엑셀 형식 시장 예측(ME) 시트
- 3개월간의 애널리스트 지원
자주 묻는 질문
목차
제1장 서론
제2장 조사 방법
제3장 주요 요약
제4장 시장 구도
제5장 시장 규모 및 성장 예측
제6장 경쟁 구도
제7장 시장 기회 및 향후 전망
AJY 26.08.28According to Mordor Intelligence, the planar solid oxide fuel cell market size is expected to grow from USD 1.03 billion in 2025 to USD 1.12 billion in 2026 and is forecast to reach USD 1.74 billion by 2031 at 9.09% CAGR over 2026-2031.
This report is Segmented by Fuel Type (Natural Gas/LNG, Hydrogen, and More), Electrolyte Material (Yttria-Stabilised Zirconia, Lanthanum Gallate-Based, and More), Power Output (Up To 5 KW, Above 1 MW, and More), Application (Stationary Power, Backup and Prime Power, and More), End-User (Commercial and Industrial, Data Centres, and More), and Geography (North America, Asia-Pacific, and More).
Global Planar Solid Oxide Fuel Cell Market Trends and Insights
Government decarbonization targets & hydrogen incentives
Governments worldwide are pairing climate-neutrality goals with generous fiscal measures that directly benefit the planar solid oxide fuel cell market. The U.S. Inflation Reduction Act offers up to USD 3 per kg in clean-hydrogen production tax credits, Canada applies a 15-40% Clean Hydrogen Investment Tax Credit, and Germany is channeling EUR 4.6 billion into 23 IPCEI Hydrogen Programme projects. Australia's planned AUD 8 billion hydrogen-production incentive begins in 2027, and the UK's Gas Shipper Obligation is designed to narrow the cost gap between low-carbon hydrogen and fossil fuels.These incentives cut payback periods for new installations, stimulate local supply chains, and accelerate large-scale manufacturing commitments in Europe and Asia. The alignment of fiscal tools, carbon pricing, and permitting reforms is now translating into bankable project pipelines that will propel the planar solid oxide fuel cell market over the next decade.
Demand for resilient power in data centres & C&I sites
Explosive growth in generative AI and high-performance computing is doubling the electricity consumption of global data-center clusters, forcing operators to rethink their reliance on standby diesel. Planar solid oxide fuel cell systems achieve 60% net electrical efficiency and can exceed 90% total system efficiency when integrated with chilled-water loops, making them a compelling fit for hyperscale campuses. Recent 9.75 MW installations across Belgian commercial estates and pending 20 MW deployments in California show buyers favoring modular SOFC arrays that can be sited without extensive grid-interconnection upgrades. In commercial and industrial estates, the same technology enables firms to hedge outage risk, monetize waste heat, and meet ESG metrics without sacrificing uptime. The trend is expected to drive multi-megawatt orders and keep data-center operators among the fastest-growing end-users of the planar solid oxide fuel cell market.
High upfront capital cost vs. conventional generators
Planar SOFC systems still command USD 5,000-10,000 kW-1 in the 100 kW to multi-MW range, well above diesel or gas turbines. Small 1-10 kW models can reach USD 30,000 kW-1, a hurdle that suppresses residential adoption. Levelized-cost studies show hydrogen-fueled units at GBP 0.527 kWh-1, triple the natural-gas equivalent, underscoring the premium for zero-carbon operation. Economics improve in regions with high retail electricity prices and supportive feed-in tariffs, but global parity hinges on mass production. Industry roadmaps indicate that stack costs could decrease from USD 500 kW-1 to under USD 100 kW-1 when volumes exceed several hundred megawatts annually, a tipping point that would significantly reduce the price gap.
Other drivers and restraints analyzed in the detailed report include:
- Advances in planar SOFC manufacturing lower system CAPEX
- High electrical efficiency & multi-fuel flexibility
- Thermal durability & long-term degradation issues
For complete list of drivers and restraints, kindly check the Table Of Contents.
Segment Analysis
Natural gas/LNG retained 64.45% of the planar solid oxide fuel cell market share in 2025, buttressed by existing gas grids and the architecture's built-in steam reforming capacity. Hydrogen projects, however, are advancing at a 12.35% CAGR and are expected to narrow the gap sharply after 2027 as green-hydrogen costs fall and carbon pricing widens. Biogas-syngas integrations bolster circular-economy economics by monetizing landfill or agricultural waste streams, while ammonia and e-fuel pilots serve heavy-transport niches seeking zero-carbon alternatives. Reversible SOFC modules that switch between fuel-cell and electrolysis modes enable industrial sites to generate hydrogen during low-demand periods and export power at peak tariff hours, unlocking additional revenue. Carbon-capture-compatible stack designs further expand the addressable market among refineries and steel mills pursuing net-zero pathways.
Hydrogen's advance will continue to pull the planar solid oxide fuel cell market size toward zero-carbon applications through 2031. With governments earmarking tens of billions of dollars for electrolyzer tax credits, plant developers are opting for dual-mode SOFC/SOEC lines that hedge against future commodity price fluctuations. The combination of hydrogen readiness, future fuel flexibility, and falling stack prices positions SOFC arrays as a central solution for industrial decarbonization strategies worldwide.
Yttria-stabilized zirconia (YSZ) commanded a 66.80% share of the planar solid oxide fuel cell market in 2025, due to its robust ionic conductivity within the 700-800 °C operating window and a mature supply base. Lanthanum gallate (LSGM) is expanding at a 10.21% CAGR as developers seek intermediate-temperature options that alleviate mechanical stress and reduce balance-of-plant costs. Gadolinium-doped ceria meets the niche demand for residential and light-commercial units that require quick ramp rates.
Tri-layer ceria-zirconia-ceria builds boost area-specific resistance to just 0.01 Ω cm2, achieving over 1.2 W cm-2 at 650 °C, while bilayer YSZ-GDC configurations produced via cold-isostatic pressing reach 1.251 W cm-2 at the same temperature. Interface engineering, such as nano-web cathodes, helps curb chromium poisoning and enhances oxygen-reduction kinetics. These electrolyte innovations should preserve YSZ's lead over the forecast horizon while allowing LSGM hybrids to capture a high-growth share in the portable and mCHP segments.
Complete Report Scope:
- By Fuel Type
- Natural Gas/LNG
- Hydrogen
- Biogas/Syngas
- Ammonia and e-Fuels
- By Electrolyte Material
- Yttria-stabilised Zirconia (YSZ)
- Gadolinium-doped Ceria (GDC/CGO)
- Lanthanum Gallate-based (LSGM)
- Others (ScSZ, Composite)
- By Power Output
- Up to 5 kW
- 6 to 50 kW
- 51 to 250 kW
- 251 kW to 1 MW
- Above 1 MW
- By Application
- Stationary Power
- Combined Heat and Power (mCHP)
- Backup and Prime Power (Data Centres, Telecom)
- Auxiliary and Off-grid Units
- By End-User
- Commercial and Industrial
- Utilities and IPPs
- Data Centres
- Military and Defense
- Manufacturing
- Others (Residential, Education, Healthcare)
- By Geography
- North America
- United States
- Canada
- Mexico
- Europe
- Germany
- United Kingdom
- France
- Italy
- NORDIC Countries
- Russia
- Rest of Europe
- Asia-Pacific
- China
- India
- Japan
- South Korea
- ASEAN Countries
- Rest of Asia-Pacific
- South America
- Brazil
- Argentina
- Rest of South America
- Middle East and Africa
- Saudi Arabia
- United Arab Emirates
- South Africa
- Egypt
- Rest of Middle East and Africa
- North America
Geography Analysis
Asia-Pacific retained a 47.10% share of 2025 shipments on the back of China's hydrogen-fuel-cell market jump from CNY 1.63 billion in 2019 to CNY 3.93 billion in 2023, with 2024 spend forecast at CNY 5.99 billion. Japan and South Korea continue to invest in both SOEC and SOFC platforms. Korea's 8 kW electrolyzer stack, which produces 5.7 kg of H2 per day, is the country's largest to date. The region's deep component supply chains and aggressive hydrogen road-maps ensure steady demand for planar solid oxide fuel cell market solutions.
North America is the fastest-growing territory at a 10.53% CAGR. The Inflation Reduction Act's production credits, combined with DOE research grants and the expanding data center footprint, are propelling orders for multi-megawatt fuel cell parks. Canada's 15-40% Clean Hydrogen Investment Tax Credit and a CAD 1.5 billion Clean Fuels Fund reinforce continental momentum. Residential adoption is also advancing, highlighted by the WATT HOME program in West Virginia.
Europe's strategy centers on pairing heavy industry with CCUS. Germany's 10 GW electrolysis target and EUR 4.6 billion IPCEI outlays, the UK's Gas Shipper Obligation, and Topsoe's EUR 94 million EU-funded SOEC gigafactory cement the region's supply-side capacity. Belgium's 9.75 MW SOFC deployment signals commercial viability in northern Europe, while broader EU markets benefit from 41 operational CCUS sites and 392 projects in development, providing a ready tie-in for carbon-capture-compatible SOFC hybrid plants.
- Bloom Energy Corp.
- Mitsubishi Power (MHI)
- Aisin Corporation
- Ceres Power Holdings
- Doosan Fuel Cell Co., Ltd.
- FuelCell Energy Inc.
- Bosch (Robert Bosch GmbH)
- SOLIDpower S.p.A.
- Sunfire GmbH
- POSCO Energy
- Kyocera Corporation
- Fuji Electric Co., Ltd.
- Convion Ltd.
- Watt Fuel Cell Corp.
- Elcogen AS
- NGK Spark Plug (Niterra)
- AVL List GmbH
- Atrex Energy
- Adelan Ltd.
- Blue World Technologies
- Ceramic Fuel Cells Ltd.
Additional Benefits:
- The market estimate (ME) sheet in Excel format
- 3 months of analyst support
TABLE OF CONTENTS
1 Introduction
- 1.1 Study Assumptions & Market Definition
- 1.2 Scope of the Study
2 Research Methodology
3 Executive Summary
4 Market Landscape
- 4.1 Market Overview
- 4.2 Market Drivers
- 4.2.1 Government decarbonization targets & hydrogen incentives
- 4.2.2 Demand for resilient power in data?centres & C&I sites
- 4.2.3 Advances in planar SOFC manufacturing lower system CAPEX
- 4.2.4 High electrical efficiency & multi-fuel flexibility
- 4.2.5 Reversible planar SOFCs for on-site green-H? production
- 4.2.6 CCUS-ready planar SOFC hybrid pilots boost utility uptake
- 4.3 Market Restraints
- 4.3.1 High upfront capital cost vs. conventional generators
- 4.3.2 Thermal durability & long-term degradation issues
- 4.3.3 Rival PEMFC & battery solutions in low-power range
- 4.3.4 Nickel price volatility impacting anode supply chain
- 4.4 Supply-Chain Analysis
- 4.5 Regulatory Landscape
- 4.6 Technological Outlook (materials, stack designs)
- 4.7 Porter's Five Forces
- 4.7.1 Bargaining Power of Suppliers
- 4.7.2 Bargaining Power of Buyers
- 4.7.3 Threat of New Entrants
- 4.7.4 Threat of Substitutes
- 4.7.5 Intensity of Competitive Rivalry
5 Market Size & Growth Forecasts
- 5.1 By Fuel Type
- 5.1.1 Natural Gas/LNG
- 5.1.2 Hydrogen
- 5.1.3 Biogas/Syngas
- 5.1.4 Ammonia and e-Fuels
- 5.2 By Electrolyte Material
- 5.2.1 Yttria-stabilised Zirconia (YSZ)
- 5.2.2 Gadolinium-doped Ceria (GDC/CGO)
- 5.2.3 Lanthanum Gallate-based (LSGM)
- 5.2.4 Others (ScSZ, Composite)
- 5.3 By Power Output
- 5.3.1 Up to 5 kW
- 5.3.2 6 to 50 kW
- 5.3.3 51 to 250 kW
- 5.3.4 251 kW to 1 MW
- 5.3.5 Above 1 MW
- 5.4 By Application
- 5.4.1 Stationary Power
- 5.4.2 Combined Heat and Power (mCHP)
- 5.4.3 Backup and Prime Power (Data Centres, Telecom)
- 5.4.4 Auxiliary and Off-grid Units
- 5.5 By End-User
- 5.5.1 Commercial and Industrial
- 5.5.2 Utilities and IPPs
- 5.5.3 Data Centres
- 5.5.4 Military and Defense
- 5.5.5 Manufacturing
- 5.5.6 Others (Residential, Education, Healthcare)
- 5.6 By Geography
- 5.6.1 North America
- 5.6.1.1 United States
- 5.6.1.2 Canada
- 5.6.1.3 Mexico
- 5.6.2 Europe
- 5.6.2.1 Germany
- 5.6.2.2 United Kingdom
- 5.6.2.3 France
- 5.6.2.4 Italy
- 5.6.2.5 NORDIC Countries
- 5.6.2.6 Russia
- 5.6.2.7 Rest of Europe
- 5.6.3 Asia-Pacific
- 5.6.3.1 China
- 5.6.3.2 India
- 5.6.3.3 Japan
- 5.6.3.4 South Korea
- 5.6.3.5 ASEAN Countries
- 5.6.3.6 Rest of Asia-Pacific
- 5.6.4 South America
- 5.6.4.1 Brazil
- 5.6.4.2 Argentina
- 5.6.4.3 Rest of South America
- 5.6.5 Middle East and Africa
- 5.6.5.1 Saudi Arabia
- 5.6.5.2 United Arab Emirates
- 5.6.5.3 South Africa
- 5.6.5.4 Egypt
- 5.6.5.5 Rest of Middle East and Africa
- 5.6.1 North America
6 Competitive Landscape
- 6.1 Market Concentration
- 6.2 Strategic Moves (M&A, Partnerships, PPAs)
- 6.3 Market Share Analysis (Market Rank/Share for key companies)
- 6.4 Company Profiles (includes Global level Overview, Market level overview, Core Segments, Financials as available, Strategic Information, Products & Services, and Recent Developments)
- 6.4.1 Bloom Energy Corp.
- 6.4.2 Mitsubishi Power (MHI)
- 6.4.3 Aisin Corporation
- 6.4.4 Ceres Power Holdings
- 6.4.5 Doosan Fuel Cell Co., Ltd.
- 6.4.6 FuelCell Energy Inc.
- 6.4.7 Bosch (Robert Bosch GmbH)
- 6.4.8 SOLIDpower S.p.A.
- 6.4.9 Sunfire GmbH
- 6.4.10 POSCO Energy
- 6.4.11 Kyocera Corporation
- 6.4.12 Fuji Electric Co., Ltd.
- 6.4.13 Convion Ltd.
- 6.4.14 Watt Fuel Cell Corp.
- 6.4.15 Elcogen AS
- 6.4.16 NGK Spark Plug (Niterra)
- 6.4.17 AVL List GmbH
- 6.4.18 Atrex Energy
- 6.4.19 Adelan Ltd.
- 6.4.20 Blue World Technologies
- 6.4.21 Ceramic Fuel Cells Ltd.
7 Market Opportunities & Future Outlook
- 7.1 White-space & Unmet-need Assessment