

|
시장보고서
상품코드
2115212
남아프리카의 재생에너지 시장 : 점유율 분석, 업계 동향과 통계, 성장 예측(2026-2031년)Southern Africa Renewable Energy - Market Share Analysis, Industry Trends & Statistics, Growth Forecasts (2026 - 2031) |
||||||
 Mordor Intelligence
Mordor Intelligence에 의하면, 남아프리카 재생에너지 시장 규모는 2025년에 37.21기가와트라고 평가되어 2026년 42.84기가와트에서 2031년까지 86.63기가와트에 이를 것으로 예측되며, 예측 기간(2026-2031년) CAGR은 15.12%를 나타낼 전망입니다.
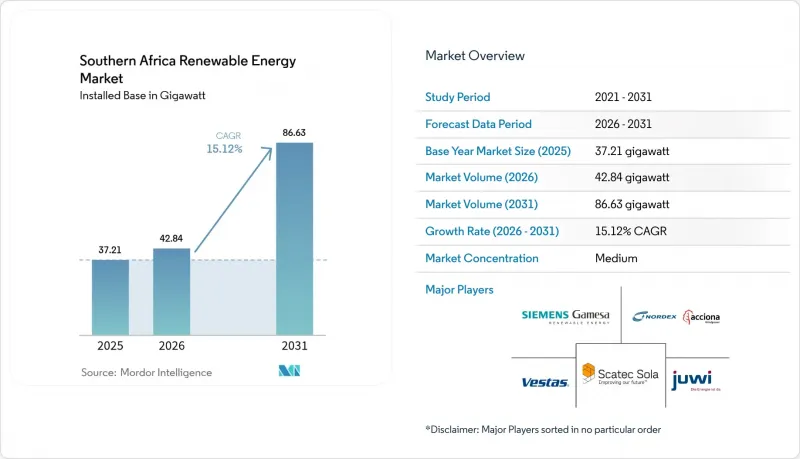
본 보고서는 기술별(태양광 발전, 풍력 발전, 수력 발전, 바이오에너지, 지열 발전, 해양 에너지), 최종 사용자별(유틸리티, 상업 및 산업, 주택),지역별(남아프리카, 앙골라, 잠비아, 콩고민주공화국, 탄자니아, 모잠비크 및 기타 남아프리카 국가들)로 분류되어 있습니다. 시장 규모 및 전망은 설치 용량(GW) 단위로 표시되어 있습니다.
남아프리카 재생에너지 시장 동향 및 인사이트
태양광 및 풍력 발전의 LCOE 하락
아시아 제조업체들의 모듈 공급 과잉으로 인해, 2024년 말까지 노던케이프주(Northern Cape)의 유틸리티 규모 태양광 발전 입찰 단가는 1kWh당 0.03달러 미만으로 떨어졌으며, 에스콤(Eskom)의 평균 발전 비용인 1kWh당 1.48랜드보다 훨씬 낮아졌습니다. 진코솔라(JinkoSolar)와 퍼스트솔라(First Solar)는 입찰 기간 7의 프로젝트에 대해 2022년 벤치마크 가격보다 22% 낮은 가격으로 공급하여, 1kWh당 0.50 랜드 미만의 20년 전력구매계약(PPA)을 성사시켰습니다. 동케이프주의 육상 풍력 발전 LCOE는 kWh당 0.04달러에 근접했으나, 물류 병목 현상과 송전망 구축 지연으로 인해 풍력 발전 입찰 가격이 태양광 발전보다 18% 높게 책정되었고, 그 결과 제7차 입찰에서는 풍력 발전에 대한 할당량이 제로가 되었습니다. 나미비아의 ‘하이픈(Hyphen)’ 프로젝트는 7GW 규모의 포트폴리오에 대해 kWh당 0.025달러의 재생에너지 혼합 요금을 확보하여 지역 최저 가격 수준을 확립하는 동시에 향후 가격 인하 가능성을 시사했습니다. 4시간 용량의 축전지를 태양광 발전과 결합함으로써, 현재 1kWh당 약 0.06달러의 조절 가능한 발전 용량을 제공할 수 있게 되어, 석탄 화력 피크 발전소의 경제성을 저해하는 동시에 에스콤(Eskom)의 ‘공정한 전환’ 일정을 뒷받침하고 있습니다.
에스콤(Eskom)의 요금 급등 및 전력 제한 위험
NERSA의 36% 요금 인상으로 인해 2025/26 회계연도의 산업용 전력 평균 비용은 kWh당 2.20랜드를 초과하게 되며, 500kW를 초과하는 옥상 태양광 발전 시스템의 투자 회수 기간은 4년 미만으로 단축됩니다. 2024년에는 6단계 계획 정전이 78일간 지속되었으며, 주요 광업 기업들은 200MW를 초과하는 자가 소비형 태양광 발전 및 에너지 저장 시스템 도입 계약을 체결했습니다. ‘전력 규제 개정법’에 따라 민간 주도의 송전 투자 및 전력 수송이 허용됨에 따라, 하우텡 주의 기업 구매자들은 에스콤을 중개자로 삼을 필요 없이 노던케이프 주의 재생에너지를 조달할 수 있게 되었습니다. 이러한 개혁으로 인해 2030년까지 에스콤의 발전 점유율은 60% 미만으로 떨어질 것이며, 이 회사는 순수한 송전망 운영자로서의 역할로 전환될 것으로 예측됩니다. 다자간 금융기관들은 우대 대출을 송전망의 조기 구축과 연계하고, 향후 대출 실행을 ‘미공급 전력’의 측정 가능한 감축과 연계하고 있습니다.
케이프-나미비아 회랑의 송전 병목 현상
노던케이프 주의 송전선 가동률은 92%에 달하며, 이로 인해 연간 180기가와트시(GWh)의 발전이 억제되고 송전망 연결이 최대 18개월 지연되고 있습니다. 에스콤(ESCOM)은 자금 조달 제약으로 인해 45억 랜드를 투자하는 ‘아리에스 크로노스’ 개보수 계획을 연기함에 따라, 이미 낙찰된 1.2 GW 규모의 프로젝트가 실행 불가능한 상태에 빠졌습니다. 남파워(NamPower)의 코켈부움-게르스(Kokerboom-Gels) 송전선로는 추가 공급량을 800 MW밖에 흡수할 수 없지만, 하이펜(Hyphen)사만 해도 2.5GW의 송전 용량이 필요합니다. 민간 부문의 관심은 있지만, 비용 회수나 송전 요금 전가 문제에 대해서는 여전히 불투명하기 때문에 최초의 독립형 송전 프로젝트의 파이낸셜 클로즈가 정체되어 있습니다. 각 개발사는 발전 출력을 비피크 시간대의 송전 시간대로 전환하기 위해 축전지를 병설하고 있으며, 이로 인해 설비 투자(CAPEX)가 kW당 150-200달러 증가하여 자기자본이익률이 최대 2퍼센트 포인트 하락하고 있습니다.
부문별 분석
수력 발전은 남아프리카의 재생에너지 시장을 독점하고 있으며, 2025년에는 61.25%의 점유율을 차지할 것으로 전망됩니다. 이는 잠비아의 칼리바 발전소나 콩고 민주 공화국의 잉가 발전소 복합 시설과 같은 기존 자산이 계속해서 대량의 전력을 공급하고 있기 때문입니다. 풍력 발전 용량은 향후 예정된 REIPPPP의 카브아웃(carve-out) 및 기업 간 전력 구매 계약(PPA) 확대에 힘입어 2031년까지 연평균 성장률(CAGR) 24.35%를 나타낼 것으로 예측되며, 이는 모든 기술 중 가장 높은 성장률입니다. 태양광 발전(태양광 발전 및 집광형 태양열 발전 포함)은 2025년에 발전 용량의 28.60%를 차지했습니다. ACWA Power사의 420MW 레드스톤 발전소(12시간 용융염 축열 시스템 장착)는 태양광 발전의 조절 가능한 잠재력을 입증했습니다. 이러한 특성은 저녁 시간대의 피크 수요에 대응할 수 있다는 점에서 전력 회사들로부터 높은 평가를 받고 있습니다. 바이오에너지는 여전히 틈새 시장에 머물러 있으며, 발전 용량의 2% 미만을 차지할 뿐입니다. 그 대부분은 남아프리카의 사탕수수 재배 지역에 집중되어 있으며, 현지 제당 공장에서는 사탕수수 찌꺼기(바가스)를 이용해 열병합 발전으로 전력을 생산하고 있습니다. 지열 및 해양 에너지는 여전히 탐색 단계에 있습니다. 탄자니아의 리프트 밸리 지역에는 최대 5GW의 잠재력이 있지만, 우물당 500만 달러에 가까운 시추 비용으로 인해 단기 전망은 어두운 상황입니다.
개발업체들은 에스콤(Eskom)의 잉갈라 및 드라켄스버그 각 부지에서 진행 중인 양수 발전 프로젝트가 자본 비용이 1kW당 2,000달러를 초과함에도 불구하고, 2030년까지 계통 균형 조정에 1.4GW를 기여할 것으로 전망하고 있습니다. 앙골라와 모잠비크에서는 기부금 자금을 통한 10MW 미만의 소규모 수력 발전 프로젝트가 급증하고 있으며, 2030년까지 300MW에 도달하는 것을 목표로 하고 있습니다. 풍력 발전의 확대는 포트 엘리자베스의 물류 솔루션과 환경 허가 절차의 신속화에 달려 있습니다. 태양광·풍력·전력 저장을 결합한 하이브리드 발전소는 수익원을 다각화할 수 있어 계약을 수주할 것으로 예측됩니다. 아르고아 만의 해양 에너지 시범 프로그램은 현재로서는 상용화 준비 단계에 이르지 못했으며, 향후 10년 동안 대폭적인 확장은 기대하기 어렵습니다. 전반적으로 기술의 다양화로 인해 수력 발전의 우위는 점차 약화되고 있으며, 남아프리카의 재생에너지 시장은 보다 균형 잡힌 구조로 나아가고 있습니다.
기타 혜택:
- 엑셀 형식 시장 예측(ME) 시트
- 3개월간의 애널리스트 지원
자주 묻는 질문
목차
제1장 서론
제2장 조사 방법
제3장 주요 요약
제4장 시장 구도
제5장 시장 규모와 성장 예측
제6장 경쟁 구도
제7장 시장 기회와 향후 전망
JHS 26.08.26According to Mordor Intelligence, the Southern Africa renewable energy market size was valued at 37.21 gigawatt in 2025 and estimated to grow from 42.84 gigawatt in 2026 to reach 86.63 gigawatt by 2031, at a CAGR of 15.12% during the forecast period (2026-2031).
This report is Segmented by Technology (Solar Energy, Wind Energy, Hydropower, Bioenergy, Geothermal, and Ocean Energy), End-User (Utilities, Commercial and Industrial, and Residential), and Geography (South Africa, Angola, Zambia, Democratic Republic of Congo, Tanzania, Mozambique, and Rest of Southern Africa). The Market Sizes and Forecasts are Provided in Terms of Installed Capacity (GW).
Southern Africa Renewable Energy Market Trends and Insights
Declining LCOE for Solar & Wind
Module oversupply from Asian manufacturers lowered utility-scale solar tariffs below USD 0.03 per kWh in the Northern Cape by late 2024, well under Eskom's average generation cost of ZAR 1.48 per kWh. JinkoSolar and First Solar supplied Bid Window 7 projects at prices 22% below 2022 benchmarks, enabling sub-ZAR 0.50 per kWh twenty-year power purchase agreements. Onshore wind LCOE in the Eastern Cape approached USD 0.04 per kWh, yet logistics bottlenecks and grid delays left wind bids 18% costlier than solar, resulting in zero wind allocations in Bid Window 7. Namibia's Hyphen project secured a blended renewables tariff of USD 0.025 per kWh for its 7 GW portfolio, establishing a regional floor and signaling future price compression. Coupling four-hour batteries with solar now provides dispatchable capacity at roughly USD 0.06 per kWh, eroding the economics of coal peakers and supporting Eskom's just-transition schedule.
Escalating Eskom Tariffs & Load-Shedding Risk
NERSA's 36% tariff hike raises the average industrial power cost above ZAR 2.20 per kWh in 2025/26, reducing the payback period for rooftop solar arrays larger than 500 kW to below four years. Stage 6 load-shedding persisted for 78 days in 2024, prompting mining majors to contract more than 200 MW of captive solar-plus-storage systems. The Electricity Regulation Amendment Act allows private transmission investment and wheeling, enabling corporate buyers in Gauteng to source Northern Cape renewables without Eskom as an intermediary. This reform is expected to reduce Eskom's generation share below 60% by 2030, transitioning the utility toward a pure transmission-system-operator role. Multilateral lenders are linking concessional finance to accelerated grid upgrades, tying future disbursements to measurable reductions in unserved energy.
Transmission Bottlenecks in Cape & Namibia Corridors
Northern Cape lines operate at 92% utilization, curtailing 180 gigawatt-hours (GWh) per year and delaying grid connections by up to 18 months. Eskom deferred the ZAR 4.5 billion Aries-Kronos upgrade due to liquidity constraints, leaving 1.2 GW of awarded projects stranded. NamPower's Kokerboom-Gerus backbone can absorb only 800 MW of additional injections, yet Hyphen alone needs 2.5 GW of export capacity. Private-sector interest exists, but cost-recovery and wheeling-tariff pass-through remain unclear, stalling financial close on the first independent transmission projects. Developers are co-locating batteries to shift output into off-peak transmission windows, adding USD 150-200 per kW to capital expenditures (capex) and trimming equity returns by up to 2 percentage points.
Other drivers and restraints analyzed in the detailed report include:
- REIPPPP & South African Renewable Energy Masterplan
- Surge in Corporate PPAs & Wheeling Frameworks
- Wind-Specific Site Scarcity & Auction Failures
For complete list of drivers and restraints, kindly check the Table Of Contents.
Segment Analysis
Hydropower dominated the Southern African renewable energy market, accounting for a 61.25% share in 2025, as legacy assets, such as Zambia's Kariba and the Democratic Republic of Congo's Inga complexes, continue to supply bulk power. Wind capacity is expected to post a 24.35% CAGR to 2031, the fastest among all technologies, supported by forthcoming REIPPPP carve-outs and expanding corporate PPAs. Solar, including photovoltaic and concentrated solar power, accounted for 28.60% of capacity in 2025; ACWA Power's 420 MW Redstone plant with 12-hour molten-salt storage demonstrated solar's dispatchable potential, a feature utilities favor for evening peaks. Bioenergy remains a niche market, accounting for less than 2% of capacity, primarily concentrated in South Africa's sugarcane belt, where mills co-generate power from bagasse. Geothermal and ocean energy are still in the exploratory stage; Tanzania's Rift Valley sites offer up to 5 GW of potential, but drilling costs of nearly USD 5 million per well dampen near-term prospects.
Developers anticipate that pumped-storage projects at Eskom's Ingula and Drakensberg sites will contribute 1.4 GW to grid balancing by 2030, despite capital costs exceeding USD 2,000 per kW. Small hydropower projects under 10 MW are proliferating in Angola and Mozambique through donor finance, aiming to reach 300 MW by 2030. Wind's upswing hinges on logistics solutions at Port Elizabeth and expedited environmental permits; hybrid solar-wind-storage plants are expected to win contracts as they diversify revenue streams. Ocean-energy pilot programs in Algoa Bay currently remain below commercial readiness levels, making material additions unlikely this decade. Overall, technology diversification is narrowing hydropower's dominance and steering the Southern Africa renewable energy market toward a more balanced mix.
Complete Report Scope:
- By Technology
- Solar Energy (PV and CSP)
- Wind Energy (Onshore and Offshore)
- Hydropower (Small, Large, PSH)
- Bioenergy
- Geothermal
- Ocean Energy (Tidal and Wave)
- By End-User
- Utilities
- Commercial and Industrial
- Residential
- By Geography
- South Africa
- Namibia
- Zambia
- Mozambique
- Botswana
- Angola
- Zimbabwe
- Rest of Southern Africa
List of Companies Covered in this Report:
- Scatec ASA
- EDF Renewables
- Enel Green Power South Africa
- BTE Renewables (BioTherm)
- ACWA Power
- JinkoSolar Holding Co. Ltd
- Vestas Wind Systems A/S
- Siemens Gamesa Renewable Energy SA
- Nordex SE
- First Solar Inc.
- Juwi AG
- Sola Group
- ABO Energy South Africa
- ACED ( African Clean Energy Developments)
- Pylontech South Africa
- Distributed Power Africa
- Freedom Won
- Eskom Renewable IPP Office
Additional Benefits:
- The market estimate (ME) sheet in Excel format
- 3 months of analyst support
TABLE OF CONTENTS
1 Introduction
- 1.1 Study Assumptions & Market Definition
- 1.2 Scope of the Study
2 Research Methodology
3 Executive Summary
4 Market Landscape
- 4.1 Market Overview
- 4.2 Market Drivers
- 4.2.1 Declining LCOE for solar & wind
- 4.2.2 Escalating Eskom tariffs & load-shedding risk
- 4.2.3 REIPPPP & new Renewable Energy Masterplan (SAREM)
- 4.2.4 Surge in corporate PPAs & wheeling frameworks
- 4.2.5 Green-hydrogen export corridors (Namibia, SA Northern Cape)
- 4.2.6 Monetisation of carbon markets & EU-CBAM avoidance
- 4.3 Market Restraints
- 4.3.1 Transmission bottlenecks in Cape & Namibia corridors
- 4.3.2 Wind-specific site scarcity & auction failures
- 4.3.3 Currency & sovereign-credit risk deterring project finance
- 4.3.4 Skills gap for utility-scale BESS & O&M
- 4.4 Supply-Chain Analysis
- 4.5 Regulatory Outlook
- 4.6 Technological Outlook
- 4.7 Porters Five Forces
- 4.7.1 Threat of New Entrants
- 4.7.2 Bargaining Power of Suppliers
- 4.7.3 Bargaining Power of Buyers
- 4.7.4 Threat of Substitutes
- 4.7.5 Industry Rivalry
5 Market Size & Growth Forecasts
- 5.1 By Technology
- 5.1.1 Solar Energy (PV and CSP)
- 5.1.2 Wind Energy (Onshore and Offshore)
- 5.1.3 Hydropower (Small, Large, PSH)
- 5.1.4 Bioenergy
- 5.1.5 Geothermal
- 5.1.6 Ocean Energy (Tidal and Wave)
- 5.2 By End-User
- 5.2.1 Utilities
- 5.2.2 Commercial and Industrial
- 5.2.3 Residential
- 5.3 By Geography
- 5.3.1 South Africa
- 5.3.2 Namibia
- 5.3.3 Zambia
- 5.3.4 Mozambique
- 5.3.5 Botswana
- 5.3.6 Angola
- 5.3.7 Zimbabwe
- 5.3.8 Rest of Southern Africa
6 Competitive Landscape
- 6.1 Market Concentration
- 6.2 Strategic Moves (M&A, JVs, Funding, PPAs)
- 6.3 Market Share Analysis (Market Rank/Share for key companies)
- 6.4 Company Profiles (includes Global-level Overview, Market-level Overview, Core Segments, Financials, Strategic Information, Products & Services, Recent Developments)
- 6.4.1 Scatec ASA
- 6.4.2 EDF Renewables
- 6.4.3 Enel Green Power South Africa
- 6.4.4 BTE Renewables (BioTherm)
- 6.4.5 ACWA Power
- 6.4.6 JinkoSolar Holding Co. Ltd
- 6.4.7 Vestas Wind Systems A/S
- 6.4.8 Siemens Gamesa Renewable Energy SA
- 6.4.9 Nordex SE
- 6.4.10 First Solar Inc.
- 6.4.11 Juwi AG
- 6.4.12 Sola Group
- 6.4.13 ABO Energy South Africa
- 6.4.14 ACED ( African Clean Energy Developments)
- 6.4.15 Pylontech South Africa
- 6.4.16 Distributed Power Africa
- 6.4.17 Freedom Won
- 6.4.18 Eskom Renewable IPP Office
7 Market Opportunities & Future Outlook
- 7.1 White-space & Unmet-Need Assessment


