

|
시장보고서
상품코드
2115236
입자 계수기 시장 : 점유율 분석, 업계 동향과 통계, 성장 예측(2026-2031년)Particle Counters - Market Share Analysis, Industry Trends & Statistics, Growth Forecasts (2026 - 2031) |
||||||
 Mordor Intelligence
Mordor Intelligence에 의하면, 입자 계수기 시장 규모는 2026년에 2억 7,643만 달러로 추정되고 있어 예측 기간(2026-2031년)에서 CAGR 7.21%로 성장을 지속하여, 2031년에는 3억 9,153만 달러에 이를 전망입니다.
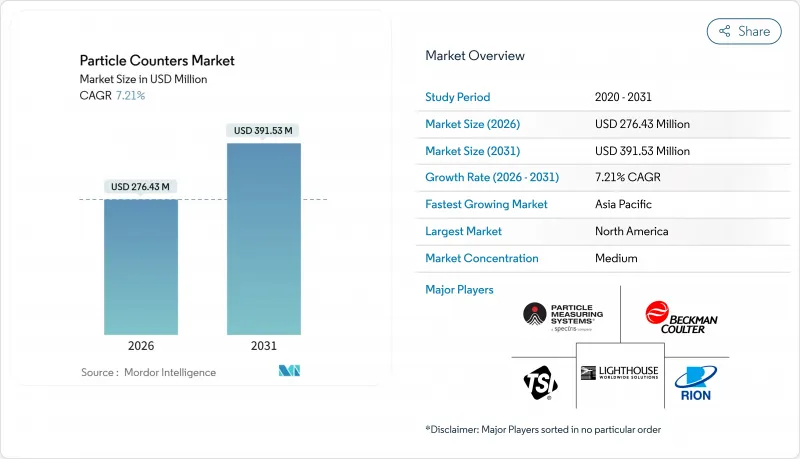
본 보고서는 제품 유형(부유 입자 계수기 등), 용도(클린룸 모니터링 등), 설치 형태(탁상형, 휴대형, 원격형), 최종 사용자(제약·바이오기술 기업 등), 지역(북미, 유럽, 아시아태평양, 중동 및 아프리카, 남미)별로 분류되어 있습니다. 시장 전망은 금액(달러) 기준으로 제시되어 있습니다.
전 세계 입자 계수기 시장 동향 및 인사이트
전 세계 클린룸 기준의 강화(ISO 14644 및 GMP 부록 1)
2023년 8월 현재, 부록 1에서는 무균 의약품 제조업체에 대해 정기적인 표본 검사를 대신하여 등급 A 및 B 구역에서 지속적인 입자 로그를 유지할 것을 의무화하고 있습니다. 또한, ISO 14644-5:2025에서는 온라인 데이터가 규정 준수를 충족하는 것으로 확인될 경우, 운영자가 재적격성 평가 주기를 6개월에서 24개월로 연장할 수 있도록 되어 있어, 이를 통해 가동 중단 시간과 검증 비용을 절감할 수 있습니다. 베크만 콜터(Beckman Coulter)사의 ‘MET ONE 3400+’와 같은 장비는 SOP(표준 작업 절차) 및 감사 추적을 자동화하여, FDA 감사관에게 원클릭으로 규정 준수를 입증할 수 있게 해줍니다(1). 업그레이드를 미뤄왔던 기업들은 현재 규제 당국의 강화된 감시에 직면해 있으며, 구형 핸드헬드 기기의 교체가 가속화되고 있습니다.
생물학적 제제 및 세포 치료제 제조의 급속한 성장
일회용 바이오리액터는 전례 없는 누출 위험을 초래하기 때문에 각 CDMO 기업들은 500만 달러 상당의 배치 손실이 발생하기 전에 백의 결함을 감지할 수 있는 실시간 입자 계수기를 충전실에 설치하고 있습니다. FDA의 2024년판 ‘첨단 치료에 관한 지침’에서는 환경 모니터링이 중요한 품질 속성으로 다루어지고 있으며, 지속적인 입자 동향 추적이 표준 관행으로 자리 잡아가고 있습니다. TSI사의 ‘BioTrak’ 계수기는 살아있는 미생물과 비활성 입자를 구별할 수 있어, 과거 운영자가 별도의 공기 샘플러 데이터를 대조해야만 했던 오랜 데이터 격차를 해소합니다. 미국과 중국에서 진행 중인 1,200건 이상의 세포 치료 임상시험이 수요를 집중시키고 있어, 캠페인 사이에 클린룸을 재구성하는 시설로의 판매 대수를 끌어올리고 있습니다.
HEPA 등급의 제어 환경에 필요한 고액의 설비 투자
ISO 클래스 7 클린룸을 건설하는 데는 1제곱피트당 평균 1,500-3,000달러의 비용이 들지만, 20대의 계수기로 구성된 네트워크를 구축할 경우 하드웨어 비용만으로도 20만 달러가 추가로 필요합니다. 필터, 교정, 라이선싱 등의 정기적인 서비스 비용은 해당 지출의 매년 20-30%를 차지하고 있어, 소규모 CDMO나 학술 연구소에게는 과제가 되고 있습니다. 따라서 동남아시아의 많은 제네릭 의약품 제조업체들은 현금 흐름을 확보하기 위해 지속적인 모니터링 대신 휴대용 기기를 이용한 검증에 의존하며, 규제상의 위험을 감수하고 있습니다. 리스나 ‘교정 서비스(Calibration-as-a-Service)’와 같은 모델이 등장하고 있지만, 자산 집약형 기업들은 감가상각의 이점을 중시하여 소유를 선호하기 때문에 그 보급은 더딘 실정입니다.
부문 분석
2025년, 부유 입자 계수기는 입자 계수기 시장 점유율의 61.42%를 차지하며, 제약 클린룸, 웨이퍼 공장 및 국가 모니터링 네트워크에서 그 입지를 확고히 다졌습니다. 한편, 액체용 입자 계수기는 팹이 초순수(UPW)의 순도를 1조 분의 1 단위 수준까지 높이고,기가팩토리가 수지상 결정을 유발하는 금속 시드의 혼입을 방지하기 위해 탈이온 세정수를 엄격히 관리함에 따라, 2031년까지 연평균 성장률(CAGR) 9.32%를 기록할 전망입니다. 따라서 액체용 입자 계수기 시장 규모는 공기용 장치와의 수량 격차를 좁히는 한편, 10 nm 미만의 검출 요건으로 인해 더 높은 이익률을 확보할 전망입니다.
현재 각 벤더들은 미 산란의 한계를 극복하기 위해 에어로졸화 스테이지와 수성 응축 광학계를 통합하고 있으며, 이를 통해 10 nm라는 유효 분해능을 실현하고 있습니다. ‘Nano LPM’과 같은 장비는 20-30%의 가격 프리미엄이 붙지만, 50억 달러 규모의 리소그래피 라인에서 불량품 발생을 방지함으로써 그 비용은 정당화되고 있습니다. 대조적으로, 공기역학적 방식 및 응축식 입자 크기 측정 장비는 흡입기 검증,대기 과학, 디젤 필터 시험 등에 사용됩니다. 출하량 합계는 10% 미만이지만, 이러한 틈새 시장용 장비는 표준 광학 현미경을 뛰어넘는 초미세 분해능을 필요로 하는 학술 연구소 및 규제 당국으로부터의 안정적인 수요를 뒷받침하고 있습니다.
클린룸 모니터링은 부속서 1 및 ISO 14644의 자동화로 인해 실시간 로깅이 ‘모범 사례’에서 ‘기본 요건’으로 변화함에 따라(3), 2025년 매출의 64.09%를 차지했습니다. 그러나 ‘에어로졸 모니터링 및 조사’ 분야는 2031년까지 연평균 성장률(CAGR) 8.97%로 가장 빠른 성장을 기록할 전망입니다. 이는 NSF(미국 국립과학재단)의 ASCENT 네트워크와 DOE(미국 에너지부)의 에어로졸·구름 프로그램을 통해 SMPS 및 응축식 계수기 구입 자금으로 대학에 막대한 보조금이 투입되고 있는 것이 뒷받침되고 있습니다. 따라서, 연구용 입자 계수기 시장 규모는 기존의 제약 분야 수요보다 빠르게 확대되고 있으며, 이는 공중 보건과 기후 과학이 업계의 새로운 개척 분야로 부상하고 있음을 보여줍니다.
알츠하이머병, 심혈관 질환, 대기 복사 강제력과 초미세 입자의 관련성을 규명하는 프로젝트에서는 10nm까지의 입자를 측정할 수 있는 장비가 요구되고 있습니다. 각 제조업체는 이에 대응하여 공기 채널과 액체 채널을 전환할 수 있는 듀얼 모드 장치를 제공하고 있으며, 연구자들은 한 번의 측정으로 입자 크기와 화학적 지문을 모두 파악할 수 있습니다. 제약 및 반도체 연구소들도 이러한 연구용 등급의 기능을 활용하여 미량 오염의 근본적인 메커니즘을 규명하고 있으며, 생산 품질 관리(QA)와 학술 연구 사이의 기존 경계가 모호해지고 있습니다.
지역별 분석
북미는 2025년 매출의 41.65%를 차지하고 있으며, FDA 부록 1을 준수하는 감독 체제와 애리조나주 및 오하이오주의 신규 팹 건설을 지원하는 CHIPS법의 인센티브에 힘입고 있습니다. 이 지역의 입자 계수기 시장 규모는 꾸준히 확대되고 있는데, 이는 제약 업계와 로직 노드 선도 기업들이 규정 준수 및 수율을 확보하기 위해 지속적인 모니터링을 필수 요건으로 간주하고 있기 때문입니다. ISO/IEC 17025의 적용 범위는 50개 이상의 인증 실험실에 이르며, 교정으로 인한 가동 중단 시간을 1주일 미만으로 단축하고 있습니다. 현지 기존 기업들은 이 서비스 네트워크를 활용하여 정기 계약을 확보하고, 가격을 중시하는 수입품에 대한 시장 점유율을 지키고 있습니다.
아시아태평양은 인도와 중국이 환경 모니터링 네트워크에 수십억을 투자하고, 대만, 일본, 한국이 2nm 생산 라인을 본격화함에 따라 2031년까지 연평균 성장률(CAGR) 8.18%로 가장 빠른 성장을 기록할 전망입니다. 인도의 1,961억 4,000만 루피, 중국의 300억 위안과 같은 정부 예산 배분으로 인해, 기술자 부족을 해소하기 위해 교정 서비스가 패키지 형태로 제공되는 경우가 많은 공공 입찰이 강화되고 있습니다. 한편, 중국, 한국, 일본에 있는 80곳 이상의 전기차 배터리 공장에서는 1개 거점당 수백 대의 원격 계수기가 도입되어 있으며, 도입 대수가 급속히 확대되고 있습니다. 인도 아대륙 전체를 아우르는 공인 에어로졸 시험소가 고작 30곳에 불과하기 때문에 현장 검증 방식이 훨씬 현실적이며, 턴키 방식의 ‘서비스형 교정(Calibration-as-a-Service)’을 제공하는 업체들이 주목받고 있습니다.
유럽은 약 23%의 점유율을 차지하고 있지만, 역풍에 직면해 있습니다. 인텔은 300억 유로 규모의 마그데부르크 공장 건설을 연기했고, ASML은 2025년에 EUV 장비를 60대밖에 출하하지 못해 당초 예측을 밑돌았기 때문에 신규 장비 수주는 주춤하고 있습니다. 대신, 성장은 ‘부속서 1’ 대상 설비의 갱신 주기나, 폭스바겐의 잘츠기터, 노스볼트의 에트와 같은 배터리 셀 생산 라인에 힘입고 있습니다. 이러한 생산 라인은 생산 능력 면에서 여전히 아시아에 뒤처져 있습니다. 이 지역은 PTB 및 NPL이 제공하는 탄탄한 교정 인프라의 혜택을 받고 있어 규정 준수 대응의 신속성이 보장되고 있습니다. 그러나 각 공급업체들은 신규 설치의 정체분을 만회하기 위해 소프트웨어 업그레이드 및 센서 개조에 점점 더 주력하고 있습니다.
중동 및 아프리카 및 남미는 합쳐서 10% 미만의 기여도에 그치고 있지만, 잠재적인 성장 여지를 가지고 있습니다. 브라질에서는 2024년에 부속서 1 방식의 모니터링이 도입됨에 따라 현지 제약 기업들은 현대화를 피할 수 없게 되었으나, 국내에 교정 연구소가 없어 도입 진척이 더딘 실정입니다. 반도체 팹의 현지화를 검토하고 있는 걸프 국가들에서는 계측 장비에 대한 수요가 발생할 가능성이 있지만, 프로젝트는 여전히 타당성 조사 단계에 머물러 있습니다. 두 지역 모두에서 이송 표준에 대해 검증된 휴대용 계수기는 자국의 계측 역량이 성숙해질 때까지 임시적인 해결책이 될 것입니다.
기타 혜택:
- 엑셀 형식 시장 예측(ME) 시트
- 3개월간의 애널리스트 지원
자주 묻는 질문
목차
제1장 서론
제2장 조사 방법
제3장 주요 요약
제4장 시장 구도
제5장 시장 규모와 성장 예측
제6장 경쟁 구도
제7장 시장 기회와 향후 전망
JHS 26.08.26According to Mordor Intelligence, the particle counters market size is estimated at USD 276.43 million in 2026, and is expected to reach USD 391.53 million by 2031, at a CAGR of 7.21% during the forecast period (2026-2031).
This report is Segmented by Product Type (Airborne Particle Counters, and More), Application (Cleanroom Monitoring, and More), Modality (Benchtop, Portable, and Remote), End User (Pharmaceutical and Biotechnology Companies, and More), and Geography (North America, Europe, Asia-Pacific, Middle East & Africa, and South America). The Market Forecasts are Provided in Terms of Value (USD).
Global Particle Counters Market Trends and Insights
Stricter Global Cleanroom Standards (ISO 14644 & GMP Annex 1)
As of August 2023, Annex 1 requires sterile drug manufacturers to maintain continuous particle logs in Grade A and B zones, replacing periodic spot checks. ISO 14644-5:2025 further allows operators to extend requalification intervals from six to 24 months when online data demonstrates compliance, thereby reducing downtime and validation costs. Instruments such as Beckman Coulter's MET ONE 3400+ automate SOPs and audit trails, ensuring one-click compliance for FDA inspectors[1]. Companies that have delayed upgrades now face heightened regulatory scrutiny, accelerating a replacement wave across legacy handheld fleets.
Rapid Growth in Biologics and Cell-Therapy Manufacturing
Single-use bioreactors pose unseen breach risks, prompting CDMOs to install real-time particle counters in filling suites that can flag bag failures before USD 5 million batches are lost. The FDA's 2024 guidance on advanced therapies treats environmental monitoring as a critical quality attribute, cementing continuous particle trending as standard practice. TSI's BioTrak counter differentiates viable microbes from inert particles, closing a long-standing data gap that once forced operators to cross-reference separate air samplers. More than 1,200 active cell-therapy trials concentrate demand in the United States and China, fuelling strong unit sales to facilities that reconfigure cleanrooms between campaigns.
High Capital Expenditure for HEPA-Grade Controlled Environments
Constructing an ISO Class 7 cleanroom averages USD 1,500-3,000 per ft2, while a 20-counter network can add USD 200,000 in hardware alone. Recurring services-such as filters, calibration, and licenses-absorb 20-30% of that outlay each year, posing a challenge to smaller CDMOs and academic labs. Many generic producers in Southeast Asia, therefore, rely on handheld validation instead of continuous monitoring, accepting higher regulatory risk to conserve cash. Leasing and calibration-as-a-service models have emerged, yet uptake is slow because asset-heavy firms prefer ownership for depreciation benefits.
Other drivers and restraints analyzed in the detailed report include:
- Accelerating Semiconductor Node Shrink Demanding Sub-Micron Monitoring
- Surge in EV Battery Gigafactories and Ultra-Dry Room Adoption
- Scarcity of Certified Calibration Technicians and Laboratories
For complete list of drivers and restraints, kindly check the Table Of Contents.
Segment Analysis
Airborne particle counters retained 61.42% of the particle counters market share in 2025, cementing their role in pharmaceutical cleanrooms, wafer fabs, and national monitoring grids. Liquid particle counters, however, will register a 9.32% CAGR through 2031 as fabs push UPW purity into the single-digit parts-per-trillion range and gigafactories police deionized rinse water for metallic seeds that trigger dendrites. The particle counters market size for liquid applications is thus poised to narrow the volume gap with airborne units, while commanding higher margins due to sub-10 nm detection requirements.
Vendors now integrate aerosolization stages and water-based condensation optics to bypass Mie-scattering limits, enabling actual resolutions of 10 nm. Instruments such as the Nano LPM carry a 20-30% price premium but justify the cost by preventing scrap on USD 5 billion lithography lines. In contrast, aerodynamic and condensation sizers are used in inhaler validation, atmospheric science, and diesel filter testing. Although collectively accounting for less than 10% of shipment volume, these niche devices sustain steady demand from academic labs and regulatory agencies that require ultrafine resolution beyond standard optical microscopes.
Cleanroom Monitoring generated 64.09% of 2025 revenue as Annex 1 and ISO 14644 automation turned real-time logging from best practice into baseline expectation[3]. Yet Aerosol Monitoring and Research will post the quickest growth at 8.97% CAGR to 2031, propelled by the NSF's ASCENT network and DOE aerosols-cloud programs that flood universities with grant funds for SMPS and condensation counters. The particle counters market size for research is therefore expanding faster than legacy pharma demand, a signal that public health and climate science are shifting industry frontiers.
Projects exploring ultrafine links to Alzheimer's, cardiovascular disease, and atmospheric radiative forcing require instruments down to 10 nm. Manufacturers respond with dual-mode units that toggle between airborne and liquid channels, letting investigators capture both particle size and chemical fingerprint in a single run. Pharmaceutical and semiconductor labs also leverage these research-grade features to map root-cause mechanisms behind micro-contamination, blurring historical lines between production QA and academic discovery.
Complete Report Scope:
- By Product Type
- Airborne Particle Counters
- Liquid Particle Counters
- Other Product Types
- By Application
- Cleanroom Monitoring
- Contamination Monitoring of Liquids
- Aerosol Monitoring and Research
- By Modality
- Benchtop
- Portable
- Remote
- By End User
- Pharmaceutical and Biotechnology Companies
- Clinical and Diagnostic Laboratories
- Academic and Research Institutes
- Other End Users
- Geography
- North America
- United States
- Canada
- Mexico
- Europe
- Germany
- United Kingdom
- France
- Italy
- Spain
- Rest of Europe
- Asia-Pacific
- China
- Japan
- India
- Australia
- South Korea
- Rest of Asia-Pacific
- Middle East & Africa
- GCC
- South Africa
- Rest of Middle East & Africa
- South America
- Brazil
- Argentina
- Rest of South America
- North America
Geography Analysis
North America accounted for 41.65% of 2025 revenue, supported by FDA Annex 1-equivalent oversight and CHIPS Act incentives that underwrite the construction of new fabs in Arizona and Ohio. The particle counters market size in the region expands steadily because pharma and logic-node leaders treat continuous monitoring as non-negotiable for compliance and yield. ISO/IEC 17025 coverage exceeds 50 accredited labs, trimming calibration downtime to under one week. Local incumbents leverage this service network to lock in annuity contracts and defend share against price-focused imports.
The Asia-Pacific region will record the fastest growth at an 8.18% CAGR through 2031, as India and China invest billions in ambient networks, and as Taiwan, Japan, and South Korea ramp up 2-nm production lines. Government allocations-Rs. 19,614 crore in India and CNY 30 billion in China-fortify public tenders that often bundle calibration services to overcome technician scarcity. Meanwhile, over 80 EV battery plants across China, Korea, and Japan embed hundreds of remote counters per site, rapidly expanding the installed base. Vendors offering turnkey calibration-as-a-service gain traction because only 30 accredited aerosol labs serve the entire sub-continent, making on-site verification far more practical.
Europe claims roughly 23% share but faces headwinds. Intel has postponed its EUR 30 billion Magdeburg fab, and ASML shipped only 60 EUV tools in 2025, down from earlier projections, which has muted fresh equipment orders. Growth instead rests on Annex 1 replacement cycles and on battery-cell lines such as Volkswagen's Salzgitter and Northvolt's Ett, which still trail Asia in capacity. The region benefits from a dense calibration infrastructure at PTB and NPL, ensuring compliance speed; however, suppliers are increasingly pivoting toward software upgrades and sensor retrofits to offset lulls in new installations.
The Middle East & Africa, as well as South America, jointly contribute under 10% but hold latent upside. Brazil's adoption of Annex 1-style monitoring in 2024 forces local drug makers to modernize, yet the absence of domestic calibration labs slows rollouts. Gulf states exploring local semiconductor fabs could unlock demand for instruments, but projects remain at the feasibility stage. In both regions, portable counters validated against transfer standards offer a stopgap until home-grown metrology capacity matures.
- Beckman Coulter (Danaher)
- Chemtrac Systems
- Climet Instruments Company
- Danaher
- Fortive
- Hal Technology LLC
- Kanomax USA, Inc.
- Lighthouse Worldwide Solutions
- Markus Klotz
- Met One Instruments Inc.
- Microtrac Retsch GmbH
- PAMAS Partikelmess- Und Analysesysteme GmbH
- Particle Plus Inc.
- RION
- Spectris
- Suzhou Honri Airclean Technology Co., Ltd.
- Topas GmbH
- TSI Inc.
Additional Benefits:
- The market estimate (ME) sheet in Excel format
- 3 months of analyst support
TABLE OF CONTENTS
1 Introduction
- 1.1 Study Assumptions & Market Definition
- 1.2 Scope of the Study
2 Research Methodology
3 Executive Summary
4 Market Landscape
- 4.1 Market Overview
- 4.2 Market Drivers
- 4.2.1 Stricter Global Cleanroom Standards (ISO 14644 & GMP Annex 1)
- 4.2.2 Rapid Expansion of Biologics and Cell-Therapy Manufacturing
- 4.2.3 Accelerating Semiconductor Node Shrink Demanding Sub-Micron Monitoring
- 4.2.4 Surge in EV Battery Gigafactories and Ultra-Dry Room Adoption
- 4.2.5 Government-Funded Ambient Air-Quality Networks in Emerging Asia
- 4.2.6 AI-Enabled Predictive Maintenance Boosting Instrument Utilization
- 4.3 Market Restraints
- 4.3.1 High Capital Expenditure for HEPA-Grade Controlled Environments
- 4.3.2 Scarcity of Certified Calibration Technicians and Laboratories
- 4.3.3 Sensor Accuracy Drift in High-Humidity Production Lines
- 4.3.4 Consolidation of European Semiconductor Fabs Curtailing Replacement Demand
- 4.4 Regulatory & Technological Outlook
- 4.5 Porter's Five Forces Analysis
- 4.5.1 Threat of New Entrants
- 4.5.2 Bargaining Power of Buyers
- 4.5.3 Bargaining Power of Suppliers
- 4.5.4 Threat of Substitutes
- 4.5.5 Intensity of Competitive Rivalry
5 Market Size & Growth Forecasts (Value, USD)
- 5.1 By Product Type
- 5.1.1 Airborne Particle Counters
- 5.1.2 Liquid Particle Counters
- 5.1.3 Other Product Types
- 5.2 By Application
- 5.2.1 Cleanroom Monitoring
- 5.2.2 Contamination Monitoring of Liquids
- 5.2.3 Aerosol Monitoring and Research
- 5.3 By Modality
- 5.3.1 Benchtop
- 5.3.2 Portable
- 5.3.3 Remote
- 5.4 By End User
- 5.4.1 Pharmaceutical and Biotechnology Companies
- 5.4.2 Clinical and Diagnostic Laboratories
- 5.4.3 Academic and Research Institutes
- 5.4.4 Other End Users
- 5.5 Geography
- 5.5.1 North America
- 5.5.1.1 United States
- 5.5.1.2 Canada
- 5.5.1.3 Mexico
- 5.5.2 Europe
- 5.5.2.1 Germany
- 5.5.2.2 United Kingdom
- 5.5.2.3 France
- 5.5.2.4 Italy
- 5.5.2.5 Spain
- 5.5.2.6 Rest of Europe
- 5.5.3 Asia-Pacific
- 5.5.3.1 China
- 5.5.3.2 Japan
- 5.5.3.3 India
- 5.5.3.4 Australia
- 5.5.3.5 South Korea
- 5.5.3.6 Rest of Asia-Pacific
- 5.5.4 Middle East & Africa
- 5.5.4.1 GCC
- 5.5.4.2 South Africa
- 5.5.4.3 Rest of Middle East & Africa
- 5.5.5 South America
- 5.5.5.1 Brazil
- 5.5.5.2 Argentina
- 5.5.5.3 Rest of South America
- 5.5.1 North America
6 Competitive Landscape
- 6.1 Market Concentration
- 6.2 Market Share Analysis
- 6.3 Company Profiles (Includes Global-Level Overview, Market-Level Overview, Core Business Segments, Financials, Headcount, Key Information, Market Rank, Market Share, Products & Services, Recent Developments)
- 6.3.1 Beckman Coulter (Danaher)
- 6.3.2 Chemtrac Systems
- 6.3.3 Climet Instruments Company
- 6.3.4 Danaher
- 6.3.5 Fortive
- 6.3.6 Hal Technology LLC
- 6.3.7 Kanomax USA, Inc.
- 6.3.8 Lighthouse Worldwide Solutions
- 6.3.9 Markus Klotz GmbH
- 6.3.10 Met One Instruments Inc.
- 6.3.11 Microtrac Retsch GmbH
- 6.3.12 PAMAS Partikelmess- Und Analysesysteme GmbH
- 6.3.13 Particle Plus Inc.
- 6.3.14 RION Co., Ltd.
- 6.3.15 Spectris
- 6.3.16 Suzhou Honri Airclean Technology Co., Ltd.
- 6.3.17 Topas GmbH
- 6.3.18 TSI Inc.
7 Market Opportunities & Future Outlook
- 7.1 White-Space & Unmet-Need Assessment


