|
시장보고서
상품코드
2115925
정전 관리 시스템 : 시장 점유율 분석, 산업 동향 및 통계 데이터, 성장 예측(2026-2031년)Outage Management Systems - Market Share Analysis, Industry Trends & Statistics, Growth Forecasts (2026 - 2031) |
||||||
 Mordor Intelligence
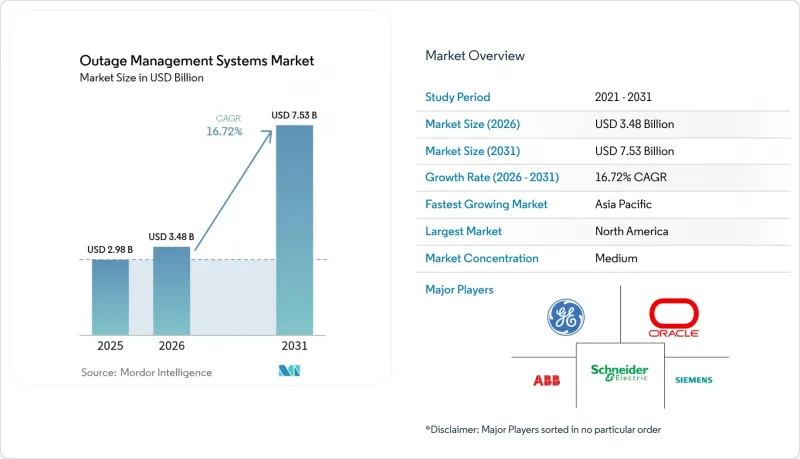
Mordor Intelligence에 의하면, 정전 관리 시스템 시장 규모는 2025년에 29억 8,000만 달러로 평가되었습니다. 2026년 34억 8,000만 달러에서 2031년까지 75억 3,000만 달러에 이를 것으로 추정되고 예측 기간(2026-2031년) CAGR은 16.72%를 나타낼 전망입니다.
본 보고서는 유형별(독립형, 통합형), 구성 요소별(소프트웨어, 서비스), 배포 방식별(On-Premise, 클라우드), 용도별(고장 위치 파악 및 격리, 복구 및 작업자 관리, 고객 정보 및 통화 대응),지역별(북미, 유럽, 아시아태평양, 남미 등)로 분류되어 있습니다. 시장 규모 및 전망은 금액(달러) 기준으로 제시되어 있습니다.
세계의 정전 관리 시스템 시장 동향 및 인사이트
기후 변화로 인한 정전 사태의 심화가 송전망 복원력 강화를 위한 투자를 촉진
현재 대규모 정전의 약 80%는 기상 요인에 기인하며, 이에 따라 전력 사업자들은 자동 섹션화 장치, 지하화, AI를 활용한 식생 분석 등 송전망 강화 대책에 막대한 투자를 하고 있습니다. CenterPoint Energy사만 해도 폭풍우에 대한 내성을 강화하기 위해 5년간 210억 달러를 배정하고 있어, 예방 기술에 현재 대규모 자본이 투입되고 있음을 알 수 있습니다. OMS 플랫폼은 고장 지점 파악 도구에서 기상 데이터, 자산 상태 데이터, 자동 전환 기능을 통합한 종합적인 복원력 허브로 진화했습니다. 며칠에 걸친 정전이 지역 경제에 반복적으로 수십억 달러의 손실을 초래하고 있는 만큼, 그 경제적 영향은 명백하며, 예측형 솔루션에 대한 투자 수익률(ROI)을 뒷받침하는 근거가 더욱 강화되고 있습니다. 또한, 전력 회사는 단순히 복구를 앞당기는 것보다 고객에 대한 공급 중단을 미연에 방지하는 것이 고객 만족도 지표 향상에 더 효과적이라는 점을 인식하고 있으며, 이것이 OMS 업그레이드를 가속화하는 요인이 되고 있습니다.
주요 전력 회사의 스마트 그리드 및 ADMS 도입
주요 전력 회사는 사일로화된 용도를 SCADA, GIS, AMI 데이터를 실시간으로 처리할 수 있는 통합형 ADMS-OMS 제품군으로 대체하고 있습니다. GE Vernova의 GridOS와 슈나이더 일렉트릭의 One Digital Grid 플랫폼은 이러한 변화를 상징하며, 자동화된 고장 지점 격리 및 분산형 에너지 자원(DER) 연동을 통해 정전을 최대 40%까지 줄이겠다고 약속하고 있습니다. 양방향 전력 흐름이 증가함에 따라 통합 솔루션은 필수 불가결해지고 있으며, 이것이 높은 가격 책정과 급속한 보급 곡선을 설명해 줍니다. 규제 당국이 사이버 복원력이 뛰어난 아키텍처를 강력히 요구하고 있음을 반영하여, 전력 회사들은 제로 트러스트 보안을 점점 더 많이 도입하고 있습니다.
막대한 자본 투자와 레거시 시스템 통합의 장벽
대규모 투자자 소유의 전력 회사에서 엔터프라이즈급 OMS 도입 비용은 종종 5,000만 달러를 초과합니다. 최신 API를 갖추지 못한, 수십년전부터 사용되어 온 SCADA, GIS, CIS 자산을 통합할 경우 비용은 더욱 치솟으며, 맞춤형 미들웨어 개발이나 장기간에 걸친 데이터 마이그레이션 프로젝트를 수행할 수밖에 없습니다. 현장 작업자가 자동화된 워크플로우에 적응하는 과정에서 조직적인 변경 관리가 도입을 더욱 복잡하게 만들고 있습니다. 전력 회사는 시스템 전환 기간 중에도 신뢰성 지표를 유지해야 하기 때문에 규제 당국의 감시가 여전히 엄격하여 실행 위험이 커지고 있습니다.
부문별 분석
CAGR은 연평균 성장률(Compound Annual Growth Rate)을 의미합니다. 통합형 솔루션을 도입한 공공 서비스 사업자들은 분산된 시스템을 사용하는 사용자에 비해 평균 정전 시간이 30-40% 단축되었다고 보고하고 있습니다.
Oracle의 ‘Energy &Water Data Intelligence’는 이러한 추세를 상징하는 것으로, 운영 텔레메트리, 기상 인텔리전스, 고객 분석을 융합하여 의사 결정 로직을 자동화하고 있습니다. 그 결과, 통합 솔루션에 기반한 정전 관리 시스템(OMS) 시장 규모는 2031년에 이르기까지 독립형 도입 대비 우위를 더욱 확대될 전망입니다. 따라서 종합적인 포트폴리오를 보유한 벤더는 협상 우위를 확보하는 한편, 틈새 시장용 포인트 솔루션 제공업체들은 시장 내 입지를 유지하기 위해 파트너십 및 인수를 점점 더 모색하고 있습니다.
소프트웨어는 2025년에 66.70%의 점유율을 유지했으며, ABB, GE Vernova, 슈나이더 일렉트릭의 성숙한 코드베이스가 이를 뒷받침하고 있습니다. 그러나 유틸리티자들이 AI 모델 훈련, 사이버 보안 강화, 다중 시스템 간 데이터 통합에 대한 지침을 필요로 함에 따라 서비스 부문은 연평균 성장률(CAGR) 18.02%로 확대되고 있습니다. 유틸리티자들이 관할 구역별 신뢰성 규정 및 클라우드 주권에 관한 법규에 직면함에 따라 컨설팅 분야가 가장 빠른 성장세를 보이고 있습니다.
또한, 소프트웨어 조달액이 프로젝트 총 비용의 약 3분의 1에 불과하기 때문에 도입 및 지원 분야도 빠르게 확대되고 있습니다. 구독 모델로의 전환은 벤더의 지속적인 수익원을 강화하고 있습니다. 슈나이더 일렉트릭은 2024년에 SaaS 매출이 140% 급증했는데, 이는 전력 회사가 자본 지출(Capex)을 운영 비용(OpEx)으로 전환할 의향이 있음을 나타냅니다. 그 결과, 서비스 제공업체는 프로젝트 성과에 지대한 영향력을 행사하게 되었으며, 정전 관리 시스템 시장을 수명 주기 가치(LTV)가 높은 경제성으로 이끌고 있습니다.
지역별 분석
북미는 2025년 정전 관리 시스템 시장 매출의 37.00%를 차지했습니다. 이는 80억 달러 규모의 연방 송전 보조금과 전력 사업자들에게 송전망 강화를 촉구한 일련의 혹독한 기상 현상에 힘입은 결과입니다. 통합 솔루션의 도입은 SAIDI/SAIFI 성과를 가시적으로 개선하기 때문에 투자자들로부터 높은 평가를 받고 있습니다. 캐나다에서는 주 차원의 현대화를 통해 지역적 성장세를 뒷받침하고 있습니다. 그 예로, Energie NB Power의 AI 기반 정전 예측 프로그램을 들 수 있는데, 2024년 얼음 폭풍 당시 24시간 이내에 고객의 90%에게 전력 공급을 복구했습니다.
아시아태평양은 연평균 성장률(CAGR) 19.18%를 기록하며 가장 빠른 성장세를 보이고 있습니다. 중국의 국가전망은 2024년 디지털 변전소 및 초고압 송전선에 6,000억 위안 이상을 예산으로 편성했으며, 이는 대규모 OMS 입찰을 촉진하고 있습니다. 일본은 AI 주도형 데이터센터의 확장을 전망하며, 송전망 강화에 1,500억 엔 이상을 투자하기로 결정했습니다. 인도 역시 추가 성장 여지가 있어, 히타치 에너지는 국내 생산 능력 및 디지털 솔루션 역량 확대를 위해 200억 루피를 배정했습니다.
유럽, 라틴아메리카, 중동 및 아프리카에서는 성장률이 다소 낮지만 꾸준한 증가세를 보이고 있습니다. 라틴아메리카에서는 칠레의 2050년 탄소 중립 달성을 위한 로드맵에 따라 2040년까지 배전 분야에서 4,310억 달러의 지출이 필요할 것으로 예상되며, 이에 따라 OMS의 잠재적 예산 규모가 확대되고 있습니다. 유럽의 전력 사업자들은 분산형 에너지 자원(DER)의 통합과 폭풍우에 대한 내성 강화를 중시하고 있지만, 송전망의 현대화가 이미 성숙 단계에 이르러 수익 확대 속도는 둔화되고 있습니다. 모든 2차 지역에서 정부의 정책 지원과 다자간 기후 변화 자금 메커니즘이 OMS 도입 속도에 있어 매우 중요한 역할을 하고 있습니다.
기타 혜택 :
- 엑셀 형식 시장 예측(ME) 시트
- 3개월간의 애널리스트 지원
자주 묻는 질문
목차
제1장 서론
제2장 분석 방법
제3장 개요
제4장 시장 구도
제5장 시장 규모 및 성장률 예측
제6장 경쟁 구도
제7장 시장 기회 및 향후 전망
KTH 26.08.31According to Mordor Intelligence, the outage management systems market size was valued at USD 2.98 billion in 2025 and estimated to grow from USD 3.48 billion in 2026 to reach USD 7.53 billion by 2031, at a CAGR of 16.72% during the forecast period (2026-2031).
This report is Segmented by Type (Stand-Alone and Integrated), Component (Software and Service), Deployment Mode (On-Premises and Cloud), Application (Fault Location and Isolation, Restoration and Crew Management, and Customer Information and Call Handling), and Geography (North America, Europe, Asia-Pacific, South America, and More). The Market Sizes and Forecasts are Provided in Terms of Value (USD)
Global Outage Management Systems Market Trends and Insights
Intensifying Climate-Related Outages Boosting Grid-Resilience Spend
Weather now drives nearly 80% of major outages, prompting utilities to invest heavily in grid-hardening initiatives, such as automated sectionalizers, undergrounding, and AI-based vegetation analytics. CenterPoint Energy alone has allocated USD 21 billion over five years to bolster storm resilience, illustrating the large-scale capital currently being invested in preventive technologies. OMS platforms have evolved from fault location tools into comprehensive resilience hubs that integrate weather feeds, asset health data, and automated switching. The economic stakes are evident as multi-day outages repeatedly impose multi-billion-dollar losses on regional economies, strengthening return-on-investment arguments for predictive solutions. Utilities also recognize that preventing customer interruptions enhances satisfaction metrics more effectively than merely accelerating restoration, which in turn prompts accelerated OMS upgrades.
Smart-Grid & ADMS Roll-Outs Across Tier-1 Utilities
Large utilities are replacing siloed applications with unified ADMS-OMS suites that can process SCADA, GIS, and AMI data in real-time. GE Vernova's GridOS and Schneider Electric's One Digital Grid platforms exemplify the shift, promising outage reductions of up to 40% through automated fault isolation and DER coordination. As bidirectional power flows rise, integrated solutions become indispensable, explaining their premium pricing and faster adoption curve. Utilities increasingly embed Zero-Trust security, reflecting regulators' insistence on cyber-resilient architectures.
High Capex & Legacy Integration Hurdles
Enterprise-grade OMS deployments often exceed USD 50 million for large investor-owned utilities. Cost escalates when integrating decades-old SCADA, GIS, and CIS assets that lack modern APIs, forcing custom middleware development and long data-migration projects. Organizational change management further complicates roll-outs as frontline crews adapt to automated workflows. Regulatory scrutiny remains intense because utilities must uphold reliability metrics during system migrations, amplifying execution risk.
Other drivers and restraints analyzed in the detailed report include:
- AI-Driven Predictive Outage Analytics Adoption
- DER Proliferation Demanding Real-Time Visibility
- Cyber-Security Vulnerabilities in Connected OMS
For complete list of drivers and restraints, kindly check the Table Of Contents.
Segment Analysis
Integrated platforms commanded 61.90% of the revenue in 2025 and are forecast to grow at a 19.12% CAGR to 2031, reflecting utilities' drive to consolidate multiple point tools into a single pane of glass. This leadership position underscores how integrated suites cut vendor-management overhead, eliminate data-silo latency, and streamline restoration workflows. Utilities that deploy integrated offerings report 30-40% shorter average outage durations compared to users of fragmented systems.
Oracle's Energy & Water Data Intelligence exemplifies the trend, fusing operational telemetry, weather intelligence, and customer analytics to automate decision logic. As a result, the Outage Management System market size attributed to integrated solutions is set to widen its lead over standalone deployments through 2031. Vendors with comprehensive portfolios, therefore, obtain negotiating leverage, while niche point-solution providers increasingly seek partnerships or acquisitions to remain relevant.
Software maintained a 66.70% share in 2025, anchored by mature codebases from ABB, GE Vernova, and Schneider Electric. Yet services are expanding at 18.02% CAGR because utilities need guidance in AI model training, cyber-hardening, and multi-system data alignment. Consulting captures the fastest growth as utilities confront jurisdiction-specific reliability rules and cloud-sovereignty statutes.
Implementation and support also scale briskly because software procurement accounts for only about one-third of total project spend. The transition toward subscription models reinforces vendor annuity streams. Schneider Electric recorded a 140% jump in SaaS revenue in 2024, signaling utilities' willingness to trade capital expenditures (capex) for operational expenditures (opex). Consequently, service providers wield outsized influence over project outcomes, nudging the Outage Management System market toward higher lifetime-value economics.
Complete Report Scope:
- By Type
- Stand-alone
- Integrated
- By Component
- Software
- Services
- By Deployment Mode
- On-premise
- Cloud
- By Application
- Fault Location and Isolation
- Restoration and Crew Management
- Customer Information and Call Handling
- By Geography
- North America
- United States
- Canada
- Mexico
- Europe
- Germany
- United Kingdom
- France
- Italy
- NORDIC Countries
- Russia
- Rest of Europe
- Asia-Pacific
- China
- India
- Japan
- South Korea
- ASEAN Countries
- Rest of Asia-Pacific
- South America
- Brazil
- Argentina
- Rest of South America
- Middle East and Africa
- Saudi Arabia
- United Arab Emirates
- South Africa
- Rest of Middle East and Africa
- North America
Geography Analysis
North America generated 37.00% of the Outage Management System market revenue in 2025, driven by USD 8 billion in federal transmission grants and a series of severe weather events that compelled utilities to strengthen their grids. Investors reward the procurement of integrated solutions because it visibly improves SAIDI/SAIFI performance. Canada supports regional momentum through provincial-level modernization, as illustrated by Energie NB Power's AI-based outage prediction program, which restored 90% of customers within 24 hours during a 2024 ice storm.
The Asia-Pacific region is the fastest-growing, with a 19.18% CAGR. China's State Grid budgeted more than 600 billion yuan in 2024 for digital substations and ultra-high-voltage corridors, fuelling large OMS tenders. Japan committed upwards of 150 billion yen to reinforce its network in anticipation of AI-driven data-center expansion. India presents additional upside, as Hitachi Energy has earmarked INR 2,000 crore to scale its domestic manufacturing and digital solutions capabilities.
Europe, Latin America, and the Middle East & Africa show steady though lower growth. In Latin America, Chile's 2050 carbon-neutrality roadmap requires USD 431 billion in distribution spending by 2040, thereby expanding the addressable OMS budgets. European utilities emphasize DER integration and storm-resilience upgrades but face slower revenue expansion given their matured grid-modernization baselines. Across all secondary regions, government policy support and multilateral climate finance mechanisms play pivotal roles in the pace of OMS adoption.
- ABB Ltd.
- General Electric Co.
- Oracle Corp.
- Schneider Electric SE
- Siemens AG
- Hitachi Energy (OMS)
- Hexagon (Intergraph)
- CGI Inc.
- Advanced Control Systems (Indra/Minsait ACS)
- Futura Systems Inc.
- ETAP Automation
- Survalent Technology
- Landis+Gyr Group
- Milsoft Utility Solutions
- Trimble Utilities
- OSIsoft (AVEVA)
- IBM Corp.
- Cisco Systems Inc.
- Fujitsu Ltd.
- S&C Electric Co.
- Itron Inc.
Additional Benefits:
- The market estimate (ME) sheet in Excel format
- 3 months of analyst support
TABLE OF CONTENTS
1 Introduction
- 1.1 Study Assumptions & Market Definition
- 1.2 Scope of the Study
2 Research Methodology
3 Executive Summary
4 Market Landscape
- 4.1 Market Overview
- 4.2 Market Drivers
- 4.2.1 Intensifying climate-related outages boosting grid-resilience spend
- 4.2.2 Smart-grid & ADMS roll-outs across Tier-1 utilities
- 4.2.3 Reliability-index (SAIDI/SAIFI) compliance mandates
- 4.2.4 AI-driven predictive outage analytics adoption
- 4.2.5 DER proliferation demanding real-time visibility
- 4.2.6 Shift to cloud-native OMS & mobile workforce tools
- 4.3 Market Restraints
- 4.3.1 High capex & legacy integration hurdles
- 4.3.2 Cyber-security vulnerabilities in connected OMS
- 4.3.3 GIS data-quality gaps undermining algorithms
- 4.3.4 Workforce skill shortage in AI/ML analytics
- 4.4 Supply-Chain Analysis
- 4.5 Regulatory Landscape
- 4.6 Technological Outlook
- 4.7 Porter's Five Forces
- 4.7.1 Bargaining Power of Suppliers
- 4.7.2 Bargaining Power of Buyers
- 4.7.3 Threat of New Entrants
- 4.7.4 Threat of Substitutes
- 4.7.5 Intensity of Competitive Rivalry
5 Market Size & Growth Forecasts
- 5.1 By Type
- 5.1.1 Stand-alone
- 5.1.2 Integrated
- 5.2 By Component
- 5.2.1 Software
- 5.2.2 Services
- 5.3 By Deployment Mode
- 5.3.1 On-premise
- 5.3.2 Cloud
- 5.4 By Application
- 5.4.1 Fault Location and Isolation
- 5.4.2 Restoration and Crew Management
- 5.4.3 Customer Information and Call Handling
- 5.5 By Geography
- 5.5.1 North America
- 5.5.1.1 United States
- 5.5.1.2 Canada
- 5.5.1.3 Mexico
- 5.5.2 Europe
- 5.5.2.1 Germany
- 5.5.2.2 United Kingdom
- 5.5.2.3 France
- 5.5.2.4 Italy
- 5.5.2.5 NORDIC Countries
- 5.5.2.6 Russia
- 5.5.2.7 Rest of Europe
- 5.5.3 Asia-Pacific
- 5.5.3.1 China
- 5.5.3.2 India
- 5.5.3.3 Japan
- 5.5.3.4 South Korea
- 5.5.3.5 ASEAN Countries
- 5.5.3.6 Rest of Asia-Pacific
- 5.5.4 South America
- 5.5.4.1 Brazil
- 5.5.4.2 Argentina
- 5.5.4.3 Rest of South America
- 5.5.5 Middle East and Africa
- 5.5.5.1 Saudi Arabia
- 5.5.5.2 United Arab Emirates
- 5.5.5.3 South Africa
- 5.5.5.4 Rest of Middle East and Africa
- 5.5.1 North America
6 Competitive Landscape
- 6.1 Market Concentration
- 6.2 Strategic Moves (M&A, Partnerships, PPAs)
- 6.3 Market Share Analysis (Market Rank/Share for key companies)
- 6.4 Company Profiles (includes Global level Overview, Market level overview, Core Segments, Financials as available, Strategic Information, Products & Services, and Recent Developments)
- 6.4.1 ABB Ltd.
- 6.4.2 General Electric Co.
- 6.4.3 Oracle Corp.
- 6.4.4 Schneider Electric SE
- 6.4.5 Siemens AG
- 6.4.6 Hitachi Energy (OMS)
- 6.4.7 Hexagon (Intergraph)
- 6.4.8 CGI Inc.
- 6.4.9 Advanced Control Systems (Indra/Minsait ACS)
- 6.4.10 Futura Systems Inc.
- 6.4.11 ETAP Automation
- 6.4.12 Survalent Technology
- 6.4.13 Landis+Gyr Group
- 6.4.14 Milsoft Utility Solutions
- 6.4.15 Trimble Utilities
- 6.4.16 OSIsoft (AVEVA)
- 6.4.17 IBM Corp.
- 6.4.18 Cisco Systems Inc.
- 6.4.19 Fujitsu Ltd.
- 6.4.20 S&C Electric Co.
- 6.4.21 Itron Inc.
7 Market Opportunities & Future Outlook
- 7.1 White-space & Unmet-need Assessment