|
시장보고서
상품코드
2116015
회수 폐지 시장 : 점유율 분석, 업계 동향과 통계, 성장 예측(2026-2031년)Recovered Paper - Market Share Analysis, Industry Trends & Statistics, Growth Forecasts (2026 - 2031) |
||||||
 Mordor Intelligence
회수 폐지 시장 규모는 2025년에 598억 1,000만 달러로 평가되었고 2026년 614억 8,000만 달러에서 2031년까지 705억 6,000만 달러에 이를 것으로 예측되며, 예측 기간(2026-2031년) CAGR은 2.79%를 나타낼 전망입니다.
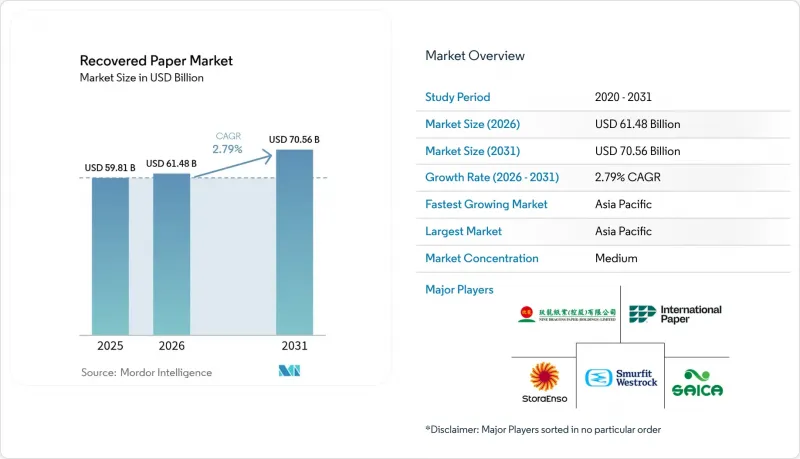
본 보고서는 종이 유형(사용 후 골판지 상자, 혼합지 등), 최종 이용 산업(포장·골판지 상자, 티슈·위생용품 등), 수거 원천(주거, 상업 및 산업 등), 처리 기술(잉크 제거 재활용, 비잉크 제거 재활용 등) 및 지역별로 분류되어 있습니다. 시장 예측은 금액(달러) 기준으로 제시되어 있습니다.
전 세계 회수 폐지 시장 동향 및 인사이트
전자상거래의 급속한 확장이 컨테이너보드 수요를 끌어올렸습니다.
2024년 전 세계 온라인 소매 업계의 소포 처리량은 153억 개에 달하여 전년 대비 12% 증가했습니다. 각 발송에는 최소한 하나의 골판지 상자가 필요하며, 이 상자들은 결국 재활용 흐름에 임베디드됩니다. 소포 밀도 증가는 회수 효율을 향상시키고, 회수 폐지 시장의 원료 공급 안정성을 높이고 있습니다. 현재 물류 센터에는 역물류용 도크가 설치되어 있으며, 사용된 골판지 상자를 현장에서 포장함으로써 불순물 혼입을 줄이고 트럭 운송 거리를 단축하고 있습니다. 실시간 판매 분석을 통해 골판지 가공업체는 주문 변동에 맞추어 생산 로트 수를 조정할 수 있어, 트리밍 폐기물을 최소화하고 계절에 관계없이 섬유 수요를 안정화할 수 있습니다. 또한, 대형 소매업체들은 매장 입구에서 고객으로부터 골판지 포장재를 회수하는 수거 프로그램에 자금을 지원함으로써, 도로변 수거에 그치지 않는 폭넓은 수거 체계를 구축하고 있습니다. 이러한 폐쇄형 순환 방식의 실천은 제지 공장으로의 재공급을 위한 예측 가능한 폐골판지(OCC) 흐름을 보장함으로써, 회수 폐지 시장의 기반을 공고히 하고 있습니다.
재활용 소재를 포함한 포장재에 대한 규제적 추진
유럽연합(EU)은 2030년까지 골판지의 85%, 기타 종이 포장재의 75%를 재활용하겠다는 법적 구속력이 있는 목표를 채택했습니다. 또한, 확대 생산자 책임(EPR) 제도에 따라 브랜드 소유자는 수거 및 처리 비용 전액을 부담하게 됩니다. 유사한 법안이 미국의 여러 주에서도 추진되고 있습니다. 이러한 의무화로 인해 재생 펄프 조달이 가속화되고 있으며, 독일, 스페인 및 미국 중서부에서 발표된 제지 공장 확장 프로젝트를 뒷받침하고 있습니다. 암코어(Amcor)와 같은 기업이 제공하는 블록체인 기반 추적 시스템은 펄프의 원산지, 베일 무게, 오염도를 기록하여 품목 단위로 규정 준수 여부를 확인합니다. 또한, 공시 의무 강화로 인해 최소 함유율 규정 하에서 수익 전망이 개선됨에 따라 재활용 인프라에 대한 투자자들의 관심도 높아지고 있습니다.
신문용지 및 사무용지 공급원의 축소
디지털 뉴스 플랫폼과 종이 없는 사무실의 보급으로 인해 고품질 펄프공급량이 감소하고 있습니다. 많은 대도시권의 일간지가 주말 한정 인쇄로 전환함에 따라, 2025년에는 수거 경로로 유입되는 폐신문의 톤수가 더욱 줄어들었습니다. 클라우드 스토리지의 보급 역시 사무용지 폐기량을 줄이고 있어, 기존에 고급 티슈에 사용되는 탈색 펄프의 원료가 되던 ‘선별된 사무용지’공급이 부족해지고 있습니다. 제지 회사는 저품질의 혼합지를 전용함으로써 이를 보완하고 있지만, 불순물 혼입으로 인해 표백제나 계면활성제의 소비량이 증가하여 가동 비용이 상승하고 있습니다. 일부 공장에서는 품질 저하를 보완하기 위해 근적외선을 이용한 사전 선별기를 도입하고 있지만, 설비 투자의 필요성이 중소 사업자 시장 진입을 가로막고 있어 시장 통합 압력을 강화하고 있습니다.
부문 분석
사용 후 골판지(OCC)는 2025년 매출의 42.14%를 차지하여, 회수 폐지 시장에서 그 중심적인 위치를 입증하고 있습니다. 높은 회수율, 낮은 잉크 함유량, 균일한 시트 구조 덕분에 효율적인 재펄프화가 가능하며, 이것이 골판지 원지의 비용 경쟁력을 이끌고 있습니다. OCC 유래 원지의 재생지 시장 규모는 전자상거래 소포 처리량에 연동하여 확대될 것으로 예상되며, 배송 허브에 도입된 스마트 베일러는 베일의 밀도를 높여 운송비를 절감하고 있습니다. 골판지 반환 크레딧을 제공하는 브랜드 프로그램은 성수기인 연말연시에도 OCC공급 안정성을 더욱 높이고 있습니다.
선별된 사무용지(SOP)는 2031년까지 연평균 성장률(CAGR)이 3.32%로 가장 빠르게 성장하는 등급입니다. 기업의 기록물 디지털화 캠페인으로 인해 기존 파일이 대량으로 폐기되면서 일시적으로 원료의 품질이 향상되고 있습니다. 탈잉크 플랜트에서는 SOP의 긴 섬유와 기계적 마모가 적은 특성이 고급 티슈의 인장 강도를 향상시키기 때문에 SOP를 선호하여 사용하고 있습니다. 이 기회를 활용하기 위해 사업자들은 기록 관리 업체와 회수 계약을 체결하여 섬유 공급을 확보하는 동시에 가격을 고정하고 있습니다. 혼합지는 품질 편차 문제에 직면해 있습니다. 광학 선별 시스템 도입으로 위험은 완화되지만, 이익률 하락은 여전히 지속되고 있습니다. 폐신문지 시장은 계속 위축되고 있으며, 제지 제조업체들은 셀룰로오스 단열재 등 특수 용도로의 전환을 추진하고 있습니다. 조지아 퍼시픽(Georgia-Pacific)사의 ‘Juno’ 시스템과 같은 첨단 펄프화 기술은 처리하기 어려운 품목에서 더 높은 부가가치를 창출하고, 혁신을 통해 활용 가능한 섬유 자원을 확대할 수 있음을 입증하고 있습니다.
2025년, 포장 및 골판지 상자는 식료품 배달 및 옴니채널 소매에서 발생하는 견조한 판지 수요에 힘입어 회수 폐지 시장 점유율의 57.72%를 차지했습니다. 생산자들은 상자 제조 시설에 인접하여 재활용 공장을 통합함으로써 운송 비용을 절감하는 동시에 탄소 발자국을 줄이고 있습니다. 포장과 관련된 회수 폐지 시장 규모는 플라스틱 복합재보다 단일 섬유 솔루션을 우선시하는 ‘재활용성을 고려한 설계(Design for Recyclability)’ 지침의 혜택도 받고 있습니다.
티슈 및 위생용품은 시장 규모는 작지만, 소비자들이 친환경 라벨이 부착된 화장지나 종이 타월을 선호함에 따라 2031년까지 연평균 성장률(CAGR) 3.71%로 가장 높은 성장세를 보이고 있습니다. SOP 유래 탈색 펄프는 밝기와 부드러움을 향상시켜 티슈 브랜드가 프리미엄 재생지 제품 라인을 판매할 수 있게 해줍니다. 인쇄 및 필기 용도는 계속해서 감소 추세를 보이고 있지만, 높은 수준의 보안이 요구되는 문서 분야는 가격 프리미엄이 적용되는 틈새 시장으로 유지되고 있습니다. 건설용 섬유 강화 패널 등 비종이 용도는 재생 소재 사용을 평가하는 LEED 크레딧에 힘입어 성장세를 보이고 있습니다.
지역별 분석
북미는 기술 도입의 중심지이며, 특히 미국에서는 제지 공장 현대화 프로젝트가 가장 집중되어 있습니다. 어빙 펄프 앤 페이퍼(Irving Pulp & Paper)사가 뉴브런즈윅주에서 진행 중인 8억 1,000만 달러 규모의 ‘NextGen’ 재건 프로젝트에서는 첨단 선별 기술과 폐쇄형 수처리 시스템이 도입되어 지역의 경쟁력이 강화되고 있습니다. 안정적인 회수 프로그램과 풍부한 창고 공간 덕분에 베일 집약이 효율적으로 이루어지고 있지만, 트럭 운전사 부족으로 인해 배송 비용의 변동성이 커지고 있습니다. 캐나다는 임업 분야의 전문 지식을 활용하여 티슈 제조업체에 표백 재생 펄프를 공급하고 있는 반면, 멕시코에서는 니어쇼어링의 급증으로 컨테이너 보드 수요가 증가함에 따라 회수 폐지(OCC) 수거 인프라 구축이 촉진되고 있습니다.
유럽에서는 엄격한 규제와 재활용 제도에 대한 소비자의 높은 참여율이 맞물려 세계 최고 수준의 회수율을 뒷받침하고 있습니다. 독일과 영국에서는 불순물을 조기에 감지하고 부적절한 재료를 분리하는 AI 지원형 MRF(분류 선별 시설)에 대한 투자가 진행되고 있습니다. 스트라 엔소(Stora Enso)의 2025년 구조조정에서는 쇠퇴하는 제지 사업 부문에서 섬유 기반 포장 사업으로 자본을 전환하고 있으며, 이는 수익성이 높은 틈새 시장으로의 전략적 전환을 보여줍니다. 내셔널 그린 딜(National Green Deal)에 의한 자금 지원으로 분리수거 시스템의 업그레이드 및 폐수 처리 시설의 개보수가 더욱 장려되고 있습니다. 남유럽 각 지역에서는 종이 음료 용기에 대한 보증금 반환 제도를 도입하여 회수율 격차 해소를 추진하고 있습니다.
아시아태평양은 수출용 포장에 사용되는 골판지 원지에 대한 중국 수요에 힘입어 여전히 처리량의 중심지 역할을 하고 있습니다. 수입 규제로 인해 국내 제지 회사들은 현지에서 섬유를 조달해야만 하는 상황에 놓여, 베트남, 태국, 말레이시아에서 2차 가공 거점을 확대되고 있습니다. 호치민시 근교에 위치한 Q P Group의 공장은 과거 중국으로 재수출되던 혼합지를 회수하고 있어, 이 지역의 성장세를 보여주고 있습니다. 일본은 계속해서 탈색 효율화 분야의 선구자 역할을 수행하고 있는 반면, 호주의 주 정부는 증가하는 주택에서 발생하는 원료에 대응하기 위해 가구별 수거 시스템 구축에 자금을 지원하고 있습니다. 섬나라나 내륙 지역의 각 주에서 물류 비용은 여전히 제약 요인으로 작용하고 있지만, 디지털 화물 플랫폼이 귀로 운송 능력을 통합하기 시작하면서 운임 급등을 완화하고 있습니다.
기타 혜택:
- 엑셀 형식 시장 예측(ME) 시트
- 3개월간의 애널리스트 지원
자주 묻는 질문
목차
제1장 서론
제2장 조사 방법
제3장 주요 요약
제4장 시장 구도
제5장 시장 규모와 성장 예측
제6장 경쟁 구도
제7장 시장 기회와 향후 전망
JHS 26.09.03According to Mordor Intelligence, the recovered paper market size was valued at USD 59.81 billion in 2025 and estimated to grow from USD 61.48 billion in 2026 to reach USD 70.56 billion by 2031, at a CAGR of 2.79% during the forecast period (2026-2031).
This report is Segmented by Paper Grade (Old Corrugated Containers, Mixed Paper, and More), End-Use Industry (Packaging and Corrugated Boxes, Tissue and Sanitary, and More), Source of Collection (Residential, Commercial and Industrial, and More), Processing Technology (De-Inking Lines, Non-De-Inked Recycling, and More), and Geography. The Market Forecasts are Provided in Terms of Value (USD).
Global Recovered Paper Market Trends and Insights
E-commerce Surge Boosting Containerboard Demand
Global online retail fulfilled 15.3 billion parcels in 2024, up 12% year on year, and each shipment required at least one corrugated box that ultimately enters the recycling stream. High parcel density improves collection efficiency and strengthens the recovered paper market's feedstock security. Distribution centers now embed reverse-logistics docks that bale used boxes on-site, reducing contamination and trucking miles. Real-time sales analytics allow box converters to align run lengths with order volatility, minimizing trim waste and stabilizing fiber demand across seasons. Large retailers also fund take-back programs that gather corrugated packaging from customers at store entrances, widening the capture funnel beyond curbside pickups. These closed-loop practices anchor the recovered paper market by guaranteeing predictable OCC flows for mill re-feeds.
Regulatory Push for Recycled-Content Packaging
The European Union has adopted a binding target that 85% of corrugated cardboard and 75% of other paper packaging be recycled by 2030, while extended producer responsibility schemes make brand owners pay the full cost of collection and processing. Similar bills are advancing in several U.S. states. These obligations accelerate procurement of recycled fiber, underpinning mill expansion projects announced across Germany, Spain and the Midwest United States. Blockchain-based tracking offered by companies such as Amcor records fiber origin, bale weights and contamination scores, thus confirming regulatory compliance at item level. Mandated disclosures also bolster investor appetite for recycling infrastructure because revenue visibility improves under minimum-content rules.
Shrinking Newsprint and Office-Paper Supply Pool
Digital news platforms and paperless offices are eroding high-grade fiber availability. With many metropolitan dailies switching to weekend-only print runs, tonnage of old newsprint entering recovery circuits declined further in 2025. Cloud storage adoption equally trims office-paper waste, tightening supply of Sorted Office Paper that historically fed de-inked pulp used in premium tissue. Mills compensate by diverting lower-grade mixed paper, yet contamination elevates bleach and surfactant consumption, raising operating costs. Some plants add near-infrared pre-sorters to offset quality loss, but capital needs deter smaller operators, amplifying market consolidation pressure.
Other drivers and restraints analyzed in the detailed report include:
- AI-Enabled Optical Sorting Improving Yield
- Scope-3 Decarbonization Targets of Brand Owners
- Logistics-Driven Fiber-Price Volatility
For complete list of drivers and restraints, kindly check the Table Of Contents.
Segment Analysis
Old Corrugated Containers contributed 42.14% of 2025 revenue, confirming their centrality to the recovered paper market. High collection rates, low ink loads and uniform sheet structure allow efficient re-pulping, driving cost leadership in containerboard furnish. The recovered paper market size for OCC-sourced furnish is projected to rise in line with e-commerce parcel volumes, while smart balers installed at distribution hubs enhance bale density and lower freight spend. Brand programs that offer box-return credits further stabilize OCC availability across holiday peaks.
Sorted Office Paper represents the fastest-expanding grade with a 3.32% CAGR to 2031. Corporate archive digitization campaigns yield large purges of legacy files, temporarily boosting feedstock quality. De-inking plants prefer SOP because its long fibers and limited mechanical wear improve tensile strength in premium tissue. To capitalize, operators sign takeback contracts with records-management providers that guarantee fiber flow and lock in pricing. Mixed Paper faces quality variability; optical sort upgrades mitigate risk, yet margin dilution persists. Old Newsprint continues to contract, encouraging mills to pivot toward specialty uses such as cellulose insulation. Advanced pulping technologies like Georgia-Pacific's Juno system unlock higher value from difficult grades, demonstrating that innovation can extend usable fiber pools.
Packaging and corrugated boxes held 57.72% of the recovered paper market share in 2025, anchored by robust cartonboard demand from grocery delivery and omnichannel retail. Producers integrate recycling plants adjacent to box-making units, shaving transport cost and reducing carbon footprints. The recovered paper market size tied to packaging also benefits from design-for-recyclability guidelines that favor mono-fiber solutions over plastic composites.
Tissue and sanitary products, though smaller in base, register the highest 3.71% CAGR through 2031 as consumers favor eco-labeled toilet tissue and paper towels. De-inked pulp from SOP improves brightness and softness, allowing tissue brands to market premium recycled lines. Printing and writing uses continue to slide, yet high-security documents sustain a niche that commands price premiums. Non-paper applications such as fiber-reinforced panels for construction collect momentum, underpinned by LEED credits that reward recycled content.
Complete Report Scope:
- By Paper Grade
- Old Corrugated Containers (OCC)
- Mixed Paper (MWP)
- Old Newsprint (ONP)
- Sorted Office Paper (SOP)
- Other Paper Grades
- By End-use Industry
- Packaging and Corrugated Boxes
- Tissue and Sanitary
- Printing and Writing
- Newsprint and Publishing
- Other End-use Industries
- By Source of Collection
- Residential
- Commercial and Industrial
- Institutional
- Retail and E-commerce Returns
- By Processing Technology
- De-inking Lines
- Non-de-inked Recycling
- Advanced High-Consistency Pulping
- Chemical-assisted Recycling
- By Geography
- North America
- United States
- Canada
- Mexico
- South America
- Brazil
- Argentina
- Chile
- Rest of South America
- Europe
- United Kingdom
- Germany
- France
- Spain
- Italy
- Rest of Europe
- Asia-Pacific
- China
- India
- Japan
- Australia
- South Korea
- Vietnam
- Rest of Asia-Pacific
- Middle East and Africa
- Middle East
- Saudi Arabia
- United Arab Emirates
- Turkey
- Rest of Middle East
- Africa
- South Africa
- Nigeria
- Egypt
- Rest of Africa
- Middle East
- North America
Geography Analysis
North America anchors technology deployment, with the United States hosting the largest cluster of mill modernization projects. Irving Pulp and Paper's USD 810 million NextGen rebuild in New Brunswick adds advanced screening and closed-loop water treatment, reinforcing regional competitiveness. Stable collection programs and abundant warehouse space enable efficient bale aggregation, yet trucking shortages raise delivered-cost volatility. Canada leverages forestry expertise to supply bleached recycled pulp to tissue converters, whereas Mexico's near-shoring surge lifts containerboard demand and stimulates OCC recovery infrastructure.
Europe combines rigorous regulation with high consumer participation in recycling schemes, underpinning one of the world's highest recovery rates. Germany and the United Kingdom invest in AI-assisted MRFs that flag contaminants early and divert unsuitable material. Stora Enso's 2025 reorganization channels capital toward fiber-based packaging and away from declining paper segments, illustrating a strategic pivot to higher-margin niches. National Green Deal funding further subsidizes sorting upgrades and effluent-treatment retrofits. Regions in Southern Europe push to close collection gaps by adding deposit-return schemes for paper beverage cartons.
Asia-Pacific remains the volume heavyweight, driven by China's demand for containerboard used in export packaging. Import curbs pushed domestic mills to source fiber locally and to expand secondary processing hubs in Vietnam, Thailand and Malaysia. Q P Group's plant near Ho Chi Minh City demonstrates regional momentum, capturing mixed paper once re-exported to China. Japan continues to pioneer de-inking efficiencies, while Australia's state governments fund curbside upgrades to handle rising residential feedstock. Logistics costs across archipelagic nations and inland provinces remain a restraint, but digital freight platforms start to pool backhaul capacity, easing rate spikes.
- Nine Dragons Paper (Holdings) Limited
- Smurfit WestRock
- International Paper Company
- Stora Enso Oyj
- S.A. Industrias Celulosa Aragonesa S.A. (SAICA)
- Tay Paper Recycling Pte. Ltd.
- Visy Industries Holdings Pty Ltd.
- Oji Holdings Corporation
- Cascades Inc.
- Packaging Corporation of America
- Lee & Man Paper Manufacturing Limited
- Mondi plc
- Pratt Industries Inc.
- UPM-Kymmene Corporation
- Klabin S.A.
- Nippon Paper Industries Co., Ltd.
- Resolute Forest Products Inc.
- Georgia-Pacific LLC
Additional Benefits:
- The market estimate (ME) sheet in Excel format
- 3 months of analyst support
TABLE OF CONTENTS
1 INTRODUCTION
- 1.1 Study Assumptions and Market Definition
- 1.2 Scope of the Study
2 RESEARCH METHODOLOGY
3 EXECUTIVE SUMMARY
4 MARKET LANDSCAPE
- 4.1 Market Overview
- 4.2 Market Drivers
- 4.2.1 E-commerce surge boosting containerboard demand
- 4.2.2 Regulatory push for recycled-content packaging
- 4.2.3 Cost advantage versus virgin pulp
- 4.2.4 AI-enabled optical sorting improving yield
- 4.2.5 Scope-3 decarbonization targets of brand owners
- 4.2.6 Export curbs on wastepaper spurring local investment
- 4.3 Market Restraints
- 4.3.1 Shrinking newsprint and office-paper supply pool
- 4.3.2 Logistics-driven fiber-price volatility
- 4.3.3 Composite-packaging contaminants
- 4.3.4 Stricter de-inking effluent norms
- 4.4 Industry Value Chain Analysis
- 4.5 Regulatory Landscape
- 4.6 Technological Outlook
- 4.7 Porter's Five Forces Analysis
- 4.7.1 Bargaining Power of Suppliers
- 4.7.2 Bargaining Power of Buyers
- 4.7.3 Threat of New Entrants
- 4.7.4 Threat of Substitutes
- 4.7.5 Intensity of Competitive Rivalry
- 4.8 The Impact of Macroeconomic Factors on the Market
5 MARKET SIZE AND GROWTH FORECASTS (VALUE)
- 5.1 By Paper Grade
- 5.1.1 Old Corrugated Containers (OCC)
- 5.1.2 Mixed Paper (MWP)
- 5.1.3 Old Newsprint (ONP)
- 5.1.4 Sorted Office Paper (SOP)
- 5.1.5 Other Paper Grades
- 5.2 By End-use Industry
- 5.2.1 Packaging and Corrugated Boxes
- 5.2.2 Tissue and Sanitary
- 5.2.3 Printing and Writing
- 5.2.4 Newsprint and Publishing
- 5.2.5 Other End-use Industries
- 5.3 By Source of Collection
- 5.3.1 Residential
- 5.3.2 Commercial and Industrial
- 5.3.3 Institutional
- 5.3.4 Retail and E-commerce Returns
- 5.4 By Processing Technology
- 5.4.1 De-inking Lines
- 5.4.2 Non-de-inked Recycling
- 5.4.3 Advanced High-Consistency Pulping
- 5.4.4 Chemical-assisted Recycling
- 5.5 By Geography
- 5.5.1 North America
- 5.5.1.1 United States
- 5.5.1.2 Canada
- 5.5.1.3 Mexico
- 5.5.2 South America
- 5.5.2.1 Brazil
- 5.5.2.2 Argentina
- 5.5.2.3 Chile
- 5.5.2.4 Rest of South America
- 5.5.3 Europe
- 5.5.3.1 United Kingdom
- 5.5.3.2 Germany
- 5.5.3.3 France
- 5.5.3.4 Spain
- 5.5.3.5 Italy
- 5.5.3.6 Rest of Europe
- 5.5.4 Asia-Pacific
- 5.5.4.1 China
- 5.5.4.2 India
- 5.5.4.3 Japan
- 5.5.4.4 Australia
- 5.5.4.5 South Korea
- 5.5.4.6 Vietnam
- 5.5.4.7 Rest of Asia-Pacific
- 5.5.5 Middle East and Africa
- 5.5.5.1 Middle East
- 5.5.5.1.1 Saudi Arabia
- 5.5.5.1.2 United Arab Emirates
- 5.5.5.1.3 Turkey
- 5.5.5.1.4 Rest of Middle East
- 5.5.5.2 Africa
- 5.5.5.2.1 South Africa
- 5.5.5.2.2 Nigeria
- 5.5.5.2.3 Egypt
- 5.5.5.2.4 Rest of Africa
- 5.5.5.1 Middle East
- 5.5.1 North America
6 COMPETITIVE LANDSCAPE
- 6.1 Market Concentration
- 6.2 Strategic Moves
- 6.3 Market Share Analysis
- 6.4 Company Profiles (includes Global Level Overview, Market Level Overview, Core Segments, Financials as available, Strategic Information, Market Rank/Share for key companies, Products and Services, and Recent Developments)
- 6.4.1 Nine Dragons Paper (Holdings) Limited
- 6.4.2 Smurfit WestRock
- 6.4.3 International Paper Company
- 6.4.4 Stora Enso Oyj
- 6.4.5 S.A. Industrias Celulosa Aragonesa S.A. (SAICA)
- 6.4.6 Tay Paper Recycling Pte. Ltd.
- 6.4.7 Visy Industries Holdings Pty Ltd.
- 6.4.8 Oji Holdings Corporation
- 6.4.9 Cascades Inc.
- 6.4.10 Packaging Corporation of America
- 6.4.11 Lee & Man Paper Manufacturing Limited
- 6.4.12 Mondi plc
- 6.4.13 Pratt Industries Inc.
- 6.4.14 UPM-Kymmene Corporation
- 6.4.15 Klabin S.A.
- 6.4.16 Nippon Paper Industries Co., Ltd.
- 6.4.17 Resolute Forest Products Inc.
- 6.4.18 Georgia-Pacific LLC
7 MARKET OPPORTUNITIES AND FUTURE OUTLOOK
- 7.1 White-space and Unmet-need Assessment