

|
시장보고서
상품코드
2116035
웹 성능 : 시장 점유율 분석, 업계 동향과 통계, 성장 예측(2026-2031년)Web Performance - Market Share Analysis, Industry Trends & Statistics, Growth Forecasts (2026 - 2031) |
||||||
 Mordor Intelligence
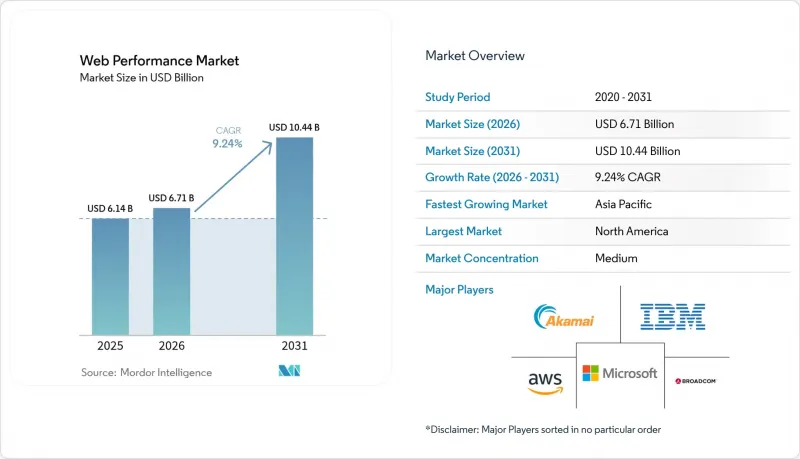
Mordor Intelligence에 따르면 2026년 웹 성능 시장 규모는 67억 1,000만 달러로 추정되며, 2025년 61억 4,000만 달러에서 확대되어 2031년에는 104억 4,000만 달러에 달할 것으로 예측됩니다.
2026년부터 2031년까지의 연평균 성장률(CAGR)은 9.24%가 될 것으로 전망됩니다.
본 보고서는 구성요소(소프트웨어 및 서비스), 도입 형태(온프레미스 및 클라우드), 모니터링 유형(합성 모니터링, 실제 사용자 모니터링(RUM), 디지털 경험/DEM 플랫폼), 조직 규모(대기업 및 중소기업(SME)), 최종사용자 산업(BFSI, IT·통신, 소매·E-Commerce 등), 그리고 지역별로 분류되어 있습니다.
세계 웹 성능 시장의 동향 및 인사이트
E-Commerce 트래픽 급증과 리치 미디어 도입
쇼핑 성수일에는 트래픽 급증으로 인해 인프라가 포화 상태에 이르러 잠재적인 성능상의 결함이 드러나고 있습니다. 2024년 블랙프라이데이에는 전 세계 온라인 매출이 8.5% 증가했으나, 페이지 로딩 시간이 지연 허용치를 초과함에 따라 많은 소매업체에서 전환율이 하락했습니다. 3D 상품 뷰어와 고해상도 이미지가 상품 판매의 표준 도구로 자리 잡으면서, 2024년 평균 페이지 크기는 35% 증가했습니다. Farfetch사의 조사에 따르면, ‘Largest Contentful Paint(LCP)’ 지연이 100밀리초 증가할 때마다 전환율이 1.3% 하락하는 반면, ‘Time to Interactive(TTI)’를 단축하면 전환율이 2.8% 향상되는 것으로 나타났습니다. 이처럼 수익에 미치는 영향이 정량화됨에 따라, 성능 개선 대책은 단순한 기술적 유지 관리 업무에서 손익계산서(P&L)를 좌우하는 중요한 요소로 변모했습니다. 그 결과, 단순한 가동 시간뿐만 아니라 부하가 걸린 상태에서의 사용자 경험을 평가하는 세밀한 모니터링과 더불어, 가상 대기실, 트래픽 셰이핑, 자동 스케일링이 도입되기 시작했습니다.
코어 웹 바이탈 알고리즘에 의한 압박
구글은 2024년 3월, ‘First Input Delay(최초 입력 지연)’를 ‘Interaction to Next Paint(INP)’로 대체하고, 순위에서 경쟁력을 유지하기 위해서는 최악의 경우 상호작용 지연을 200밀리초 미만으로 억제할 것을 사이트에 의무화했습니다. 이 지표의 광범위한 적용 범위로 인해 다양한 사용자 여정에 걸친 실제 사용자 상호작용 측정이 요구되며, 기업들은 기본적인 합성 테스트에서 RUM(실제 사용자 모니터링), 트레이스, 애널리틱스를 통합한 플랫폼으로의 업그레이드를 서둘러야 하는 상황에 놓여 있습니다. Safari와 Firefox가 2025년에 INP와 LCP를 지원하게 됨에 따라 Chrome에 대한 편중 현상이 해소되고, 그동안 크로스 브라우저 평균값에 가려져 있던 응답성 격차가 드러나게 될 것입니다. UX 점수는 고객 확보 비용과 직결되기 때문에 은행과 보험사는 신속하게 대응하고 있습니다. 저속 네트워크 환경을 시뮬레이션하는 선제적인 합성 테스트는 더 이상 선택적 최적화 수단이 아니라, 규정 준수 도구로서 예산이 편성되고 있습니다.
엔터프라이즈급 플랫폼의 가격 책정
데이터 수집 기반의 가격 모델이 호스트 단위 라이선스를 대체하게 되면, 가시성 관련 비용이 클라우드 지출의 15-20%를 차지할 가능성이 있습니다. 중소기업은 필요하지 않을 수도 있는 AI나 보안 모듈이 번들로 제공되는 최소 사용량 계약을 체결하는 것을 주저하고 있습니다. OpenTelemetry 파이프라인을 통해 벤더 종속성은 완화되지만, 자체 유지보수로 인해 절감된 라이선스 비용이 상쇄되고 맙니다. 벤더 통합으로 인해 가격 결정권이 더욱 집중됨에 따라, 구매자들은 비용을 예측 가능하게 유지하기 위해 데이터 계층 상한선 협상이나 샘플링 도입을 추진하고 있습니다. 조직이 텔레메트리 세분화 수준을 비즈니스 가치와 일치시켜 나감에 따라, 커뮤니티에서 호스팅하는 수집기 및 계층화된 저장 정책은 이제 FinOps 툴킷의 일부가 되었습니다.
부문 분석
2025년 웹 성능 시장에서 소프트웨어 부문은 64.80%를 차지하며, 기업들이 합성, RUM, 트레이싱을 단일 콘솔로 통합하는 통합 툴체인을 선호하는 경향이 두드러졌습니다. 한편, 인력 부족에 직면한 조직들이 설정, 알림 조정, 대시보드 유지 관리를 외부에 위탁하는 경향이 강해짐에 따라 서비스 부문은 연평균 성장률(CAGR) 10.52%로 성장하고 있습니다. 이러한 상반된 추세는 구매자들이 도구와 전문 지식을 대체 가능한 것이 아니라 서로를 보완하는 것으로 인식하기 시작했음을 보여줍니다.
클라우드 전환에 따라 컨테이너 오케스트레이션, 엣지 애널리틱스, 데이터 파이프라인 거버넌스 분야의 기술 격차가 드러나면서 매니지드 서비스에 대한 수요가 가속화되었습니다. 연중무휴 24시간 SRE 지원과 최적화 플레이북을 결합한 제공업체들은 플랫폼의 ROI를 극대화하기 위해 현재 자문 서비스를 패키지로 제공하고 있습니다. 그 결과, 소프트웨어 벤더들은 노코드 온보딩 마법사나 AI 기반 설정 기능을 통합하는 동시에 컨설팅 부서를 사내에 통합하고 있으며, 이는 웹 성능 시장 전체의 가치 제안을 재정의하는 융합의 조짐을 보여줍니다.
2025년, 규제 대상 산업이 텔레메트리 데이터를 자국의 데이터센터 근처에 계속 보관함에 따라 온프레미스 환경은 웹 성능 시장 점유율의 67.30%를 유지했습니다. 그러나 기능의 신속한 제공과 운영 비용(OPEX)의 유연성을 원동력으로 클라우드 도입은 연평균 성장률(CAGR) 10.84%로 확대되고 있습니다. 하이브리드 토폴로지는 기밀성이 높은 온프레미스 워크로드와 클라우드 분석을 융합하여, 데이터 거주법을 준수하면서도 머신 러닝을 활용한 인사이트를 도출하고 있습니다.
엣지 컴퓨팅은 이러한 추세를 더욱 가속화하고 있습니다. 지역 POP에서 수집된 텔레메트리 데이터는 클라우드의 AI 엔진으로 유입되어, 이상 현상을 몇 초 만에 분류합니다. 이에 따라 금융 서비스 및 게임 기업들은 수집기가 워크로드와 함께 이동하는 ‘어디서나 모니터링 가능’한 아키텍처를 시범 도입하고 있습니다. 벤더의 로드맵에서는 온프레미스와 SaaS의 경직된 이분법이 아닌, 원활한 데이터 플레인의 이식성이 중시되고 있는 만큼, 하이브리드 모니터링 플랫폼의 웹 성능 시장 규모는 확대될 것으로 예측됩니다.
지역별 분석
북미는 성숙한 클라우드 인프라, AI 주도형 가시성의 조기 도입, 그리고 가동 시간과 응답성을 입증하도록 의무화하는 엄격한 규정 준수 프레임워크 덕분에 2025년 매출의 38.90%를 차지했습니다. 미국의 금융 기관들은 지연 시간 허용 범위를 고객 경험 OKR에 반영하고 있으며, 캐나다의 의료 포털에서는 원격의료의 품질을 모니터링하기 위해 RUM을 환자 포털에 통합하고 있습니다. 멕시코의 제조 공장에서는 OT와 IT의 융합 스택에 측정 기능을 도입하기 시작했으며, 이는 지역 전체로 확산될 가능성을 시사합니다. SRE 인력의 만성적인 부족이 실행상의 위험 요인으로 작용하고 있지만, 벤처 자금을 통한 지속적인 도구 혁신이 이 지역의 성장 모멘텀을 유지하고 있습니다.
아시아태평양은 모바일 우선의 소비자 행동, 대규모 데이터센터에 대한 투자, 그리고 정부의 디지털화 프로그램에 힘입어 2031년까지 연평균 성장률(CAGR) 9.63%를 기록할 것으로 예상되는 가장 빠르게 성장하는 지역입니다. 중국의 대형 E-Commerce 기업들은 ‘싱글스 데이’ 기간 동안 초고속 결제를 유지하기 위해 모든 엣지 홉을 추적하고 있는 반면, 인도의 IT 아웃소싱 기업들은 전 세계 고객을 대상으로 멀티테넌트형 대시보드를 도입하고 있습니다. 일본과 한국은 5G를 활용한 저지연 가시성을 선도적으로 추진하고 있으며, 호주는 하이브리드 클라우드를 활용하여 대륙 간의 거리를 좁히고 있습니다. APAC 지역의 웹 성능 시장 규모는 세계 플랫폼을 보완하고, 언어 및 규정 준수 요건을 충족하는 솔루션을 제공하는 현지 벤더들의 존재 덕분에 혜택을 보고 있습니다.
유럽에서는 GDPR 시행과 지속가능성 관련 지침을 기반으로 꾸준한 확대가 나타나고 있습니다. 독일의 제조업체들은 생산 가동 중단 시간을 예측하기 위해 성능 데이터를 인더스트리 4.0 대시보드에 통합하고 있으며, 영국의 은행들은 INP 점수를 디지털 지점 평가에 반영하고 있습니다. 프랑스는 밀리초 단위의 지연이 공급망 전체에 파급되는 항공우주 분야의 텔레메트리에 주력하고 있습니다. EU에서 부상하고 있는 디지털 주권 정책은 지역 내 클라우드 노드를 촉진하고, 지역 내에서 데이터 처리를 보장하는 플랫폼에 대한 조달을 뒷받침하고 있습니다. 중동 및 아프리카는 뒤처져 있지만, UAE의 스마트 시티 프로젝트와 남아프리카공화국의 핀테크 확산 과정에서 신뢰성이 높고 지연 시간이 짧은 디지털 서비스에 대한 수요가 증가함에 따라 그 기세가 커지고 있습니다.
기타 혜택:
- 엑셀 형식의 시장 전망(ME) 시트
- 3개월간의 애널리스트 지원
자주 묻는 질문
목차
제1장 소개
제2장 조사 방법
제3장 주요 요약
제4장 시장 구도
제5장 시장 규모와 성장 예측
제6장 경쟁 구도
제7장 시장 기회와 향후 전망
KSM 26.08.26According to Mordor Intelligence, web performance market size in 2026 is estimated at USD 6.71 billion, growing from 2025 value of USD 6.14 billion with 2031 projections showing USD 10.44 billion, growing at 9.24% CAGR over 2026-2031.
This report is Segmented by Component (Software and Services), Deployment Type (On-Premises and Cloud), Monitoring Type (Synthetic Monitoring, Real-User Monitoring (RUM), and Digital Experience / DEM Platforms), Organization Size (Large Enterprises and Small and Medium Enterprises (SMEs)), End-User Industry (BFSI, IT and Telecom, Retail and E-Commerce, and More), and Geography.
Global Web Performance Market Trends and Insights
E-commerce Traffic Spike and Rich-Media Adoption
Peak shopping days now saturate infrastructure with traffic surges that reveal latent performance defects. During Black Friday 2024, global online revenue increased 8.5% yet many retailers saw conversion dips when page loads exceeded latency budgets. Average page weight climbed 35% in 2024 as 3D product viewers and high-resolution imagery became baseline merchandising tools. Farfetch observed that each 100 ms of Largest Contentful Paint delay suppressed conversion by 1.3%, whereas cutting Time to Interactive lifted conversions 2.8%. Such quantified revenue impact converts performance from a technical hygiene task into a PandL lever. Consequently, virtual waiting rooms, traffic shaping, and auto-scaling are deployed alongside granular monitoring that grades user experience under stress rather than simple uptime.
Core Web Vitals Algorithm Pressure
Google replaced First Input Delay with Interaction to Next Paint (INP) in March 2024, obliging sites to keep worst-case interaction latency below 200 ms to remain competitive in rankings. The metric's breadth forces instrumentation of real user interactions across varied journeys, prompting enterprises to upgrade from basic synthetics to platforms that stitch RUM, traces, and analytics. Safari and Firefox's 2025 support of INP and LCP will end the Chrome bias, exposing responsiveness gaps previously hidden in cross-browser averages. Banks and insurers have reacted swiftly because UX scores link directly to customer acquisition cost. Proactive synthetics that model slow-network scenarios are now budgeted as compliance tools rather than optional optimizations.
Enterprise-Grade Platform Pricing
Observability bills can devour 15-20% of cloud spend once data-ingestion pricing models replace per-host licenses. SMEs hesitate to commit to minimum volumes bundled with AI and security modules they may not need. Although OpenTelemetry pipelines reduce lock-in, DIY maintenance offsets licensing savings. Vendor consolidation further concentrates pricing power, prompting buyers to negotiate data-tier caps and adopt sampling to keep costs predictable. Community-hosted collectors and tiered retention policies are now part of FinOps toolkits as organizations align telemetry granularity with business value.
Other drivers and restraints analyzed in the detailed report include:
- Migration to Cloud-Native Architectures
- Mobile-First User Experience Expectations
- Legacy System Integration Complexity
For complete list of drivers and restraints, kindly check the Table Of Contents.
Segment Analysis
The software segment accounted for 64.80% of the web performance market in 2025, underscoring enterprises' preference for integrated toolchains that unify synthetics, RUM, and tracing into a single console. Services, however, are growing at a 10.52% CAGR as organizations outsource configuration, alert tuning, and dashboard maintenance in the face of talent shortages. This divergence illustrates how buyers increasingly view tooling and expertise as complementary rather than substitutable.
Demand for managed services accelerated when cloud migrations exposed skill gaps in container orchestration, edge analytics, and data pipeline governance. Providers offering 24X7 SRE coverage paired with optimization playbooks now bundle advisory engagements to maximize platform ROI. As a result, software vendors embed no-code onboarding wizards and AI-guided setup while simultaneously in-housing consulting arms, signaling a convergence that redefines value propositions across the web performance market.
On-premises instances retained 67.30% of web performance market share in 2025 because regulated industries keep telemetry close to sovereign data centers. Yet cloud deployments are scaling at an 10.84% CAGR, driven by feature velocity and OPEX flexibility. Hybrid topologies marry sensitive on-prem workloads with cloud analytics to comply with data-residency laws while unlocking machine-learning-powered insights.
Edge computing compounds this trend: telemetry captured at regional POPs flows into cloud AI engines that classify anomalies in seconds. Financial services and gaming companies thus pilot "observe-anywhere" architectures in which collectors migrate alongside workloads. The web performance market size for hybrid monitoring platforms is forecast to widen as vendor roadmaps emphasize seamless data plane portability rather than rigid dichotomies between on-prem and SaaS.
Complete Report Scope:
- By Component
- Software
- Services
- By Deployment Type
- On-premises
- Cloud
- By Monitoring Type
- Synthetic Monitoring
- Real-User Monitoring (RUM)
- Digital Experience / DEM Platforms
- By Organization Size
- Large Enterprises
- Small and Medium Enterprises (SMEs)
- By End-User Industry
- BFSI
- IT and Telecom
- Retail and E-commerce
- Automotive
- Government
- Other End-user Industries
- Geography
- North America
- United States
- Canada
- Mexico
- Europe
- Germany
- United Kingdom
- France
- Italy
- Spain
- Russia
- Rest of Europe
- Asia-Pacific
- China
- Japan
- India
- South Korea
- Australia and New Zealand
- Rest of Asia-Pacific
- South America
- Brazil
- Argentina
- Rest of South America
- Middle East and Africa
- Middle East
- Saudi Arabia
- United Arab Emirates
- Turkey
- Rest of Middle East
- Africa
- South Africa
- Nigeria
- Rest of Africa
- Middle East
- North America
Geography Analysis
North America captured 38.90% of 2025 revenue thanks to mature cloud infrastructure, early AI-driven observability adoption, and stringent compliance frameworks that mandate proof of uptime and responsiveness. United States financial institutions integrate latency budgets into customer-experience OKRs, while Canadian healthcare portals embed RUM in patient portals to monitor telemedicine quality. Mexico's manufacturing plants are beginning to instrument OT and IT convergence stacks, signaling wider regional uptake. Persistent SRE talent shortages pose execution risks, yet venture funding spurs continuous tooling innovation that sustains regional momentum.
Asia-Pacific is the fastest-growing territory with a 9.63% CAGR to 2031, propelled by mobile-first consumer behavior, large-scale data-center investments, and government digitalization programs. Chinese e-commerce giants trace every edge hop to maintain lightning-fast checkouts during Singles' Day, whereas Indian IT outsourcers deploy multi-tenant dashboards for global clients. Japan and South Korea pioneer 5G-enabled low-latency observability, while Australia leverages hybrid cloud to bridge continental distances. The web performance market size in APAC benefits from local vendors offering language and compliance-aligned solutions that complement global platforms.
Europe registers steady expansion anchored in GDPR enforcement and sustainability directives. German manufacturers embed performance data in Industry 4.0 dashboards to predict production downtimes, and UK banks tie INP scores to digital branch ratings. France focuses on aerospace telemetry where millisecond delays ripple through supply chains. Emerging EU digital sovereignty policies foster regional cloud nodes, shaping procurement toward platforms that guarantee in-region data processing. The Middle East and Africa trail but accelerate as UAE smart-city projects and South African fintech rollouts demand reliable, low-latency digital services.
- Akamai Technologies
- Dynatrace
- Cloudflare
- IBM
- F5
- Radware
- SolarWinds (Pingdom)
- New Relic
- Datadog
- Catchpoint
- ThousandEyes (Cisco)
- CDNetworks
- Netmagic (NTT)
- Fastly
- Broadcom (AppNeta)
- Site24x7 (Zoho)
- Uptrends
- Splunk
- Amazon CloudWatch
- Microsoft Azure Monitor
Additional Benefits:
- The market estimate (ME) sheet in Excel format
- 3 months of analyst support
TABLE OF CONTENTS
1 INTRODUCTION
- 1.1 Study Assumptions and Market Definition
- 1.2 Scope of the Study
2 RESEARCH METHODOLOGY
3 EXECUTIVE SUMMARY
4 MARKET LANDSCAPE
- 4.1 Market Overview
- 4.2 Market Drivers
- 4.2.1 E-commerce traffic spike and rich-media adoption
- 4.2.2 Core Web Vitals algorithm pressure
- 4.2.3 Migration to cloud-native architectures
- 4.2.4 Mobile-first user experience expectations
- 4.2.5 Edge and serverless rollout for sub-second latency
- 4.2.6 Sustainability-linked FinOps performance budgets
- 4.3 Market Restraints
- 4.3.1 Enterprise-grade platform pricing
- 4.3.2 Legacy system integration complexity
- 4.3.3 Browser privacy curbs limiting RUM data
- 4.3.4 Shortage of observability / SRE talent
- 4.4 Value Chain Analysis
- 4.5 Regulatory Landscape
- 4.6 Technological Outlook
- 4.7 Porter's Five Forces Analysis
- 4.7.1 Bargaining Power of Suppliers
- 4.7.2 Bargaining Power of Buyers
- 4.7.3 Threat of New Entrants
- 4.7.4 Threat of Substitutes
- 4.7.5 Intensity of Competitive Rivalry
- 4.8 Assessment of the Impact of Macroeconomic Trends on the Market
5 MARKET SIZE AND GROWTH FORECASTS (VALUE)
- 5.1 By Component
- 5.1.1 Software
- 5.1.2 Services
- 5.2 By Deployment Type
- 5.2.1 On-premises
- 5.2.2 Cloud
- 5.3 By Monitoring Type
- 5.3.1 Synthetic Monitoring
- 5.3.2 Real-User Monitoring (RUM)
- 5.3.3 Digital Experience / DEM Platforms
- 5.4 By Organization Size
- 5.4.1 Large Enterprises
- 5.4.2 Small and Medium Enterprises (SMEs)
- 5.5 By End-User Industry
- 5.5.1 BFSI
- 5.5.2 IT and Telecom
- 5.5.3 Retail and E-commerce
- 5.5.4 Automotive
- 5.5.5 Government
- 5.5.6 Other End-user Industries
- 5.6 Geography
- 5.6.1 North America
- 5.6.1.1 United States
- 5.6.1.2 Canada
- 5.6.1.3 Mexico
- 5.6.2 Europe
- 5.6.2.1 Germany
- 5.6.2.2 United Kingdom
- 5.6.2.3 France
- 5.6.2.4 Italy
- 5.6.2.5 Spain
- 5.6.2.6 Russia
- 5.6.2.7 Rest of Europe
- 5.6.3 Asia-Pacific
- 5.6.3.1 China
- 5.6.3.2 Japan
- 5.6.3.3 India
- 5.6.3.4 South Korea
- 5.6.3.5 Australia and New Zealand
- 5.6.3.6 Rest of Asia-Pacific
- 5.6.4 South America
- 5.6.4.1 Brazil
- 5.6.4.2 Argentina
- 5.6.4.3 Rest of South America
- 5.6.5 Middle East and Africa
- 5.6.5.1 Middle East
- 5.6.5.1.1 Saudi Arabia
- 5.6.5.1.2 United Arab Emirates
- 5.6.5.1.3 Turkey
- 5.6.5.1.4 Rest of Middle East
- 5.6.5.2 Africa
- 5.6.5.2.1 South Africa
- 5.6.5.2.2 Nigeria
- 5.6.5.2.3 Rest of Africa
- 5.6.5.1 Middle East
- 5.6.1 North America
6 COMPETITIVE LANDSCAPE
- 6.1 Market Concentration
- 6.2 Strategic Moves
- 6.3 Market Share Analysis
- 6.4 Company Profiles (includes Global level Overview, Market level overview, Core Segments, Financials as available, Strategic Information, Market Rank/Share for key companies, Products and Services, and Recent Developments)
- 6.4.1 Akamai Technologies
- 6.4.2 Dynatrace
- 6.4.3 Cloudflare
- 6.4.4 IBM
- 6.4.5 F5
- 6.4.6 Radware
- 6.4.7 SolarWinds (Pingdom)
- 6.4.8 New Relic
- 6.4.9 Datadog
- 6.4.10 Catchpoint
- 6.4.11 ThousandEyes (Cisco)
- 6.4.12 CDNetworks
- 6.4.13 Netmagic (NTT)
- 6.4.14 Fastly
- 6.4.15 Broadcom (AppNeta)
- 6.4.16 Site24x7 (Zoho)
- 6.4.17 Uptrends
- 6.4.18 Splunk
- 6.4.19 Amazon CloudWatch
- 6.4.20 Microsoft Azure Monitor
7 MARKET OPPORTUNITIES AND FUTURE OUTLOOK
- 7.1 White-space and Unmet-need Assessment


