

|
시장보고서
상품코드
2116047
스마트 파워 : 시장 점유율 분석, 업계 동향과 통계, 성장 예측(2026-2031년)Smart Power - Market Share Analysis, Industry Trends & Statistics, Growth Forecasts (2026 - 2031) |
||||||
 Mordor Intelligence
Mordor Intelligence에 따르면 스마트 파워 시장 규모는 2025년 1,882억 8,000만 달러에서 2026년에는 2,088억 5,000만 달러로 확대되고, 2026년부터 2031년까지 CAGR 10.92%를 기록하며 2031년에는 3,506억 5,000만 달러에 달할 것으로 예측됩니다.
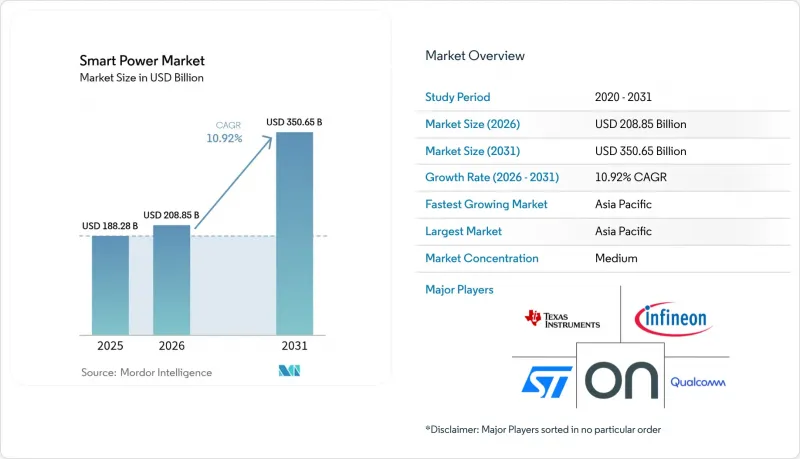
본 보고서는 제품별(무선 충전기, 에너지 관리 시스템), 기술별(유도/자기 공명,고주파/적외선 등), 용도별(소비자용 전자기기, 자동차 및 E-모빌리티 등), 최종사용자별(OEM/기기 제조사 등), 파워 디바이스 유형별(전력 관리 IC 등), 및 지역별로 분류되어 있습니다. 시장 예측은 금액(달러) 기준으로 제시되어 있습니다.
세계 스마트 파워 시장의 동향 및 인사이트
소비자용 전자기기에서의 무선 충전 보급 확대
2024년 초 Qi2 인증을 통해 자기 위치 편차로 인한 손실이 5% 미만으로 감소했습니다. 이 획기적인 성과로 태블릿 및 노트북용 15와트 유도식 충전 패드의 상용화가 가능해졌습니다. 애플과 삼성은 2024년에 Qi2 지원 스마트폰을 2억 5,000만 대 이상 출하하며, 40억 달러 규모의 액세서리 생태계를 주도했습니다. 자동차 제조사들도 이에 발맞춰 케이블 마모를 억제하고 고급스러운 인테리어를 돋보이게 하는 차량용 충전 패드를 도입하고 있습니다. 각 호텔 그룹은 편의성 향상과 유지보수 비용 절감을 위해 2026년까지 약 50만 개의 객실에 Qi2 모듈을 탑재할 예정입니다. 유선 포트에서 무선으로의 전환은 산업용 IoT 기기에서 밀폐형·방수 설계의 채택을 촉진하고 있으며, 가혹한 환경 하의 해당 부문에서 장치 수요를 끌어올리고 있습니다.
5G 스마트폰 및 IoT 기기에서 전원 관리 IC의 보급
독립형 5G 네트워크에서는 기기당 전력 증폭기 수가 2배로 증가하여 PMIC의 다이 면적과 부가가치가 향상되고 있습니다. 2024년 하반기에 출하된 플래그십 칩셋에는 배터리 수명을 25% 연장하는 동적 전압 스케일링 기능이 탑재되어 있으며, 2025년에는 미드레인지 부문에서도 그 채택이 확대될 전망입니다. 2030년까지 300억 대에 달할 것으로 예상되는 IoT 에지 노드에서는 1마이크로암페어 미만의 절전 전류가 요구되므로, 반도체 제조사들은 나노와트급 컨버터 개발을 추진하고 있습니다. 인도는 PMIC 제조의 현지화에 20억 달러를 배정하여, 지역 휴대폰 브랜드를 위한 공급망을 단축하고 있습니다. 안전 규격 IEC 62368-1에서는 고장 보호에 관한 규정이 강화되어, 이에 따라 PMIC 내부에 통합되는 제어 기능이 증가하고, 부품표(BOM)의 총액이 증가하고 있습니다.
GaN 및 SiC와 같은 광대역 갭 소재의 높은 비용
2024년 현재, 직경 150mm SiC 웨이퍼의 가격은 1,500달러에 육박하고 있으며, 이는 동등한 실리콘 웨이퍼의 가격인 300달러와 현저한 대조를 이룹니다. 이로 인해 모듈의 이익률이 압박받고 있으며, 채택은 프리미엄 구동 시스템 및 산업용 카테고리로 제한되고 있습니다. 3개 업체가 잉곳 생산능력의 70% 이상을 장악하고 있으며, 수년에 걸친 공급 계약으로 인해 2027년까지 높은 가격이 고착화되어 있습니다. 200mm 기판에서 GaN 에피택시 수율은 85%에 그치고 있어, 주류 소비자용 비용 수준에서 요구되는 95%라는 목표에는 여전히 미치지 못하고 있으며, 그 결과 결함으로 인한 비용 증가가 발생하여 각 브랜드는 결국 그 비용을 소비자에게 전가하게 됩니다. 재료비는 완성된 SiC MOSFET 비용의 40-50%를 차지하고 있으며, 결정 성장 기술에 획기적인 진전이 없는 한 대폭적인 가격 하락은 제한적일 것입니다. 12-18개월이라는 리드타임으로 인해 자동차 제조사는 실리콘 및 SiC 인버터의 조달처를 2개사로 분산할 수밖에 없어, 대량 조달에 따른 비용 절감 효과가 약화되고 있습니다.
부문 분석
2025년, 무선 충전기는 8억 개가 넘는 액세서리 출하에 힘입어 스마트 파워 시장 규모의 42.55%를 차지했습니다. 에너지 관리 시스템은 가정에서의 시간대별 요금 최적화 및 상업용 빌딩에서의 수요 반응 자동화를 활용하여 2031년까지 연평균 성장률(CAGR) 12.05%로 시장을 주도할 것으로 예측됩니다. 캘리포니아주와 텍사스주의 전력 회사는 피크 부하 감축에 대해 보상을 제공하는 유연성 프로그램의 일환으로 2024년에 200만 대의 스마트 온도 조절기를 설치했습니다. 새로운 플랫폼에 통합된 기계 학습 알고리즘을 통해 건물의 에너지 집약도를 최대 25%까지 절감할 수 있게 되어, 투자 회수 기간을 단축하는 동시에 지속적인 소프트웨어 수익을 창출하고 있습니다. 무선 충전 기능은 현재 호텔 및 사무실용 가구에 통합되고 있지만, 3년을 넘는 휴대전화 교체 주기로 인해 액세서리 재주문량이 제한되고 있습니다.
현재 진행 중인 옥상 태양광발전 붐으로 인해, 배터리를 가상발전소(VPP)에 통합하는 지능형 인버터 및 컨트롤러에 대한 수요가 가속화되고 있습니다. 2024년, 미국 내 주거용 태양광발전 및 에너지 저장 시스템 도입 건수는 50만 대를 넘어설 전망이며, 각 시스템에는 발전, 에너지 저장 및 유연한 부하를 조정하는 멀티포트 에너지 허브가 필요합니다. 기업들은 ISO 50001 인증 획득을 추구하고 있으며, 세밀한 모니터링과 자동 고장 감지 기능을 제공하는 시스템의 조달을 촉진하고 있습니다. 무선 충전기는 스마트폰에서 2-in-1 노트북 및 휴대용 게임기로 보급 범위를 넓히고 있지만, 프리미엄 스마트폰 시장의 포화 상태로 인해 에너지 관리 시스템 도입에 비해 성장 속도는 완만해질 것으로 예상됩니다.
2025년 매출액 중 유도 충전 및 자기 공명 기술이 54.60%를 차지했습니다. 이는 주로 플래그십 스마트폰에 Qi2가 채택된 데 기인합니다. 그럼에도 불구하고, 와이드 밴드갭 파워 일렉트로닉스는 연평균 성장률(CAGR) 14.10%를 기록할 것으로 예상되며, 기술 분야 중 가장 높은 성장률을 보이고 있습니다. SiC 모듈은 현재 신규 800V EV 플랫폼의 60% 이상에 채택되어 있으며, 효율 향상으로 인해 배터리 소형화와 주행 거리 연장으로 이어지고 있습니다. GaN 트랜지스터는 실리콘 기반 제품보다 40% 더 가벼운 100와트 USB-C 충전기에 채택되어, 액세서리 업계의 주요 제조사들로부터의 채택을 확고히 하고 있습니다. 데이터센터 운영사들은 48V 서버 랙을 위한 GaN 파워 스테이지 테스트를 진행 중이며, 98%의 변환 효율을 목표로 하고 있습니다. 이를 통해 냉각 부하를 대폭 줄일 수 있을 것으로 보입니다.
고주파 및 적외선을 이용한 무선 전력 전송은 여전히 틈새 분야에 머물러 있으며, 시장 점유율은 5% 미만으로 자산 추적이나 의료용 임플란트에 대한 활용으로 제한되어 있습니다. 그러나 2024년에 처음으로 획득된 1와트 무선 전력 전송 인증은 소매점 간판이나 창고용 센서로의 응용 기회가 확대될 것임을 시사합니다. 근거리 충전 분야에서는 코일 결합 효율이 85%를 초과하고 금속 재질의 기기 케이스에도 대응할 수 있기 때문에 유도식 패드가 여전히 주류를 차지하고 있습니다. 그럼에도 불구하고, GaN 및 SiC를 통해 가능해진 스위칭 주파수의 향상으로 코일의 소형화가 진행되고 있으며, 그 결과 전자기 간섭이 억제되고 폼팩터의 유연성이 향상되고 있습니다.
지역별 분석
아시아태평양은 2025년 매출의 37.80%를 차지하며 연평균 성장률(CAGR) 12.25%로 성장하고 있으며, 이는 모든 지역 중 가장 높은 성장률입니다. 중국에서는 같은 해 900만 대 이상의 배터리식 전기자동차가 생산되었으며, 각 차량에는 SiC 인버터와 GaN 충전기가 탑재되었습니다. 인도의 ‘생산 연계 인센티브(PLI)’ 제도에 따라 2024년 전자제품 생산액은 1,150억 달러에 달했으며, 이는 수입 의존도를 낮추는 국내 PMIC 제조 공장을 뒷받침했습니다. 일본은 재생에너지 발전 용량을 8기가와트 증설하여, 옥상 태양광발전과 전력 계통의 신호를 동기화하는 400만 대의 주택용 에너지 시스템에 대한 수요를 창출했습니다. 한국의 반도체 제조 장비 수출액은 200억 달러를 넘어섰으며, 이는 이종 PMIC 및 프로세서의 첨단 패키징에 대한 설비 투자를 반영한 것입니다.
북미와 유럽은 각각 약 25%의 점유율을 차지했습니다. 미국에서는 ‘인플레이션 억제법(Inflation Reduction Act)’에 따른 7,500달러의 전기자동차 세액 공제로 인해 SiC 구동 시스템을 탑재한 모델의 판매가 가속화되었습니다. 전력 회사는 2024년에 10기가와트시의 그리드 규모 배터리 저장 시스템을 설치했으며, 각 시스템에는 SiC 파워 스테이지를 탑재한 수 메가와트급 인버터가 사용되고 있습니다. 유럽의 ‘REPowerEU’에서는 2028년까지 배전망의 디지털화를 위해 430억 유로(470억 달러)를 책정하고 있습니다. 2025년부터 시행되는 ‘건축물의 에너지 성능에 관한 지침’에서는 신축 건물에 통합 관리 시스템을 촉진하는 스마트 대응 지표가 의무화되어 있습니다.
중동 및 아프리카의 기여도는 10% 미만에 그치고 있지만, 특히 걸프협력회의(GCC) 국가들의 스마트 계량기 도입이나, 첨단 계통 지원용 인버터가 필요한 남아프리카공화국의 재생에너지 입찰 등에서 국지적으로 높은 성장이 나타나고 있습니다. 라틴아메리카는 여전히 새로운 기회를 내포하고 있으며, 브라질과 멕시코에서는 시간대별 요금제나 에너지 관리 시스템 도입을 촉진하는 전력 회사 주도의 옥상 태양광발전 크레딧이 검토되고 있습니다. 이 지역에서는 첨단 반도체 제조가 제한적이지만, 분산형 재생에너지에 대한 정책적 인센티브가 스마트 전력 하드웨어 및 소프트웨어의 다운스트림 수요를 창출하고 있습니다.
기타 혜택:
- 엑셀 형식의 시장 예측(ME) 시트
- 3개월간의 애널리스트 지원
자주 묻는 질문
목차
제1장 소개
제2장 조사 방법
제3장 주요 요약
제4장 시장 구도
제5장 시장 규모와 성장 예측
제6장 경쟁 구도
제7장 시장 기회와 향후 전망
KSM 26.08.26According to Mordor Intelligence, the smart power market size is expected to grow from USD 188.28 billion in 2025 to USD 208.85 billion in 2026 and is forecast to reach USD 350.65 billion by 2031 at 10.92% CAGR over 2026-2031.
This report is Segmented by Product (Wireless Chargers, Energy Management Systems), Technology (Inductive/Magnetic Resonance, Radio Frequency/Infrared, and More), Application (Consumer Electronics, Automotive and E-Mobility, and More), End User (OEMs/Device Manufacturers, and More), Power Device Type (Power Management ICs, and More), and Geography. The Market Forecasts are Provided in Terms of Value (USD).
Global Smart Power Market Trends and Insights
Rising Adoption of Wireless Charging in Consumer Electronics
Qi2 certification in early 2024 reduced magnetic misalignment losses below 5%, a milestone that made 15-watt inductive pads practical for tablets and laptops. Apple and Samsung shipped more than 250 million Qi2-enabled phones in 2024, catalyzing a USD 4 billion accessory ecosystem. Automakers followed, adding in-cab charging pads that curb cable wear and accent premium interiors. Hotel groups are embedding Qi2 modules in approximately half a million guest rooms by 2026 to enhance convenience and reduce maintenance costs. The switch away from wired ports also supports sealed, water-resistant designs for industrial IoT devices, boosting unit demand in harsh-environment segments.
Proliferation of Power Management ICs in 5G Smartphones and IoT Devices
Standalone 5G networks double the number of power amplifiers per phone, lifting PMIC die area and value content. Flagship chipsets that shipped in late 2024 incorporate dynamic voltage scaling, which saves 25% of battery life, driving adoption across mid-range tiers in 2025. IoT edge nodes, forecast to reach 30 billion units by 2030, require a sub-1-microamp sleep current, prompting semiconductor manufacturers to develop nanowatt converters. India earmarked USD 2 billion to localize PMIC fabrication, shortening supply chains for regional handset brands. Safety standard IEC 62368-1 tightens fault protection rules, sending more control functions inside the PMIC and raising the bill-of-materials value.
High Cost of Wide-Bandgap Materials Such as GaN and SiC
SiC wafers priced near USD 1,500 for 150-millimeter diameters in 2024 contrast sharply against USD 300 silicon equivalents, squeezing module margins and confining adoption to premium drivetrain and industrial categories. With three vendors controlling more than 70% of boule capacity, multi-year supply deals lock in elevated pricing through 2027. GaN epitaxy yields of 85% on 200-millimeter substrates still trail the 95% target for mainstream consumer cost points, resulting in defect premiums that brands ultimately pass on to consumers. Material costs form 40-50% of the finished SiC MOSFET expense, limiting large-scale price drops unless breakthroughs in crystal growth occur. Lead times of 12-18 months push automakers to dual-source silicon and SiC inverters, diluting volume leverage.
Other drivers and restraints analyzed in the detailed report include:
- Rapid Growth of Electric Vehicles Requiring High-Efficiency Power Electronics
- Government Incentives for Smart Grid Modernization
- Interoperability and Standards Fragmentation
For complete list of drivers and restraints, kindly check the Table Of Contents.
Segment Analysis
Wireless chargers held a 42.55% share of the smart power market size in 2025, driven by more than 800 million accessory shipments. Energy management systems are forecast to outpace at a 12.05% CAGR through 2031, leveraging time-of-use tariff optimization in homes and demand-response automation in commercial buildings. California and Texas utilities installed 2 million smart thermostats during 2024 under flexibility programs that reward peak-load curtailment. Machine-learning algorithms within new platforms can reduce building energy intensity by up to 25%, enhancing payback and generating recurring software revenue. Wireless charging is now being incorporated into furniture sold to hospitality and office clients, yet handset replacement cycles that stretch beyond three years temper accessory reorder volume.
The ongoing rooftop solar boom accelerates demand for intelligent inverters and controllers that integrate batteries into virtual power plants. Residential solar-plus-storage installs in the United States exceeded 500,000 units in 2024, each requiring multi-port energy hubs that orchestrate generation, storage, and flexible loads. Corporates pursue ISO 50001 certification, driving procurement of systems that deliver granular monitoring and automatic fault detection. Wireless chargers migrate beyond phones into two-in-one laptops and handheld gaming devices, but saturation in the premium smartphone tier suggests slower incremental growth compared with energy management rollouts.
Inductive and magnetic resonance technologies accounted for 54.60% of 2025 revenue, primarily due to the deployment of Qi2 across flagship smartphones. Still, wide-bandgap power electronics are expected to post a 14.10% CAGR, the fastest among technology buckets. SiC modules now feature in more than 60% of new 800-volt EV platforms, delivering efficiency gains that cascade into smaller batteries and longer driving range. GaN transistors power 100-watt USB-C chargers that are 40% lighter than silicon-based units, securing design slots with accessory leaders. Data-center operators are testing GaN power stages for 48-volt server racks, aiming for 98% conversion efficiency, which could significantly reduce the cooling load.
Radio frequency and infrared wireless power transfer remain niche, with a share under 5%, confined to asset tracking and medical implant use. Yet the first 1-watt over-the-air certification received in 2024 hints at expanded retail signage and warehouse sensor opportunities. Inductive pads retain dominance in near-field charging as coil coupling surpasses 85% and supports metal device housings. Nonetheless, the march toward higher switching frequencies enabled by GaN and SiC reduces coil dimensions, thereby curbing electromagnetic interference and enhancing form factor flexibility.
Complete Report Scope:
- By Product
- Wireless Chargers
- Energy Management Systems
- By Technology
- Inductive / Magnetic Resonance
- Radio Frequency / Infrared
- Wide-Bandgap Power Electronics (GaN, SiC)
- By Application
- Consumer Electronics
- Automotive and E-Mobility
- Industrial Automation
- Residential and Commercial Energy Management
- By End User
- OEMs / Device Manufacturers
- Utilities and Energy Service Companies
- Hospitality and Retail
- Government and Defense
- By Power Device Type
- Power Management ICs
- Smart Power Modules
- Discrete Wide-Bandgap Devices
- Switching Mode Power Supplies
- By Geography
- North America
- United States
- Canada
- Mexico
- South America
- Brazil
- Mexico
- Rest of South America
- Europe
- Germany
- United Kingdom
- France
- Spain
- Italy
- Rest of Europe
- Asia Pacific
- China
- India
- Japan
- Australia
- South Korea
- Rest of Asia Pacific
- Middle East and Africa
- Middle East
- Saudi Arabia
- United Arab Emirates
- Qatar
- Turkey
- Rest of Middle East
- Africa
- South Africa
- Nigeria
- Rest of Africa
- Middle East
- North America
Geography Analysis
The Asia Pacific region held 37.80% of 2025 revenue and is advancing at a 12.25% CAGR, the strongest among all regions. China produced more than 9 million battery electric vehicles that year, each loaded with SiC inverters and GaN chargers. India's Production Linked Incentive scheme propelled electronics output to USD 115 billion in 2024, supporting domestic PMIC fabs that reduce import reliance. Japan added 8 gigawatts of renewable capacity, sparking demand for 4 million residential energy systems that sync rooftop solar with grid signals. South Korea's semiconductor equipment exports surpassed USD 20 billion, reflecting capital outlays on advanced packaging of heterogeneous PMICs and processors.
North America and Europe each held a near 25% share. In the United States, the Inflation Reduction Act's USD 7,500 EV tax credit has accelerated sales of models featuring SiC drivetrains. Utilities installed 10 gigawatt-hours of grid-scale batteries in 2024, each using multi-megawatt inverters built on SiC power stages. Europe's REPowerEU has earmarked EUR 43 billion (USD 47 billion) for the digitization of distribution networks through 2028. The Energy Performance of Buildings Directive, effective from 2025, mandates smart readiness indicators that promote integrated management systems in new construction.
The Middle East and Africa contributed under 10% but enjoy pockets of high growth, especially in Gulf Cooperation Council smart meter rollouts and South African renewable tenders that demand advanced grid-support inverters. Latin America remains an emerging opportunity as Brazil and Mexico explore time-of-use tariffs and utility-backed rooftop solar credits that encourage energy management system uptake. Although advanced semiconductor fabrication is limited in these regions, policy incentives for distributed renewables create downstream demand for smart power hardware and software.
- Texas Instruments Incorporated
- Infineon Technologies AG
- STMicroelectronics N.V.
- ON Semiconductor Corporation
- Qualcomm Incorporated
- Apple Inc.
- Samsung Electronics Co., Ltd.
- LG Electronics Inc.
- Huawei Technologies Co., Ltd.
- Nokia Corporation
- Anker Innovations Technology Co., Ltd.
- Belkin International, Inc.
- Logitech International S.A.
- ZAGG Inc. (mophie)
- Energous Corporation
- Ossia Inc.
- Powermat Technologies Ltd.
- Dialog Semiconductor GmbH
- Navitas Semiconductor Corporation
- Efficient Power Conversion Corporation
- GaN Systems Inc.
Additional Benefits:
- The market estimate (ME) sheet in Excel format
- 3 months of analyst support
TABLE OF CONTENTS
1 INTRODUCTION
- 1.1 Study Assumptions and Market Definition
- 1.2 Scope of the Study
2 RESEARCH METHODOLOGY
3 EXECUTIVE SUMMARY
4 MARKET LANDSCAPE
- 4.1 Market Overview
- 4.2 Market Drivers
- 4.2.1 Rising Adoption of Wireless Charging in Consumer Electronics
- 4.2.2 Proliferation of Power Management ICs in 5G Smartphones and IoT Devices
- 4.2.3 Rapid Growth of Electric Vehicles Requiring High-Efficiency Power Electronics
- 4.2.4 Government Incentives for Smart Grid Modernization
- 4.2.5 Integration of Smart Power Modules into Modular Furniture
- 4.2.6 AI-Enhanced Power Management Algorithms Reducing Standby Losses
- 4.3 Market Restraints
- 4.3.1 High Cost of Wide-Bandgap Materials such as GaN and SiC
- 4.3.2 Interoperability and Standards Fragmentation
- 4.3.3 Thermal Management Challenges in High-Density PMICs
- 4.3.4 Tariff Volatility on Semiconductor Components
- 4.4 Industry Value Chain Analysis
- 4.5 Regulatory Landscape
- 4.6 Technological Outlook
- 4.7 Impact of Macroeconomic Factors on the Market
- 4.8 Porter's Five Forces Analysis
- 4.8.1 Bargaining Power of Suppliers
- 4.8.2 Bargaining Power of Consumers
- 4.8.3 Threat of New Entrants
- 4.8.4 Threat of Substitute Products
- 4.8.5 Intensity of Competitive Rivalry
- 4.9 Wireless Charger Embedded Furniture Trend Analysis
- 4.10 Investment Analysis
5 MARKET SIZE AND GROWTH FORECASTS (VALUE)
- 5.1 By Product
- 5.1.1 Wireless Chargers
- 5.1.2 Energy Management Systems
- 5.2 By Technology
- 5.2.1 Inductive / Magnetic Resonance
- 5.2.2 Radio Frequency / Infrared
- 5.2.3 Wide-Bandgap Power Electronics (GaN, SiC)
- 5.3 By Application
- 5.3.1 Consumer Electronics
- 5.3.2 Automotive and E-Mobility
- 5.3.3 Industrial Automation
- 5.3.4 Residential and Commercial Energy Management
- 5.4 By End User
- 5.4.1 OEMs / Device Manufacturers
- 5.4.2 Utilities and Energy Service Companies
- 5.4.3 Hospitality and Retail
- 5.4.4 Government and Defense
- 5.5 By Power Device Type
- 5.5.1 Power Management ICs
- 5.5.2 Smart Power Modules
- 5.5.3 Discrete Wide-Bandgap Devices
- 5.5.4 Switching Mode Power Supplies
- 5.6 By Geography
- 5.6.1 North America
- 5.6.1.1 United States
- 5.6.1.2 Canada
- 5.6.1.3 Mexico
- 5.6.2 South America
- 5.6.2.1 Brazil
- 5.6.2.2 Mexico
- 5.6.2.3 Rest of South America
- 5.6.3 Europe
- 5.6.3.1 Germany
- 5.6.3.2 United Kingdom
- 5.6.3.3 France
- 5.6.3.4 Spain
- 5.6.3.5 Italy
- 5.6.3.6 Rest of Europe
- 5.6.4 Asia Pacific
- 5.6.4.1 China
- 5.6.4.2 India
- 5.6.4.3 Japan
- 5.6.4.4 Australia
- 5.6.4.5 South Korea
- 5.6.4.6 Rest of Asia Pacific
- 5.6.5 Middle East and Africa
- 5.6.5.1 Middle East
- 5.6.5.1.1 Saudi Arabia
- 5.6.5.1.2 United Arab Emirates
- 5.6.5.1.3 Qatar
- 5.6.5.1.4 Turkey
- 5.6.5.1.5 Rest of Middle East
- 5.6.5.2 Africa
- 5.6.5.2.1 South Africa
- 5.6.5.2.2 Nigeria
- 5.6.5.2.3 Rest of Africa
- 5.6.5.1 Middle East
- 5.6.1 North America
6 COMPETITIVE LANDSCAPE
- 6.1 Market Concentration
- 6.2 Strategic Moves
- 6.3 Market Share Analysis
- 6.4 Company Profiles (includes Global Level Overview, Market Level Overview, Core Segments, Financials as Available, Strategic Information, Market Rank/Share for Key Companies, Products and Services, and Recent Developments)
- 6.4.1 Texas Instruments Incorporated
- 6.4.2 Infineon Technologies AG
- 6.4.3 STMicroelectronics N.V.
- 6.4.4 ON Semiconductor Corporation
- 6.4.5 Qualcomm Incorporated
- 6.4.6 Apple Inc.
- 6.4.7 Samsung Electronics Co., Ltd.
- 6.4.8 LG Electronics Inc.
- 6.4.9 Huawei Technologies Co., Ltd.
- 6.4.10 Nokia Corporation
- 6.4.11 Anker Innovations Technology Co., Ltd.
- 6.4.12 Belkin International, Inc.
- 6.4.13 Logitech International S.A.
- 6.4.14 ZAGG Inc. (mophie)
- 6.4.15 Energous Corporation
- 6.4.16 Ossia Inc.
- 6.4.17 Powermat Technologies Ltd.
- 6.4.18 Dialog Semiconductor GmbH
- 6.4.19 Navitas Semiconductor Corporation
- 6.4.20 Efficient Power Conversion Corporation
- 6.4.21 GaN Systems Inc.
7 MARKET OPPORTUNITIES AND FUTURE OUTLOOK
- 7.1 White-Space and Unmet-Need Assessment


