|
시장보고서
상품코드
2116276
우주 착륙선 및 탐사차 : 시장 점유율 분석, 업계 동향 및 통계, 성장 예측(2026-2031년)Space Lander And Rover - Market Share Analysis, Industry Trends & Statistics, Growth Forecasts (2026 - 2031) |
||||||
 Mordor Intelligence
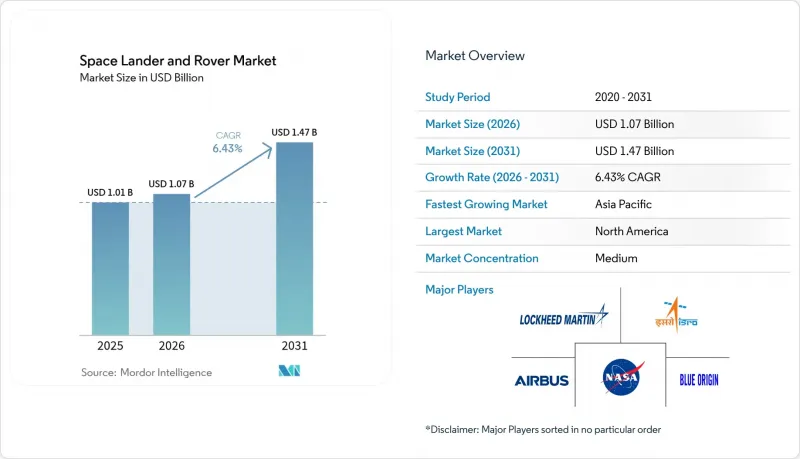
Mordor Intelligence에 의하면, 우주 착륙선 및 탐사차 시장 규모는 2025년 10억 1,000만 달러로 평가되었습니다. 2026년에는 10억 7,000만 달러로 확대되어 2026년부터 2031년에 걸쳐 CAGR 6.43%로 성장을 지속하여, 2031년까지 14억 7,000만 달러에 이를 것으로 예측됩니다.
본 보고서는 탐사 대상 천체(달, 화성, 소행성, 혜성 등), 플랫폼 질량 등급(마이크로, 소형, 기타), 이동 방식(바퀴식 로버, 호퍼형 착륙선, 기타),동력원(태양광, 연료전지, 기타), 최종 사용자(정부 우주 기관, 방위 기관, 기타), 지역(북미, 유럽, 기타)별로 분류되어 있습니다. 시장 예측은 금액(달러) 기준으로 제시되어 있습니다.
세계의 우주 착륙선 및 탐사차 시장 동향 및 인사이트
전 세계적으로 협력하는 달 탐사 이니셔티브의 확대
47개국이 ‘아르테미스 협정’에 서명하여 달 표면에서의 행동 규범을 표준화하고, 여러 이해관계자에게 서비스를 제공하는 상호 운용 가능한 로버의 실현을 가능하게 했습니다. 중국은 2030년까지 ‘창어 7호’ 및 ‘창어 8호’와 연계하여 우주비행사를 달 표면으로 보내는 것을 목표로 하고 있으며, 이에 따라 탐사선 수요를 두 배로 늘릴 수 있는 병행 인프라 구축을 추진하고 있습니다. ISRO와 JAXA가 공동으로 진행하는 LUPEX 미션은 예산을 통합함으로써 어느 기관도 단독으로는 전개할 수 없는 250kg급 로버를 실현할 수 있음을 보여주고 있습니다. ESA의 ‘헤라클레스’ 구상은 달 게이트웨이를 거점으로 전개되며, 견고한 자율 주행 차량이 필요한 여러 기관 간의 물자 수송을 추가합니다. 이러한 협력을 통해 조달 형태는 특별 주문된 일회성 기체에서 다양한 페이로드에 적합한 모듈식 기체 군으로 전환되고 있습니다.
확대되는 행성 과학 투자와 미션 파이프라인
NASA의 행성 과학 예산은 연간 30억 달러를 초과하며, ESA는 2030년까지의 탐사를 위해 27억 유로(31억 9,000만 달러)를 확보하고 있습니다. 현재 탄탄한 미션 계획에는 1회당 3억 달러 규모의 저비용 화성 미션, 2025년 중국의 소행성 시료 회수 미션 ‘천문 2호’, 2028년 ESA의 아포피스 탐사 미션 ‘람세스’, 그리고 일본의 화성 위성 탐사 미션 ‘MMX’ 등이 포함되어 있습니다. 상업용 달 표면 페이로드 서비스 프로그램에서는 민간 착륙선 기업에 26억 달러 규모의 고정 가격 계약이 제공되고 있으며, 개별 페이로드에 맞추어 쉽게 맞춤화할 수 있는 표준화된 로버 프레임의 개발이 촉진되고 있습니다. 지속적인 발사로 인해 생산 라인이 안정화되고 학습 곡선이 단축됨에 따라, 우주 착륙선 및 로버 시장이 견인되고 있습니다.
급등하는 연구개발비와 잦은 일정 지연
NASA의 ‘화성 시료 회수’ 프로그램은 110억 달러 규모로 확대되었으나, 현재 발사일은 미정입니다. ESA의 ‘엑소마즈’ 로버는 러시아산 하드웨어를 상실한 데 따라 계획 범위가 재검토되어 일정에 수년 치의 지연이 발생했습니다. 고도의 자율성, 방사선 차폐, 심부 굴착 시스템은 인증의 장벽을 높이고 있지만, 중소기업들은 행성 탐사선용 인증 요건을 과소평가하는 경향이 있습니다. 비용 초과로 인해 각 기관은 비행 기회를 줄일 수밖에 없어, 우주 착륙선 및 로버 시장의 잠재적 이익이 억제되고 있습니다.
부문별 분석
2025년, 달 탐사 프로그램은 우주 착륙선 및 로버 시장의 45.62%를 차지했습니다. ‘아르테미스’ 계획에 따른 달 표면 탐사의 지속, ‘창어(嫦娥)’ 계획에 따른 물자 수송, 그리고 상업용 페이로드 배송이 지출의 기반을 이루고 있습니다. 그러나 소천체 시료 채취가 과학 및 자원 평가에 기여함에 따라, 소행성 및 혜성 프로젝트는 2031년까지 10.21%라는 가장 높은 연평균 성장률(CAGR)을 보일 것으로 전망됩니다. 화성 탐사 임무는 ‘퍼서비어런스’와 2028년 ‘엑소마즈’ 착륙선을 통해 견조한 추세를 보이는 한편, 엔켈라두스 탐사 로버 등 태양계 외곽 탐사 구상이 각 우주 기관의 로드맵에 등장하고 있습니다. 탐사 대상 천체의 범위가 확대됨에 따라 우주 착륙선 및 로버 시장은 다양화되고 있으며, 이는 시장의 장기적인 안정성을 뒷받침하고 있습니다.
행성 방어에 대한 관심 고조 또한, 구성 성분과 내부 구조를 매핑하는 소행성 탐사 로버 개발을 뒷받침하고 있습니다. ‘OSIRIS-REx’의 시료 회수 임무 성공은 추가적인 정찰선 개발을 촉진하고 있습니다. 원자력 추진 기술과 자율 기술의 성숙에 따라 유로파나 엔셀라두스에 도달하는 것이 가능해졌으며, 새로운 열 설계가 요구되는 얼음 위성 환경으로 대상 시장이 확대되고 있습니다.
중형 탐사선은 2025년 매출의 31.02%를 차지하며, 탑재체 용량과 발사 비용의 균형을 맞추었습니다. ‘퍼서비어런스’는 그 내구성과 실험실 수준의 계측 장비를 구현한 사례입니다. 한편, 마이크로 플랫폼은 소형화된 센서와 공동 발사를 활용함으로써 연평균 성장률(CAGR) 8.39%로 성장을 지속하고 있습니다. 100kg 미만의 로버 군단은 중복성과 광범위한 지형 커버리지를 제공하며, 미션 아키텍처를 분산형 네트워크로 재구성하고 있습니다.
소형 및 중량급 카테고리는 틈새 역할을 담당하고 있습니다. 소형 시스템은 착륙 지점을 정찰하고, 중량급 주력 기체는 심부 굴착 장비나 ISRU(현지 자원 활용) 원자로를 탑재합니다. 그러나 경량 합금의 발전으로 인해, 과거에는 800kg급 기체에 한정되었던 임무도 200kg급 기체로 수행할 수 있게 되고 있습니다. 이러한 변화로 인해 임무 전체의 비용이 절감되고, 우주 착륙선 및 로버 시장에 진출하는 사업자의 범위가 확대될 것입니다.
지역별 분석
북미는 NASA의 30억 달러를 넘는 행성 과학 예산과 주요 계약업체들이 밀집해 있는 덕분에 2025년 매출의 32.44%를 차지했습니다. 통합된 공급망, 시험장, 그리고 명확한 규제로 인해 개발 주기가 단축되고 있습니다. 스페이스X의 ‘스타십’, 블루 오리진의 ‘뉴글렌’, ULA의 ‘발칸’은 운반 능력을 향상시켜 더 무거운 로버와 집약된 페이로드 등급의 실현을 가능하게 함으로써 프로그램의 선택 폭을 넓히고 있습니다.
유럽은 ESA의 27억 유로(31억 9,000만 달러)에 달하는 탐사 예산과 2028년으로 예정된 ‘엑소마스’ 발사를 배경으로 2위 자리를 확보하고 있습니다. 에어버스, 탈레스 알레니아 스페이스, OHB가 추진 시스템, 항공전자 장비, 구조체를 공급하고 있습니다. 이 지역은 과학적 엄밀성과 지속가능성 목표를 융합하여 재사용 가능한 착륙선 단계 및 저공해 시료 채취 장비의 개발을 가속화하고 있습니다. 기관 간 협력은 여전히 유럽의 특징이며, 캐나다와 일본을 끌어들여 비용과 전문 지식을 공유하고 있습니다.
아시아태평양은 8.27%라는 가장 높은 연평균 성장률(CAGR)을 기록하고 있습니다. 중국의 두 가지 로켓을 통한 발사 속도는 ‘창어(Chang’e)’ 및 ‘천문(Tianwen)’ 임무를 뒷받침하고 있으며, 2030년에 예정된 유인 달 착륙 계획은 대형 달 탐사차 조달을 촉진하고 있습니다. 인도의 ISRO는 ‘찬드라얀’ 계획의 노하우를 활용하여 JAXA와 공동으로 ‘LUPEX’ 드릴 로버를 개발하고 있으며, 일본의 MMX 미션은 여러 천체에 도달할 가능성을 보여주고 있습니다. 신흥 우주 스타트업 기업들이 비용 효율적인 부품을 제공하며, 우주 착륙선 및 로버 시장공급 구조를 재편하고 있습니다.
기타 혜택 :
- 엑셀 형식 시장 예측(ME) 시트
- 3개월간의 애널리스트 지원
자주 묻는 질문
목차
제1장 서론
제2장 조사 방법
제3장 개요
제4장 시장 구도
제5장 시장 규모 및 성장 예측
제6장 경쟁 구도
제7장 시장 기회 및 향후 전망
KTH 26.08.31According to Mordor Intelligence, the space lander and rover market size is expected to grow from USD 1.01 billion in 2025 to USD 1.07 billion in 2026 and is forecast to reach USD 1.47 billion by 2031 at 6.43% CAGR over 2026-2031.
This report is Segmented by Target Body (Moon, Mars, Asteroids and Comets. And More), Platform Mass Class (Micro, Small, and More), Mobility Type (Wheeled Rovers, Hopper Landers, and More), Power Source (Solar, Fuel-Cell, and More), End User (Government Space Agencies, Defense Agencies, and More), and Geography (North America, Europe, and More). The Market Forecasts are Provided in Terms of Value (USD).
Global Space Lander And Rover Market Trends and Insights
Expansion of Globally Coordinated Lunar Exploration Initiatives
Forty-seven nations have signed the Artemis Accords, standardizing surface protocols and enabling interoperable rovers serving multiple stakeholders. China aims to place astronauts on the Moon by 2030, paired with Chang'e 7 and Chang'e 8, and create a parallel infrastructure that multiplies vehicle demand. The LUPEX mission by ISRO and JAXA shows how combining budgets delivers a 250 kg class rover that neither agency would field alone. ESA's Heracles concept, staged from the Lunar Gateway, adds multi-agency cargo runs that require rugged autonomous vehicles. These coalitions shift procurement from bespoke one-off craft to modular fleets suited for diverse payloads.
Growing Planetary Science Investments and Mission Pipeline
NASA's planetary science budget surpasses USD 3 billion annually, and ESA secures EUR 2.7 billion (USD 3.19 billion) for exploration through 2030. A dense manifest now includes low-cost Mars missions at USD 300 million each, China's Tianwen-2 asteroid return in 2025, ESA's Ramses mission to Apophis in 2028, and Japan's MMX visit to Martian moons. The commercial lunar payload services program funnels USD 2.6 billion in fixed-price contracts to private lander firms, encouraging standardized rover frames that are easily tailored for individual payloads. Continuous launches stabilize production lines and shorten learning curves, propelling the space lander and rover market.
Escalating R&D Costs and Frequent Schedule Delays
NASA's Mars Sample Return program grew to USD 11 billion and now faces an undefined launch date. ESA's ExoMars rover was re-scoped after losing Russian hardware, adding years to the calendar. Advanced autonomy, radiation shielding, and deep-drill systems raise qualification hurdles, while smaller firms underestimate planetary certification demands. Cost overruns force agencies to trim flight opportunities, tempering potential gains for the space lander and rover market.
Other drivers and restraints analyzed in the detailed report include:
- Technological Advancements in Ultra-Lightweight Rover Materials
- Acceleration of In-Situ Resource Utilization (ISRU) Testbed Missions
- Limited Planetary-Launch Windows and Capacity
For complete list of drivers and restraints, kindly check the Table Of Contents.
Segment Analysis
Lunar programs contributed 45.62% of the space lander and rover market share in 2025. Continued Artemis surface sorties, Chang'e cargo runs, and commercial payload deliveries anchor spending. However, asteroid and comet projects deliver the fastest 10.21% CAGR to 2031 as small-body sampling feeds science and resource appraisal. Mars missions hold steady with Perseverance and the 2028 ExoMars lander, while outer-solar-system concepts such as Enceladus rovers appear in agency roadmaps. Broader celestial coverage diversifies the space lander and rover market and underpins its long-term stability.
Growing interest in planetary defense also promotes asteroid rovers that map composition and internal structure. The success of the OSIRIS-REx sample return spurs more reconnaissance craft. Europa and Enceladus become reachable as nuclear power and autonomy mature, extending the addressable market into icy-moon environments that demand new thermal designs.
Medium craft held 31.02% of 2025 revenue, balancing payload capacity against launch price. Perseverance exemplifies their endurance and laboratory-grade instruments. At the same time, micro platforms post an 8.39% CAGR by leveraging miniaturized sensors and shared rides. Swarms of sub-100 kg rovers provide redundancy and broad terrain coverage, reshaping mission architecture toward distributed networks.
Small and heavy categories fill niche roles. Small systems scout landing zones, while heavy flagships carry deep drills or ISRU reactors. Yet advances in lightweight alloys mean tasks once reserved for 800 kg vehicles can migrate to 200 kg frames. That shift lowers overall mission cost and enlarges the pool of operators entering the space lander and rover market.
Complete Report Scope:
- By Target Body
- Moon
- Mars
- Asteroids and Comets
- Other Celestial Bodies
- By Platform Mass Class
- Micro
- Small
- Medium
- Heavy
- By Mobility Type
- Wheeled Rovers
- Hopper Landers
- Legged Rovers
- Tracked Rovers
- Hybrid Mobility Platforms
- By Power Source
- Solar
- Radioisotope Thermoelectric Generator
- Fuel-Cell
- Battery-Only
- By End User
- Government Space Agencies
- Commercial Space Companies
- Research Institutions and Universities
- Defense Agencies
- By Geography
- North America
- United States
- Canada
- Mexico
- Europe
- United Kingdom
- Germany
- France
- Italy
- Rest of Europe
- Asia-Pacific
- China
- India
- Japan
- South Korea
- Rest of Asia-Pacific
- South America
- Brazil
- Rest of South America
- Middle East and Africa
- Middle East
- United Arab Emirates
- Saudi Arabia
- Rest of Middle East
- Africa
- South Africa
- Rest of Africa
- Middle East
- North America
Geography Analysis
North America commanded 32.44% of 2025 revenue thanks to NASA's USD 3 billion-plus planetary science line and a dense cluster of prime contractors. Integrated supply chains, test ranges, and regulatory clarity shorten development loops. SpaceX Starship, Blue Origin New Glenn, and ULA Vulcan boost lift capacity, enabling heavier rovers and aggregated payload classes that widen program options.
Europe secures second place on the strength of ESA's EUR 2.7 billion (USD 3.19 billion) exploration envelope and forthcoming ExoMars liftoff in 2028. Airbus, Thales Alenia Space, and OHB supply propulsion, avionics, and structures. The region blends scientific rigor with sustainability aims, accelerating reusable lander stages and low-contamination sampling gear. Inter-agency collaboration remains Europe's hallmark, drawing in Canada and Japan to share cost and expertise.
Asia-Pacific posts the fastest 8.27% CAGR. China's dual-launcher cadence underpins Chang'e and Tianwen missions, while its planned 2030 crewed landing drives procurement of heavy lunar rovers. India's ISRO scales Chandrayaan heritage into the LUPEX drill rover with JAXA, and Japan's MMX mission illustrates multi-body reach. Emerging space startups contribute cost-efficient components, reshaping supply dynamics for the space lander and rover market.
- National Aeronautics & Space Administration (NASA)
- China Aerospace Science and Technology Corporation (CASC)
- Lockheed Martin Corporation
- Northrop Grumman Corporation
- Airbus SE
- ROSCOSMOS
- Canadian Space Agency
- Blue Origin Enterprises, L.P.
- Indian Space Research Organisation (ISRO)
- Japan Aerospace Exploration Agency (JAXA)
- ispace, Inc.
- Spacebit
- ASTROBOTIC TECHNOLOGY, INC.
- Space Exploration Technologies Corp.
- Intuitive Machines, LLC
- Thales Alenia Space
- Moon Express Inc.
- Firefly Aerospace Inc.
- Dynetics (Leidos, Inc.)
Additional Benefits:
- The market estimate (ME) sheet in Excel format
- 3 months of analyst support
TABLE OF CONTENTS
1 INTRODUCTION
- 1.1 Study Assumptions and Market Definition
- 1.2 Scope of the Study
2 RESEARCH METHODOLOGY
3 EXECUTIVE SUMMARY
4 MARKET LANDSCAPE
- 4.1 Market Overview
- 4.2 Market Drivers
- 4.2.1 Expansion of globally coordinated lunar exploration initiatives
- 4.2.2 Growing planetary science investments and mission pipeline
- 4.2.3 Technological advancements in ultra-lightweight rover materials
- 4.2.4 Acceleration of in-situ resource utilization (ISRU) testbed missions
- 4.2.5 Emergence of commercial payload sponsorship and rideshare models
- 4.2.6 Rising demand for autonomy-driven terrain navigation and hazard avoidance
- 4.3 Market Restraints
- 4.3.1 Escalating R&D costs and frequent schedule delays
- 4.3.2 Limited planetary-launch windows and capacity
- 4.3.3 Strict planetary protection and biocontamination compliance
- 4.3.4 Thermal and radiation shielding challenges in extreme environments
- 4.4 Value Chain Analysis
- 4.5 Regulatory Landscape
- 4.6 Technological Outlook
- 4.7 Porter's Five Forces Analysis
- 4.7.1 Bargaining Power of Buyers
- 4.7.2 Bargaining Power of Suppliers
- 4.7.3 Threat of New Entrants
- 4.7.4 Threat of Substitute Products
- 4.7.5 Intensity of Competitive Rivalry
5 MARKET SIZE AND GROWTH FORECASTS (VALUE)
- 5.1 By Target Body
- 5.1.1 Moon
- 5.1.2 Mars
- 5.1.3 Asteroids and Comets
- 5.1.4 Other Celestial Bodies
- 5.2 By Platform Mass Class
- 5.2.1 Micro
- 5.2.2 Small
- 5.2.3 Medium
- 5.2.4 Heavy
- 5.3 By Mobility Type
- 5.3.1 Wheeled Rovers
- 5.3.2 Hopper Landers
- 5.3.3 Legged Rovers
- 5.3.4 Tracked Rovers
- 5.3.5 Hybrid Mobility Platforms
- 5.4 By Power Source
- 5.4.1 Solar
- 5.4.2 Radioisotope Thermoelectric Generator
- 5.4.3 Fuel-Cell
- 5.4.4 Battery-Only
- 5.5 By End User
- 5.5.1 Government Space Agencies
- 5.5.2 Commercial Space Companies
- 5.5.3 Research Institutions and Universities
- 5.5.4 Defense Agencies
- 5.6 By Geography
- 5.6.1 North America
- 5.6.1.1 United States
- 5.6.1.2 Canada
- 5.6.1.3 Mexico
- 5.6.2 Europe
- 5.6.2.1 United Kingdom
- 5.6.2.2 Germany
- 5.6.2.3 France
- 5.6.2.4 Italy
- 5.6.2.5 Rest of Europe
- 5.6.3 Asia-Pacific
- 5.6.3.1 China
- 5.6.3.2 India
- 5.6.3.3 Japan
- 5.6.3.4 South Korea
- 5.6.3.5 Rest of Asia-Pacific
- 5.6.4 South America
- 5.6.4.1 Brazil
- 5.6.4.2 Rest of South America
- 5.6.5 Middle East and Africa
- 5.6.5.1 Middle East
- 5.6.5.1.1 United Arab Emirates
- 5.6.5.1.2 Saudi Arabia
- 5.6.5.1.3 Rest of Middle East
- 5.6.5.2 Africa
- 5.6.5.2.1 South Africa
- 5.6.5.2.2 Rest of Africa
- 5.6.5.1 Middle East
- 5.6.1 North America
6 COMPETITIVE LANDSCAPE
- 6.1 Market Concentration
- 6.2 Strategic Moves
- 6.3 Market Share Analysis
- 6.4 Company Profiles (includes Global level Overview, Market level overview, Core Segments, Financials as available, Strategic Information, Market Rank/Share for key companies, Products and Services, and Recent Developments)
- 6.4.1 National Aeronautics & Space Administration (NASA)
- 6.4.2 China Aerospace Science and Technology Corporation (CASC)
- 6.4.3 Lockheed Martin Corporation
- 6.4.4 Northrop Grumman Corporation
- 6.4.5 Airbus SE
- 6.4.6 ROSCOSMOS
- 6.4.7 Canadian Space Agency
- 6.4.8 Blue Origin Enterprises, L.P.
- 6.4.9 Indian Space Research Organisation (ISRO)
- 6.4.10 Japan Aerospace Exploration Agency (JAXA)
- 6.4.11 ispace, Inc.
- 6.4.12 Spacebit
- 6.4.13 ASTROBOTIC TECHNOLOGY, INC.
- 6.4.14 Space Exploration Technologies Corp.
- 6.4.15 Intuitive Machines, LLC
- 6.4.16 Thales Alenia Space
- 6.4.17 Moon Express Inc.
- 6.4.18 Firefly Aerospace Inc.
- 6.4.19 Dynetics (Leidos, Inc.)
7 MARKET OPPORTUNITIES AND FUTURE OUTLOOK
- 7.1 White-space and Unmet-need Assessment