
|
시장보고서
상품코드
2116360
건물 검사 서비스 시장 : 점유율 분석, 업계 동향과 통계, 성장 예측(2026-2031년)Building Inspection Services - Market Share Analysis, Industry Trends & Statistics, Growth Forecasts (2026 - 2031) |
||||||
 Mordor Intelligence
Mordor Intelligence에 의하면, 2026년 건물 검사 서비스 시장 규모는 104억 7,000만 달러로 추정되고 있어 2025년 97억 6,000만 달러에서 확대해, 2031년에는 148억 4,000만 달러에 이를 것으로 예측됩니다.
2026년부터 2031년까지 연평균 성장률(CAGR) 7.24%로 성장할 것으로 전망됩니다.
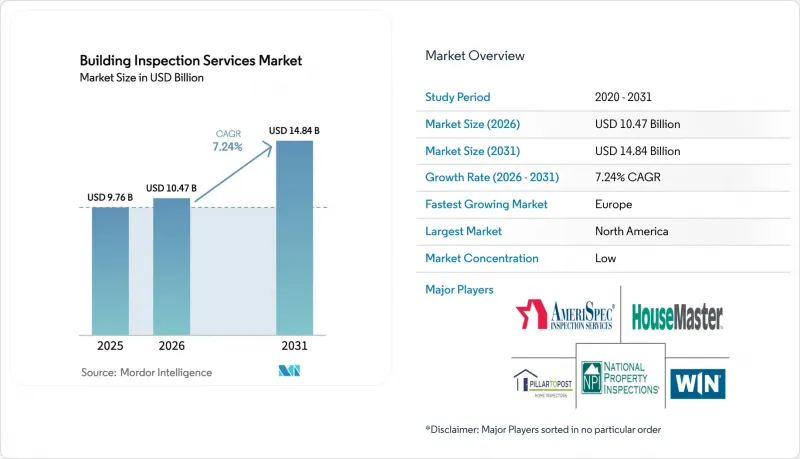
본 보고서는 서비스별(주택 검사 서비스, 특정 요소 검사 서비스 등), 조달 형태별(사내 서비스, 외부 위탁 서비스), 용도별(주택, 상업, 기타), 최종 사용자별(부동산 회사·중개업자, 부동산 소유자·투자자 등), 지역별(북미 등)로 분류되어 있습니다. 시장 전망은 금액(달러) 기준으로 제시되어 있습니다.
전 세계 건물 검사 서비스 시장 동향 및 인사이트
건축 안전 규제 및 기준의 강화
2024년판 ‘국제 건축 기준(International Building Code)’에는 토네이도 하중 측정 기준, 더 높은 내풍성 기준치, 일산화탄소 감지 장치의 보편적인 도입이 포함되어 있어 검사의 기본적인 복잡성이 증가하고 있습니다. 온타리오주는 2024년에 주 내 건축 기준의 상이점 1,730건을 철폐하여, 엄격한 안전 검사를 유지하면서도 규정 준수를 간소화했습니다. 캘리포니아주의 SB-721 법에 따르면, 2025년 1월까지 다세대 주택의 데크 검사가 의무화되어 전문가들에게 새로운 틈새 시장이 생겨나고 있습니다. 이러한 정책으로 인해 제3자가 발급하는 검사 증명서의 가치가 높아지고, 사업자들 간의 지속적인 전문 역량 개발이 촉진되고 있습니다.
부동산 거래량 증가
주택담보대출 금리의 안정화로 주택 시장 거래가 회복세를 보이고 있습니다. 전미부동산협회(NAR)는 2025년 미국의 주택 판매 건수가 9% 증가할 것으로 예측했습니다. 캐나다에서는 스트레스 테스트 규제 완화 및 보험 적용 주택담보대출 한도 상향 조정과 같은 규제 변경이 있었음에도 불구하고, 2024년 주택 판매 건수는 10% 증가했습니다. 검사 면제를 허용하지 않는다는 매사추세츠주의 법안(현재 심의 중)과 같은 주법은 의무적 검사 도입을 향한 규제 추진의 기세를 뒷받침하고 있습니다. 데이터센터 및 재생에너지 자산 분야의 상업용 부동산 거래 역시 검사 수요를 더욱 부추기고 있습니다. 이러한 수요 급증으로 인해 공인 검사관공급이 여전히 부족하여 검사 체계가 포화 상태에 이르렀고, 경쟁이 치열한 지역 시장에서는 서비스 가격이 상승하는 추세입니다.
극도로 세분화된 사업 환경과 가격 압박
수천 명의 개인 사업자와 지역 밀착형 중소기업이 범용 주택 검사 업무에서 경쟁하고 있어, 미국의 많은 대도시권에서는 평균 단가가 정체되어 있습니다. 사모펀드(PE)는 데이터 기반 일정 관리와 교차 판매를 통한 시너지 효과를 활용해 전국적인 사업 확장을 목표로, 틈새 시장 제공업체들의 통합을 계속하고 있습니다. 인수가 잇따르고 있음에도 불구하고, 상위 5개사의 매출액은 여전히 전 세계 전체의 3분의 1을 크게 밑돌고 있으며, 정형화된 업무에서의 가격 경쟁은 여전히 치열한 상황입니다. 각 사업자는 에너지 감사, 외벽 안전 인증, 드론을 활용한 외벽 스캔 등 고단가가 기대되는 전문 서비스에 대한 투자를 통해 차별화를 꾀하고 있습니다. 고객들은 현장 데이터 수집과 클라우드 기반 분석, 디지털 보고서 제공을 융합한 엔드투엔드 플랫폼을 높이 평가했습니다.
부문 분석
주택 검사 서비스는 거래를 주도한 수요 회복에 힘입어 2025년에는 건물 검사 서비스 시장 점유율의 44.12%를 차지했습니다. 미국 내 많은 주에서 면제 조항이 철폐됨에 따라, 현재는 모든 주택 거래에서 인증 보고서가 필수화되어 거래 건수가 증가하고 있습니다. 상업용 건물 검사 서비스는 데이터센터, 물류, 재생 에너지 프로젝트에서 자금 조달 일정에 연동된 검사 마일스톤이 포함되어 있어 꾸준히 성장했습니다. ‘기타 전문 서비스’ 부문의 건물 검사 서비스 시장 규모는 에너지 감사, 드론 조사, AI를 활용한 파사드 분석에 힘입어 연평균 성장률(CAGR) 8.74%로 확대될 것으로 예측됩니다.
각 서비스 제공업체는 유럽의 제로 배출 규제에 대응하기 위해 열화상 촬영, 블로우도어 시험 및 탄소 강도 산정을 세트로 제공합니다. 캘리포니아주의 데크 안전 점검이나 덴버시에서 의무화된 ANSI/ASHRAE/ACCA 211-2018 레벨 2 에너지 감사는 틈새 규제가 얼마나 높은 수익률을 창출하는지 보여줍니다. 구조 엔지니어와 소프트웨어 개발자를 융합한 기업들은 확고한 경쟁 우위를 확보하고 있습니다.
2025년에는 대형 부동산 소유주와 시설 관리자가 직접적인 감독을 선호함에 따라 사내 검사 팀이 매출의 56.21%를 차지했습니다. 그러나 건축 기준이 더욱 복잡해지고 기술이 급속히 발전함에 따라, 아웃소싱 서비스의 건물 검사 서비스 시장 규모는 2031년까지 연평균 성장률(CAGR) 8.25%로 확대될 것으로 예측됩니다. 외부 전문가는 기술 비용을 다양한 고객 기반에 분산시키기 때문에 중규모 소유주에게도 고해상도 LiDAR 및 AI 플랫폼이 합리적인 가격으로 제공될 것입니다.
보험사와 금융 기관은 이해 상충의 위험을 줄이기 위해 제3자에 의한 인증을 점점 더 요구하고 있습니다. 2024년 더 코퍼레이터스가 카슨 던롭을 인수한 사례는 보험 그룹이 연간 20만 건 이상의 검사 업무를 처리할 수 있는 전문 지식을 확보하기 위해 얼마나 수직 통합을 추진하고 있는지를 보여줍니다. 또한 아웃소싱을 통해 전국 규모의 서비스 제공업체가 인력을 수요가 높은 지역으로 재배치함으로써, 수용 능력의 불균형을 완화하고 인력 부족 문제도 해소할 수 있습니다.
지역별 분석
2025년에도 북미는 여전히 지역별 최대 기여원으로 남아 있으며, 그 배경에는 엄격한 건축 기준, 노후화된 건물의 높은 재건축률, 그리고 기술 도입에 적극적인 규제 당국의 존재가 있습니다. 2024년 ‘국제 건축 기준(IBC)’ 개정과 더불어 캘리포니아주의 ‘타이틀 24’ 개정 등, 신축 건물에 태양광 발전 시스템 및 배터리 저장 시스템 설치를 의무화하는 주 조례로 인해 검사 범위가 확대되고 있습니다. 미국 에너지부(DOE)가 제시한 제로 배출 건축물에 대한 공식 정의는 입주 허가가 발급되기 전에 검사 기관이 검증해야 할 통일된 지침을 규정하고 있습니다. 오리건주의 검사관 부족 사태가 상징하듯이, 검사 역량의 제약으로 인해 가동률은 높은 수준을 유지하고 있으며, 이는 가격을 지탱하는 요인이 되고 있습니다.
유럽은 가장 빠르게 성장하는 시장입니다. 이는 ‘건물의 에너지 성능에 관한 지침(EPBD)’에 따라 2030년까지 모든 신축 건물, 2028년까지 공공 건물에 대해 제로 배출이 의무화되어 있기 때문입니다. 최저 에너지 성능 기준에 따라 성능이 가장 낮은 기존 건축물의 상위 16%에 대해 개보수가 의무화되어, 안정적인 개보수 검사 업무가 창출되고 있습니다. ‘강화된 에너지 성능 증명서’나 ‘건물 개보수 여권’에는 자산의 전체 수명 주기에 걸친 검사 체크포인트가 포함되어 있어, 수년에 걸친 수익 전망이 서 있습니다. 열화상 드론이나 수명 주기 탄소 배출량 계산 도구를 보유한 사업자는 국경을 초월한 프레임워크에서 유리한 입지를 점하고 있습니다.
아시아태평양에서는 인프라 투자와 스마트 시티 구상이 견인차 역할을 하며 강력한 성장이 지속되고 있습니다. 일본의 건설 생산액은 2024년에 6,092억 7,000만 달러에 달할 것으로 예상되며, 2029년까지 7,166억 6,000만 달러에 이를 것으로 전망되어, 규정 준수 검증 및 품질 관리에 대한 수요가 지속되고 있습니다. 2024년 뷰로 베리타스가 호주의 APP 그룹을 인수함에 따라 대규모 교통 프로젝트에서 해당 기업의 사업 기반이 강화되었으며, 이 지역 내 업계 재편 동향이 부각되었습니다. 각국마다 상이한 규격이 여전히 국경을 초월한 표준화를 저해하고 있지만, 지역을 넘나드는 고객들은 통합된 디지털 플랫폼을 구축하면서도 현지 요건을 충족시킬 수 있는 기업을 선호하는 경향을 보이고 있습니다.
기타 혜택:
- 엑셀 형식 시장 예측(ME) 시트
- 3개월간의 애널리스트 지원
자주 묻는 질문
목차
제1장 서론
제2장 조사 방법
제3장 주요 요약
제4장 시장 구도
제5장 시장 규모와 성장 예측
제6장 경쟁 구도
제7장 시장 기회와 향후 전망
JHSAccording to Mordor Intelligence, building inspection services market size in 2026 is estimated at USD 10.47 billion, growing from 2025 value of USD 9.76 billion with 2031 projections showing USD 14.84 billion, growing at 7.24% CAGR over 2026-2031.
This report is Segmented by Service (Home Inspection Services, Specific Element Inspection Services, and More), Sourcing Type (In-House Services, Outsourced Services), Application (Residential, Commercial, Others), End User (Real-Estate Agencies & Brokers, Property Owners & Investors, and More), and Geography (North America, and More). The Market Forecasts are Provided in Terms of Value (USD).
Global Building Inspection Services Market Trends and Insights
Stricter Building-Safety Regulations & Codes
The 2024 International Building Code introduces tornado load metrics, higher wind-resistance thresholds, and universal carbon-monoxide detection, raising baseline inspection complexity. Ontario eliminated 1,730 provincial code variations in 2024, streamlining compliance while keeping rigorous safety checks. California's SB-721 requires deck inspections for multifamily properties by January 2025, generating a new niche for specialists. These policies increase the value of third-party inspection certificates and encourage continual professional development among providers.
Growing Volume of Real-Estate Transactions
Stabilizing mortgage rates are reviving housing turnover; the National Association of REALTORS projects a 9% increase in U.S. home sales during 2025. Canadian home sales advanced 10% in 2024 despite regulatory shifts that eased stress-test rules and raised insured mortgage caps. State legislation, such as the pending Massachusetts bill that disallows inspection waivers, underscores regulatory momentum for mandatory assessments. Commercial real-estate deals in data-center and renewable-energy assets add incremental inspection demand. The surge tightens capacity because certified inspectors remain in short supply, nudging service prices upward in tight local markets.
Highly Fragmented Provider Landscape & Price Pressure
Thousands of sole proprietors and small regional firms compete on commodity home inspection work, keeping average ticket prices flat in many U.S. metros. Private equity funds continue to consolidate niche providers, aiming to build national footprints with data-driven scheduling and cross-selling synergies. Despite ongoing deals, the top five firms still account for well under one-third of global revenue, so price competition remains intense for routine assignments. Operators differentiate by investing in specialized services such as energy auditing, facade safety certifications, and drone-enabled facade scans that command premium rates. Customers reward end-to-end platforms that blend on-site data capture with cloud-based analytics and digital report delivery.
Other drivers and restraints analyzed in the detailed report include:
- Ageing Building Stock in OECD Economies
- Rapid Uptake of Drone-Based Aerial Inspection
- Shortage of Certified Inspectors
For complete list of drivers and restraints, kindly check the Table Of Contents.
Segment Analysis
Home Inspection Services captured 44.12% of the building inspection services market share in 2025 as transaction-driven demand rebounded. Many U.S. states are revoking waiver clauses, so every residential deal now requires a certified report, lifting unit volumes. Commercial Building Inspection Services grew steadily because data center, logistics, and renewable-energy projects incorporate inspection milestones tied to financing schedules. The building inspection services market size for Other Specialised Services is projected to widen at an 8.74% CAGR, fueled by energy audits, drone surveys, and AI-enabled facade analytics.
Providers are bundling thermal imaging, blower-door testing, and carbon-intensity calculations to meet Europe's zero-emission mandates. California's deck safety checks and Denver's mandatory ANSI/ASHRAE/ACCA 211-2018 Level 2 energy audits illustrate how niche regulations spark high-margin assignments. Firms that combine structural engineers with software developers create defensible competitive moats.
In-house inspection teams retained 56.21% of revenue in 2025 because large real-estate owners and facility managers prefer direct oversight. Yet the building inspection services market size for Outsourced Services is projected to climb at an 8.25% CAGR through 2031 as codes grow more complex and technologies evolve rapidly. External specialists spread tech costs across a diverse client base, making high-resolution lidar or AI platforms affordable for mid-sized owners.
Insurers and lenders increasingly require third-party certifications to reduce conflict-of-interest exposure. The Co-operators' 2024 acquisition of Carson Dunlop illustrates how insurance groups are vertically integrating to secure inspection expertise that handles more than 200,000 assignments annually. Outsourcing also mitigates labor shortages because national providers redeploy staff to hotspots, smoothing capacity imbalances.
Complete Report Scope:
- By Service
- Home Inspection Services
- Specific Element Inspection Services
- Commercial Building Inspection Services
- Other Specialised Services
- By Sourcing Type
- In-House Services
- Outsourced Services
- By Application
- Residential
- Commercial
- Others
- By End User
- Real-Estate Agencies & Brokers
- Property Owners & Investors
- Government & Municipalities
- Insurance & Financial Institutions
- Facility-Management Firms
- By Geography
- North America
- United States
- Canada
- Mexico
- South America
- Brazil
- Argentina
- Chile
- Rest of South America
- Europe
- United Kingdom
- Germany
- France
- Italy
- Spain
- Netherlands
- Rest of Europe
- Middle East and Africa
- Saudi Arabia
- United Arab Emirates
- Rest of Middle East and Africa
- Asia-Pacific
- China
- India
- Japan
- South Korea
- Australia
- Indonesia
- Rest of Asia-Pacific
- North America
Geography Analysis
North America remained the largest regional contributor in 2025, underpinned by stringent codes, a high replacement rate for aging stock, and technology-friendly regulators. The 2024 International Building Code update, plus state ordinances such as California's Title 24 revisions requiring solar and battery systems in new construction, expand inspection scope. The U.S. Department of Energy's formal definition of a zero-emissions building sets uniform guidance that inspection firms must validate before occupancy permits are issued. Capacity constraints, exemplified by the Oregon inspector shortfall, keep utilization rates high and support pricing.
Europe is the fastest-growing market because the Energy Performance of Buildings Directive mandates zero-emission status for all new structures by 2030 and for public buildings by 2028. Minimum energy-performance standards force upgrades on the worst-performing 16% of the stock, unlocking steady retrofit inspection work. Enhanced Energy Performance Certificates and building-renovation passports embed inspection checkpoints through the asset lifecycle, creating multi-year revenue visibility. Providers with thermal-imaging drones and lifecycle-carbon calculators are winning cross-border frameworks.
Asia-Pacific is experiencing robust expansion led by infrastructure spending and smart-city initiatives. Japan's construction output reached USD 609.27 billion in 2024 and is projected at USD 716.66 billion by 2029, sustaining demand for compliance verification and quality control. Bureau Veritas' acquisition of Australia-based APP Group in 2024 strengthened its footprint across large-scale transport projects, illustrating the region's consolidation trend. Disparate national codes still hamper cross-border standardization, but pan-regional clients favor firms that can navigate local requirements while deploying uniform digital platforms.
- SGS Group
- Bureau Veritas
- Intertek Group plc
- DEKRA SE
- NV5 Global
- AmeriSpec Inspection Services
- HouseMaster
- National Property Inspections
- Pillar To Post
- WIN Home Inspection
- SAFEbuilt
- Quality Built
- Criterium Engineers
- Houspect
- Resicert
- HomeTeam Inspection Service
- InterNACHI (International Association of Certified Home Inspectors)
- DEKRA Drone Inspection Services
- AeroSpect NY
- Drone Fly Inspect
Additional Benefits:
- The market estimate (ME) sheet in Excel format
- 3 months of analyst support
TABLE OF CONTENTS
1 Introduction
- 1.1 Study Assumptions & Market Definition
- 1.2 Scope of the Study
2 Research Methodology
3 Executive Summary
4 Market Landscape
- 4.1 Market Overview
- 4.2 Market Drivers
- 4.2.1 Growing volume of real-estate transactions
- 4.2.2 Stricter building-safety regulations & codes
- 4.2.3 Ageing building stock in OECD economies
- 4.2.4 Rapid uptake of drone-based aerial inspection
- 4.2.5 AI-enabled defect analytics in smart buildings
- 4.2.6 Net-zero mandates driving energy-audit demand
- 4.3 Market Restraints
- 4.3.1 Highly fragmented provider landscape & price pressure
- 4.3.2 Shortage of certified inspectors
- 4.3.3 Rising liability-insurance premiums
- 4.3.4 Privacy concerns around drone/remote inspections
- 4.4 Value / Supply-Chain Analysis
- 4.5 Regulatory Landscape & Government Initiatives
- 4.6 Technological Outlook
- 4.7 Economic & Market Scenario
- 4.8 Key Industry Trends
- 4.9 Industry Attractiveness - Porter's Five Forces Analysis
- 4.9.1 Threat of New Entrants
- 4.9.2 Bargaining Power of Suppliers
- 4.9.3 Bargaining Power of Buyers
- 4.9.4 Threat of Substitutes
- 4.9.5 Degree of Competitive Rivalry
5 Market Size & Growth Forecasts (Value, In USD Billion)
- 5.1 By Service
- 5.1.1 Home Inspection Services
- 5.1.2 Specific Element Inspection Services
- 5.1.3 Commercial Building Inspection Services
- 5.1.4 Other Specialised Services
- 5.2 By Sourcing Type
- 5.2.1 In-House Services
- 5.2.2 Outsourced Services
- 5.3 By Application
- 5.3.1 Residential
- 5.3.2 Commercial
- 5.3.3 Others
- 5.4 By End User
- 5.4.1 Real-Estate Agencies & Brokers
- 5.4.2 Property Owners & Investors
- 5.4.3 Government & Municipalities
- 5.4.4 Insurance & Financial Institutions
- 5.4.5 Facility-Management Firms
- 5.5 By Geography
- 5.5.1 North America
- 5.5.1.1 United States
- 5.5.1.2 Canada
- 5.5.1.3 Mexico
- 5.5.2 South America
- 5.5.2.1 Brazil
- 5.5.2.2 Argentina
- 5.5.2.3 Chile
- 5.5.2.4 Rest of South America
- 5.5.3 Europe
- 5.5.3.1 United Kingdom
- 5.5.3.2 Germany
- 5.5.3.3 France
- 5.5.3.4 Italy
- 5.5.3.5 Spain
- 5.5.3.6 Netherlands
- 5.5.3.7 Rest of Europe
- 5.5.4 Middle East and Africa
- 5.5.4.1 Saudi Arabia
- 5.5.4.2 United Arab Emirates
- 5.5.4.3 Rest of Middle East and Africa
- 5.5.5 Asia-Pacific
- 5.5.5.1 China
- 5.5.5.2 India
- 5.5.5.3 Japan
- 5.5.5.4 South Korea
- 5.5.5.5 Australia
- 5.5.5.6 Indonesia
- 5.5.5.7 Rest of Asia-Pacific
- 5.5.1 North America
6 Competitive Landscape
- 6.1 Market Concentration
- 6.2 Strategic Moves
- 6.3 Market Share Analysis
- 6.4 Company Profiles (includes Global level Overview, Market level overview, Core Segments, Financials as available, Strategic Information, Products & Services, and Recent Developments)
- 6.4.1 SGS Group
- 6.4.2 Bureau Veritas
- 6.4.3 Intertek Group plc
- 6.4.4 DEKRA SE
- 6.4.5 NV5 Global
- 6.4.6 AmeriSpec Inspection Services
- 6.4.7 HouseMaster
- 6.4.8 National Property Inspections
- 6.4.9 Pillar To Post
- 6.4.10 WIN Home Inspection
- 6.4.11 SAFEbuilt
- 6.4.12 Quality Built
- 6.4.13 Criterium Engineers
- 6.4.14 Houspect
- 6.4.15 Resicert
- 6.4.16 HomeTeam Inspection Service
- 6.4.17 InterNACHI (International Association of Certified Home Inspectors)
- 6.4.18 DEKRA Drone Inspection Services
- 6.4.19 AeroSpect NY
- 6.4.20 Drone Fly Inspect