|
시장보고서
상품코드
2116441
자외선 분광법 시장 : 점유율 분석, 업계 동향과 통계, 성장 예측(2026-2031년)UV Spectroscopy - Market Share Analysis, Industry Trends & Statistics, Growth Forecasts (2026 - 2031) |
||||||
 Mordor Intelligence
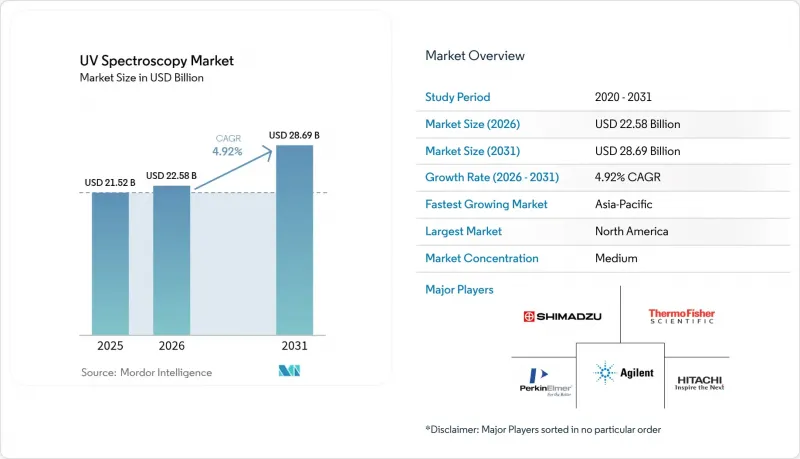
Mordor Intelligence에 의하면, 2026년 자외선 분광법 시장 규모는 225억 8,000만 달러로 추정되고 있어 2025년 215억 2,000만 달러에서 확대해, 2031년에는 286억 9,000만 달러에 이를 것으로 예측됩니다.
2026년부터 2031년까지 연평균 성장률(CAGR) 4.92%로 성장할 것으로 전망됩니다.
본 보고서는 장비 유형(탁상형 분광광도계 등), 기술(싱글 빔 등), 용도(의약품 품질 관리 및 출하 검사 등), 최종 사용자(제약·바이오기술 기업 등),지역(북미, 유럽, 아시아태평양, 중동 및 아프리카, 남미)별로 세분화되어 있습니다. 시장 전망은 금액(미 달러) 기준으로 제시되어 있습니다.
세계 자외선 분광법 시장 동향 및 인사이트
바이오의약품 품질 보증에 대한 수요 증가
현재 후기 단계의 의약품 개발에서는 바이오의약품 파이프라인이 주류를 이루고 있으며, 이에 따라 자외선 분광법 시장은 더욱 고감도의 단백질 분석으로 나아가고 있습니다. Solo VPE와 같은 가변 광로장형 장치를 사용하면 시료를 희석하지 않고도 최대 300 mg/mL의 항체 농도를 직접 측정할 수 있으며, 분석 시간을 몇 시간에서 몇 분으로 단축할 수 있습니다. 프로테인 A 크로마토그래피에서의 인라인 UV 모니터링은 숙주 세포 단백질의 제거율과 수율을 향상시키고, 실시간 제어에 관한 규제 당국의 ‘품질 설계(QbD)’ 요건을 충족시킵니다. 이에 대응하여 각 벤더는 1회의 스캔으로 농도와 순도 측정 결과를 출력하는 화학계측학 모델을 통합하고 있으며, 이를 통해 작업자의 업무 부담을 줄이고 배치 출시 속도를 향상시키고 있습니다. 바이오 제조 기업들이 연속 처리 플랫폼을 확대함에 따라, 견고하고 클린룸에 적합한 UV 프로브에 대한 수요는 계속해서 증가할 것으로 예상되며, 이는 UV 분광 시장의 평균 판매 가격을 끌어올릴 것입니다.
확대되는 현장 진단(Point-of-Care) 검사 수요
인구 통계학적 변화와 보다 신속한 임상 판단에 대한 요구로 인해, 분산형 환경에서의 소형 UV 장치 도입이 가속화되고 있습니다. 마이크로 볼륨 나노 분광광도계는 기존에는 중앙 검사실에 한정되었던 검사인 당뇨병성 신장 질환의 조기 선별 검사에 적합한 검출 한계로, 소변 내 알부민 및 크레아티닌을 정량합니다. 한 스타트업은 UV 광학 시스템과 AI 알고리즘을 결합하여 세포 치료의 세균 오염 결과를 30분 이내에 제공함으로써, 막 여과에 전형적인 14일간의 무균 확인 기간을 대체하고 있습니다. 아시아태평양의 각국 정부는 병원 혼잡 완화를 목적으로 POC(Point-of-Care) 기기 도입을 장려하고 있으며, 기기 제조업체들은 전자 건강 기록 플랫폼과 연동 가능한 충전식 블루투스 지원 장치를 잇달아 출시하고 있습니다. 광학, 마이크로플루이딕스공학, 머신러닝의 융합을 통해 자외선 분광법 시장은 기존의 의약품 품질 관리의 범위를 넘어 확장되고 있습니다.
GMP 준수 장비에 대한 고액의 설비 투자
완전한 GMP 인증 패키지, 21 CFR Part 11 준수 소프트웨어, 그리고 USP <857>의 추적성 요건으로 인해 UV 플랫폼의 초기 비용이 치솟고 있습니다. 파장 검증 키트가 포함된 탁상형 시스템의 가격은 8만 5,000달러를 초과하기도 하여, 소규모 제조업체나 공공 기관의 연구소에게는 큰 장벽이 되고 있습니다. 인증 중고 프로그램을 통해 제공되는 재생 제품이라 하더라도 재인증 및 문서화에 추가 비용이 발생하며, 그 비용은 구매 가격과 맞먹는 경우가 많습니다. 신흥 시장의 기업들은 높은 수입 관세와 현지 검증 전문 지식의 부족에 직면해 있어 투자 회수 기간이 길어지고 있습니다. 자금 조달 수단이나 리스 모델이 보급되지 않는 한, 이러한 경제적 요인으로 인해 UV 분광 시장에서 가격에 가장 민감한 계층에서의 장비 보급이 억제될 것입니다.
부문 분석
2025년에는 뛰어난 광도 측정 정확도, 견고한 인증 키트, 그리고 폭넓은 액세서리 생태계 덕분에 벤치탑형 장비가 자외선 분광법 시장 규모의 55.12%를 차지하며 판매를 주도했습니다. 대형 제약 공장에서는 여러 거점 간의 분석법 전환을 통일하고 FDA의 분석법 검증 요건을 준수할 수 있기 때문에 표준화된 듀얼 빔 플랫폼이 선호되고 있습니다. 한편, 휴대용/핸드헬드형 장치는 POC(Point-of-Care) 진단, 현장 수질 검사 및 연속 제조 시설에서의 원료 검증을 원동력으로 7.12%의 연평균 복합 성장률(CAGR)로 가장 빠른 대수 성장을 기록했습니다. 각 벤더사는 마이크로 전기 기계식 미러와 광대역 주파수 콤을 사용하여 광학 레이아웃을 개선함으로써, 과거에는 플래그십급 벤치탑 장비에만 국한되었던 최대 1,000만 분해능을 실현하고 있습니다.
경쟁 환경에서는 소형화된 광학 시스템과 클린룸 소독제에 견딜 수 있는 견고한 케이스를 결합한 기업이 유리합니다. 암호화된 스펙트럼을 중앙 서버로 스트리밍하는 클라우드 지원 펌웨어는 데이터 집계 시간을 단축하며, 이 기능은 규제 당국으로부터도 지지를 얻고 있습니다. 분산형 의료 모델이 성숙해짐에 따라 휴대용 기기가 주류가 될 것입니다. 다만, 규제가 엄격한 배치 출시 환경에서는 탁상형 장비가 계속해서 UV 분광 시장의 대부분을 차지할 것으로 전망됩니다.
2025년에도 듀얼 빔 광학 시스템은 매출 점유율 41.10%를 계속 유지할 것으로 보이며, 안정성 시험에 전형적인 장시간 분석 실행 중 베이스라인의 안정성이 높이 평가되고 있습니다. 그럼에도 불구하고, 다이오드 어레이 구성은 연평균 성장률(CAGR) 7.33%로 성장을 지속하고, 있으며, 2031년까지 다른 설계를 앞지르는 속도로 성장할 전망입니다. 밀리초 단위로 전체 스펙트럼을 포착할 수 있는 이 기능은 ICH Q1 가이드라인에 필수적인 피크 순도 확인 및 강제 열화 프로파일링을 지원합니다. 단일 빔형 장치는 비용을 중시하는 연구실에서 계속 사용되고 있지만, 200 nm 미만으로 작동하는 심자외선(deep-UV)형은 유전자 치료 연구에서 고소광 단백질 검출에 대한 수요 증가에 부응하고 있습니다.
각 장비 제조업체는 극도로 높은 흡광도 값에서도 선형성을 유지하는 홀로그래픽 그레이팅을 채택하고, 미광 억제에 막대한 투자를 하고 있습니다. 소프트웨어의 발전으로 머신러닝을 활용한 스펙트럼 라이브러리 대조 기능이 통합되어, 수동 데이터 검토를 최대 40%까지 줄이고 있습니다. 하드웨어의 정밀도와 알고리즘을 통한 분석의 융합이 차별화를 강화하여, 자외선 분광법 시장에서 이 분야의 프리미엄 가격대를 유지하고 있습니다.
지역별 분석
북미는 견고한 바이오의약품 인프라, FDA의 엄격한 감독, 주요 분석 기기 브랜드의 현지 생산 거점 덕분에 2025년 세계 매출의 42.00%를 차지하며 가장 큰 기여도를 유지했습니다. 'CHIPS and Science Act'와 같은 정부의 경제 부양책은 정밀 광학 부품의 국내 생산을 더욱 촉진하고 공급망의 탄력성을 높이고 있습니다. 유럽은 EMA(유럽의약품청)의 규제 조화와 확대되는 바이오의약품 수탁 제조 네트워크에 힘입어 북미에 근소한 차이로 뒤를 잇고 있습니다.
한편, 아시아태평양은 연평균 성장률(CAGR) 6.18%라는 가장 강력한 성장세를 보이고 있으며, 2030년까지 장비 수요 증가분의 3분의 1 이상을 차지할 것으로 예측됩니다. 인도의 ‘생산 연계형 인센티브 제도’와 중국에서 첨단 치료제를 대상으로 한 수십억 달러 규모의 성(省) 차원 보조금 덕분에 신규 공장 건설이 가속화되고 있습니다. 2027년부터 연간 1만 대의 UV-가시광선 분석기를 생산할 수 있는 카르나타카주 공장 건설을 결정한 시마즈 제작소의 사례는 이러한 현지화 추세를 여실히 보여줍니다. 일본과 한국은 유전자 치료 및 세포 치료 파이프라인에서의 지속적인 혁신을 통해 높은 단가를 유지하고 있는 반면, 동남아시아 국가들은 지방 진료소에서의 POC(Point-of-Care) 기기 도입을 우선시하고 있습니다.
중동 및 아프리카 및 남미는 여전히 초기 단계에 있지만, 현지 규제 당국이 의약품 안전성 감시 체계를 강화함에 따라 관심이 높아지고 있습니다. 브라질 ANVISA 지침에서는 현재 USP <857>의 성능 검사가 참조되고 있으며, 노후화된 싱글 빔 모델의 교체가 진행되고 있습니다. 걸프협력회의(GCC) 회원국들은 자유무역지역 내 바이오의약품 충전 및 포장 시설에 투자하고 있으며, 통합형 UV 모니터링 스키드의 초기 주문을 주도하고 있습니다. 이러한 동향들이 맞물리면서, 향후 5년 동안 자외선 분광법 시장이 지리적으로 더욱 확대될 것으로 확실시되고 있습니다.
기타 혜택:
- 엑셀 형식 시장 예측(ME) 시트
- 3개월간의 애널리스트 지원
자주 묻는 질문
목차
제1장 서론
제2장 조사 방법
제3장 주요 요약
제4장 시장 구도
제5장 시장 규모와 성장 예측
제6장 경쟁 구도
제7장 시장 기회와 향후 전망
JHSAccording to Mordor Intelligence, UV spectroscopy market size in 2026 is estimated at USD 22.58 billion, growing from 2025 value of USD 21.52 billion with 2031 projections showing USD 28.69 billion, growing at 4.92% CAGR over 2026-2031.
This report is Segmented by Instrument Type (Benchtop Spectrophotometers, and More), Technology (Single-Beam, and More), Application (Drug Quality Control & Release Testing, and More), End User (Pharmaceutical & Biotech Companies, and More), and Geography (North America, Europe, Asia-Pacific, Middle East & Africa, South America). The Market Forecasts are Provided in Terms of Value (USD).
Global UV Spectroscopy Market Trends and Insights
Escalating Demand for Biologics Quality Assurance
Biologics pipelines now dominate late-stage drug development, pushing the UV spectroscopy market toward higher-sensitivity protein analytics. Variable-pathlength instruments such as the Solo VPE allow direct measurement of antibody concentrations up to 300 mg/mL without sample dilution, cutting assay time from hours to minutes. Inline UV monitoring of Protein A chromatography improves host-cell-protein clearance and yields, aligning with regulators' Quality by Design expectations for real-time control. Vendors respond by integrating chemometric models that deliver concentration and purity outputs in a single scan, reducing operator workload and improving batch release speeds. As biomanufacturers scale continuous-processing platforms, demand for rugged, cleanroom-compatible UV probes should continue to rise, lifting average selling prices within the UV spectroscopy market.
Expanding Point-of-Care Diagnostic Testing Needs
Demographic shifts and the quest for faster clinical decisions are accelerating adoption of compact UV devices in decentralized settings. Microvolume nano-spectrophotometers quantify urinary albumin and creatinine at detection limits suitable for early diabetic kidney disease screening, a test traditionally confined to central laboratories. Start-ups have paired UV optics with AI algorithms to deliver bacteriological contamination results for cell therapies in under 30 minutes, replacing the 14-day sterility window typical of membrane filtration. Governments in Asia-Pacific back POC deployment to relieve hospital congestion, and instrument makers are introducing rechargeable, Bluetooth-enabled units that sync with electronic health-record platforms. This convergence between optics, microfluidics, and machine learning enlarges the UV spectroscopy market beyond classic pharmaceutical quality control.
High Capital Expenditure for GMP-Compliant Instruments
Full GMP qualification packages, 21 CFR Part 11 software, and USP <857> traceability requirements elevate upfront costs for UV platforms. A benchtop system bundled with wavelength validation kits can exceed USD 85,000, a hurdle for small manufacturers and public-sector laboratories. Even refurbished units offered under certified pre-owned programs incur added spend on re-qualification and documentation, often matching the purchase price. Emerging-market firms face higher import duties and scarce local validation expertise, extending payback periods. Unless financing tools or leasing models proliferate, these economics will curb unit penetration in the most price-sensitive tiers of the UV spectroscopy market.
Other drivers and restraints analyzed in the detailed report include:
- Regulatory Emphasis on Pharma Data Integrity
- Growth in Clinical Research and CRO Outsourcing
- Limited Skilled Workforce in Clinical Spectroscopy
For complete list of drivers and restraints, kindly check the Table Of Contents.
Segment Analysis
Benchtop units dominated sales with 55.12% of the UV spectroscopy market size in 2025 thanks to their superior photometric accuracy, robust qualification kits, and broad accessory ecosystems. Large pharma plants prefer standardized dual-beam platforms because they harmonize method transfer across multiple sites and align with FDA method-verification requirements. Portable/hand-held devices, however, posted the fastest unit growth at a 7.12% CAGR, fueled by POC diagnostics, on-site water testing, and raw-material verification in continuous-manufacturing suites. Vendors have improved optical layouts using micro-electromechanical mirrors and broadband frequency combs, achieving resolving power of up to 10 million-performance once limited to flagship benchtop instruments.
Competitive dynamics favor companies that combine miniaturized optics with rugged casings able to withstand cleanroom disinfectants. Cloud-ready firmware that streams encrypted spectra to centralized servers reduces data-aggregation time, a feature gaining regulatory favor. As decentralized healthcare models mature, portable formats will become mainstream, although benchtop units will keep commanding the lion's share of the UV spectroscopy market in highly regulated batch-release environments.
Dual-beam optics continued to hold 41.10% revenue share in 2025, admired for baseline stability during long analytical runs typical of stability studies. Diode-array configurations nonetheless logged a 7.33% CAGR and are positioned to outpace other designs through 2031. Their ability to capture entire spectra in milliseconds supports peak-purity checks and forced-degradation profiling, activities integral to ICH Q1 guidelines. Single-beam instruments survive in cost-sensitive labs, while deep-UV variants, operating below 200 nm, meet rising demand for high-extinction protein detection in gene-therapy research.
Instrument makers invest heavily in stray-light suppression, using holographic gratings that retain linearity even at extremely high absorbance values. Software advances embed spectral-library matching powered by machine learning, reducing manual data review by up to 40%. The blend of hardware precision and algorithmic analytics strengthens differentiation, sustaining premium price bands in this slice of the UV spectroscopy market.
Complete Report Scope:
- By Instrument Type
- Benchtop Spectrophotometers
- Microvolume Nano-Spectrophotometers
- Portable / Hand-Held Devices
- In-Line Process Sensors
- By Technology
- Single-Beam
- Dual-Beam
- Diode-Array
- Deep-UV Systems
- By Application
- Drug Quality Control & Release Testing
- Clinical Diagnostics (Blood & Urine Analysis)
- Genomics & Proteomics Quantification
- Bioprocess Monitoring & PAT
- Academic & Translational Research
- By End User
- Pharmaceutical & Biotech Companies
- Contract Research & Manufacturing Organizations (CROs/CDMOs)
- Hospitals & Diagnostic Laboratories
- Academic Medical Centers
- Public Health & Regulatory Agencies
- Geography
- North America
- United States
- Canada
- Mexico
- Europe
- Germany
- United Kingdom
- France
- Italy
- Spain
- Rest of Europe
- Asia-Pacific
- China
- Japan
- India
- Australia
- South Korea
- Rest of Asia-Pacific
- Middle East & Africa
- GCC
- South Africa
- Rest of Middle East & Africa
- South America
- Brazil
- Argentina
- Rest of South America
- North America
Geography Analysis
North America maintained the largest contribution to global revenue with 42.00% in 2025 due to robust biopharma infrastructure, stringent FDA oversight, and local manufacturing bases for major analytical brands. Government stimulus-such as the CHIPS and Science Act-further encourages domestic production of precision optics, reinforcing supply-chain resilience. Europe follows closely, propelled by harmonized EMA regulations and an expanding biologics contract-manufacturing network.
Asia-Pacific, however, delivered the strongest growth momentum at a 6.18% CAGR and is expected to account for over one-third of incremental instrument demand by 2030. India's Production-Linked Incentive scheme and China's multi-billion-dollar provincial grants for advanced therapeutics are accelerating greenfield plant construction. Shimadzu's decision to build a Karnataka factory capable of producing 10,000 UV-visible units annually from 2027 exemplifies the localization trend. Japan and South Korea sustain high unit value through continued innovation in gene and cell-therapy pipelines, while Southeast Asian states prioritize POC deployment in rural clinics.
Middle East & Africa and South America remain early-stage but show rising interest as local regulators strengthen pharmacovigilance frameworks. Brazilian ANVISA guidelines now reference USP <857>performance checks, prompting replacement of aging single-beam models. Gulf Cooperation Council countries invest in biologics fill-finish facilities within free-trade zones, driving initial orders for integrated UV monitoring skids. Collectively, these dynamics ensure the geographic spread of the UV spectroscopy market will broaden over the next five years.
- Agilent Technologies
- Thermo Fisher Scientific
- Shimadzu
- PerkinElmer
- Hitachi
- Bruker
- JASCO Inc.
- Analytik Jena GmbH
- Mettler Toledo (Implen)
- Hach Company
- Ocean Insight
- Biochrom Ltd.
- Cecil Instruments Ltd.
- Buck Scientific Inc.
- Cole-Parmer (Antylia)
- Scinco Co., Ltd.
- Metrohm
- Malvern Panalytical
- Jeol Ltd.
- Edinburgh Instruments
Additional Benefits:
- The market estimate (ME) sheet in Excel format
- 3 months of analyst support
TABLE OF CONTENTS
1 Introduction
- 1.1 Study Assumptions & Market Definition
- 1.2 Scope of the Study
2 Research Methodology
3 Executive Summary
4 Market Landscape
- 4.1 Market Overview
- 4.2 Market Drivers
- 4.2.1 Escalating Demand for Biologics Quality Assurance
- 4.2.2 Expanding Point-of-Care Diagnostic Testing Needs
- 4.2.3 Regulatory Emphasis on Pharma Data Integrity
- 4.2.4 Growth In Clinical Research and CRO Outsourcing
- 4.2.5 Integration of UV Microvolume Nano-Spectroscopy in Genomics
- 4.2.6 Adoption of Continuous Manufacturing With in-Line PAT Sensors
- 4.3 Market Restraints
- 4.3.1 High Capital Expenditure for GMP-Compliant Instruments
- 4.3.2 Limited Skilled Workforce in Clinical Spectroscopy
- 4.3.3 Stringent Validation and Calibration Protocols
- 4.3.4 Competition from Label-Free Optical Biosensors
- 4.4 Regulatory Landscape
- 4.5 Porter's Five Forces Analysis
- 4.5.1 Threat of New Entrants
- 4.5.2 Bargaining Power of Buyers
- 4.5.3 Bargaining Power of Suppliers
- 4.5.4 Threat of Substitutes
- 4.5.5 Competitive Rivalry
5 Market Size & Growth Forecasts (Value, USD)
- 5.1 By Instrument Type
- 5.1.1 Benchtop Spectrophotometers
- 5.1.2 Microvolume Nano-Spectrophotometers
- 5.1.3 Portable / Hand-Held Devices
- 5.1.4 In-Line Process Sensors
- 5.2 By Technology
- 5.2.1 Single-Beam
- 5.2.2 Dual-Beam
- 5.2.3 Diode-Array
- 5.2.4 Deep-UV Systems
- 5.3 By Application
- 5.3.1 Drug Quality Control & Release Testing
- 5.3.2 Clinical Diagnostics (Blood & Urine Analysis)
- 5.3.3 Genomics & Proteomics Quantification
- 5.3.4 Bioprocess Monitoring & PAT
- 5.3.5 Academic & Translational Research
- 5.4 By End User
- 5.4.1 Pharmaceutical & Biotech Companies
- 5.4.2 Contract Research & Manufacturing Organizations (CROs/CDMOs)
- 5.4.3 Hospitals & Diagnostic Laboratories
- 5.4.4 Academic Medical Centers
- 5.4.5 Public Health & Regulatory Agencies
- 5.5 Geography
- 5.5.1 North America
- 5.5.1.1 United States
- 5.5.1.2 Canada
- 5.5.1.3 Mexico
- 5.5.2 Europe
- 5.5.2.1 Germany
- 5.5.2.2 United Kingdom
- 5.5.2.3 France
- 5.5.2.4 Italy
- 5.5.2.5 Spain
- 5.5.2.6 Rest of Europe
- 5.5.3 Asia-Pacific
- 5.5.3.1 China
- 5.5.3.2 Japan
- 5.5.3.3 India
- 5.5.3.4 Australia
- 5.5.3.5 South Korea
- 5.5.3.6 Rest of Asia-Pacific
- 5.5.4 Middle East & Africa
- 5.5.4.1 GCC
- 5.5.4.2 South Africa
- 5.5.4.3 Rest of Middle East & Africa
- 5.5.5 South America
- 5.5.5.1 Brazil
- 5.5.5.2 Argentina
- 5.5.5.3 Rest of South America
- 5.5.1 North America
6 Competitive Landscape
- 6.1 Market Concentration
- 6.2 Market Share Analysis
- 6.3 Company Profiles (Includes Global Level Overview, Market Level Overview, Core Segments, Financials As Available, Strategic Information, Market Rank/Share, Products & Services, Recent Developments)
- 6.3.1 Agilent Technologies, Inc.
- 6.3.2 Thermo Fisher Scientific, Inc.
- 6.3.3 Shimadzu Corporation
- 6.3.4 PerkinElmer Inc.
- 6.3.5 Hitachi High-Tech Corporation
- 6.3.6 Bruker Corporation
- 6.3.7 JASCO Inc.
- 6.3.8 Analytik Jena GmbH
- 6.3.9 Mettler Toledo (Implen)
- 6.3.10 Hach Company
- 6.3.11 Ocean Insight
- 6.3.12 Biochrom Ltd.
- 6.3.13 Cecil Instruments Ltd.
- 6.3.14 Buck Scientific Inc.
- 6.3.15 Cole-Parmer (Antylia)
- 6.3.16 Scinco Co., Ltd.
- 6.3.17 Metrohm AG
- 6.3.18 Malvern Panalytical
- 6.3.19 Jeol Ltd.
- 6.3.20 Edinburgh Instruments
7 Market Opportunities & Future Outlook
- 7.1 White-Space & Unmet-Need Assessment