

|
시장보고서
상품코드
2116779
아프리카의 재생에너지 시장 : 점유율 분석, 업계 동향과 통계, 성장 예측(2026-2031년)Africa Renewable Energy - Market Share Analysis, Industry Trends & Statistics, Growth Forecasts (2026 - 2031) |
||||||
 Mordor Intelligence
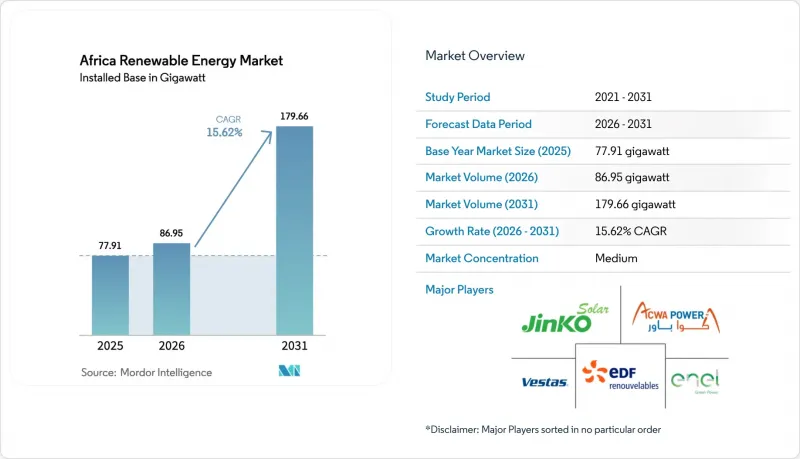
Mordor Intelligence에 의하면, 아프리카 재생에너지 시장 규모(설치용량 기반)는 2025년 77.91기가와트, 2026년 86.95기가와트에서, 2031년까지 179.66기가와트로 확대되어 2026년부터 2031년까지 CAGR 15.62%를 나타낼 것으로 예측됩니다.
본 보고서는 기술별(태양광 발전, 풍력 발전, 수력 발전, 바이오에너지, 지열 발전, 해양 에너지), 최종 사용자별(유틸리티, 상업 및 산업, 주거), 지역별(남아프리카공화국, 이집트, 나이지리아, 모로코, 알제리, 에티오피아,케냐, 가나 및 기타 아프리카 국가)로 분류되어 있습니다. 시장 규모 및 전망은 설치 용량(GW) 기준으로 제시되어 있습니다.
아프리카 재생에너지 시장 동향 및 인사이트
태양광(PV) 설비 투자(CAPEX)의 급격한 감소
2025년, 이집트와 모로코에서는 대규모 태양광 발전 입찰 가격이 1kWh당 0.03달러 미만으로 떨어져, 신규 석탄·가스 발전보다 40% 이상 저렴해졌습니다. 전 세계적인 폴리실리콘 공급 과잉과 수요 부진이 겹치면서, 2026년 초 모듈 가격은 1와트당 0.12달러까지 하락했습니다. 남아프리카공화국의 ‘입찰 윈도우 7’에서는 2.6GW가 평균 0.025달러/kWh에 낙찰되어, 10년 전 첫 입찰에 비해 60%의 가격 하락을 기록했습니다. 알제리의 1GW 규모 태양광 발전 입찰에서는 kWh당 0.028달러의 상한가가 설정되었으며, 4시간용 리튬이온 축전 시스템과 결합할 경우 태양광 발전이 가장 저렴한 베이스로드 전원이란 사실이 확인되었습니다. 이러한 경제성 덕분에 20년간의 고정가격 전력구매계약(PPA)이 가능해졌으며, 다자간 금융기관으로부터의 대출 기간을 고정함으로써 아프리카 재생에너지 시장이 환율 리스크라는 장벽을 극복하는 데 일조하고 있습니다.
남아프리카공화국의 대규모 풍력 발전 프로젝트 파이프라인 확대
남아프리카공화국의 풍력 발전 파이프라인은 2024년에 48GW에 달하며, 그 대부분은 가동률이 40% 이상의 노던케이프주와 이스턴케이프주에 집중되어 있습니다. 입찰 윈도우 5-7에서는 송전망과의 통합을 원활하게 하기 위해 상업 운전 개시 시기를 2029년까지 단계적으로 설정하여, 총 5.3GW가 낙찰되었습니다. 에스콤(Eskom)은 전압 이상을 일으키지 않고 흡수할 수 있는 변동형 재생에너지의 양이 연간 2GW로 제한되어 있기 때문에 해당 지역에 설치된 축전지를 활용하거나 관리된 출력 억제를 실시할 수밖에 없습니다. 베스타스는 나셀을 현지에서 조립함으로써 국내 조달 요건을 충족하고 물류 비용을 절감하여 1.2GW 규모의 터빈 수주를 확보했습니다. 한편, 케냐의 310MW 투르카나 호수 풍력 발전소는 400km의 송전 거리가 있고, 외딴 지역에 위치한 프로젝트임에도 불구하고 부채 상환 배율을 1.4배 이상으로 유지할 수 있음을 입증했습니다.
송전망의 낮은 안정성과 출력 억제 위험
에스콤은 2024년, 태양광 발전의 피크 시간대나 저녁 시간대의 풍력 발전 급증에 대응할 수 없는 유연성이 부족한 석탄 화력 발전소 때문에 총 발전량의 12%에 해당하는 4,363 GWh의 재생에너지 발전을 제한했습니다. 케냐의 송전 시스템 운영자는 로이앙갈라니-수스와 송전선로의 전압 변동을 이유로 2025년에 타카나 호수 풍력 발전소의 발전을 18% 시간대에 걸쳐 제한했습니다. 이집트에서는 2024년에 주파수가 49.8-50.2 Hz 범위를 벗어났기 때문에 벤반 태양광 발전소의 일부를 200시간 동안 전력망에서 차단했습니다. 이러한 사태는 프로젝트의 설비 가동률을 은행 측의 예상보다 낮은 수준으로 끌어내려, 대출 조건 재협상을 초래하게 됩니다. 남아프리카공화국의 2025년 송전망 규정 개정에 따라 신규 프로젝트에는 2시간 분량의 에너지 저장 설비 설치가 의무화되었습니다. 이로 인해 kW당 300달러의 추가 비용이 발생하지만, 출력 억제 위험이 완화되어 아프리카 재생에너지 시장의 리스크 프로파일이 강화됩니다.
부문별 분석
태양광 발전 설비는 가장 빠르게 성장하는 기술로 두각을 나타내고 있으며, 2026년부터 2031년까지 연평균 성장률(CAGR) 27.84%를 나타낼 것으로 전망됩니다. 한편, 2025년 아프리카 재생에너지 시장 점유율에서는 수력 발전이 62.25%로 압도적인 비중을 차지했습니다. 이집트의 1.8 GW 벤반 클러스터 및 500 MW 콤 옴보의 추가 도입은 2,500 kWh/m2를 초과하는 사막의 일사량 덕분에 트래커를 사용하지 않고도 28%의 설비 가동률을 달성할 수 있음을 보여줍니다. 모로코의 누르 콤플렉스는 580 MW의 집중형 태양열 발전과 용융염 축열 시스템을 통합하여 7시간의 조절 가능성을 실현하고 있으며, 이를 통해 순수 태양광 발전(PV)보다 높은 프리미엄 가격을 확보하고 있습니다. 풍력 발전은 남아프리카공화국의 48GW에 달하는 개발 계획과 케냐의 검증된 높은 가동률을 보이는 발전소에서 혜택을 보고 있지만, 해상 풍력 발전 활동은 여전히 예비 타당성 조사 단계에 머물러 있습니다. 조달 규모 확대, 모듈 가격 하락, 그리고 축전지 비용 감소에 따라 풍력과 태양광을 합친 아프리카의 재생에너지 시장 규모는 2029년까지 수력발전을 넘어설 것으로 예측됩니다.
800억 달러 규모의 그랜드 잉가 프로젝트가 정체되어 있는 사례에서 볼 수 있듯이, 사회적 반대로 인해 거대 댐 건설 계획이 억제됨에 따라 수력 발전의 점유율은 점차 낮아질 전망입니다. 하천 이용형 및 양수 발전 방식은 주민 이주의 부담이 비교적 적다는 점에서 지지를 얻고 있습니다. 케냐는 지열 발전을 선도하고 있으며, 오르칼리아에서 985 MW를 가동 중이고, 2024년에는 83 MW 규모의 발전 설비가 가동을 시작할 예정입니다. 리프트 밸리의 지질적 특성을 활용하여 베이스로드 전력을 공급하고 있습니다. 바이오에너지 및 해양 에너지 시범 사업은 여전히 소규모이지만, 남아프리카공화국의 도시 쓰레기 발전은 아프리카 재생에너지 시장의 기술 구성이 서서히 다양화되고 있음을 보여줍니다.
기타 혜택:
- 엑셀 형식 시장 예측(ME) 시트
- 3개월간 애널리스트의 지원
자주 묻는 질문
목차
제1장 서론
제2장 조사 방법
제3장 주요 요약
제4장 시장 구도
제5장 시장 규모와 성장 예측
제6장 경쟁 구도
제7장 시장 기회와 향후 전망
JHS 26.08.28According to Mordor Intelligence, the Africa renewable energy market size in terms of installed base is projected to expand from 77.91 gigawatt in 2025 and 86.95 gigawatt in 2026 to 179.66 gigawatt by 2031, registering a CAGR of 15.62% between 2026 to 2031.
This report is Segmented by Technology (Solar Energy, Wind Energy, Hydropower, Bioenergy, Geothermal, and Ocean Energy), End-User (Utilities, Commercial and Industrial, and Residential), and Geography (South Africa, Egypt, Nigeria, Morocco, Algeria, Ethiopia, Kenya, Ghana, and Rest of Africa). The Market Sizes and Forecasts are Provided in Terms of Installed Capacity (GW).
Africa Renewable Energy Market Trends and Insights
Rapid Decline in Solar PV CAPEX
Auction tariffs for utility-scale solar dropped below USD 0.03 per kWh in Egypt and Morocco during 2025, undercutting new coal and gas by more than 40%. Module prices fell to USD 0.12 per watt in early 2026 as global polysilicon oversupply met tepid demand. Bid Window 7 in South Africa cleared 2.6 GW at an average USD 0.025 per kWh, a 60% reduction from the inaugural round ten years earlier. Algeria's 1 GW solar tender set a ceiling price of USD 0.028 per kWh, confirming photovoltaics as the least-cost baseload option when paired with four-hour lithium-ion storage. These economics allow 20-year fixed-price PPAs, locking in debt tenors from multilateral lenders and helping the Africa renewable energy market overcome currency-risk hurdles.
Utility-Scale Wind Project Pipeline Acceleration in South Africa
South Africa's wind queue reached 48 GW in 2024, clustered in the Northern and Eastern Capes, where capacity factors top 40%. Bid Windows 5-7 collectively awarded 5.3 GW with commercial operation dates sequenced to 2029 to ease grid integration. Eskom can only absorb 2 GW of variable renewables each year without voltage events, forcing co-located batteries or managed curtailment. Vestas captured 1.2 GW of turbine orders by assembling nacelles locally, satisfying domestic-content rules and trimming logistics costs. Kenya's 310 MW Lake Turkana wind farm, meanwhile, proved remote projects can maintain debt-service coverage above 1.4x even when wheeling power 400 km.
Weak Grid Stability & Curtailment Risk
Eskom curtailed 4,363 GWh of renewables in 2024, 12% of total output, due to inflexible coal plants that cannot track solar peaks and evening wind ramps. Kenya's grid operator restricted Lake Turkana's output during 18% of hours in 2025 after voltage excursions on the Loiyangalani-Suswa line. Egypt disconnected sections of the Benban park for 200 hours in 2024 as frequency strayed outside the 49.8-50.2 Hz band. Such events depress project capacity factors below bank-case assumptions, triggering loan renegotiations. South Africa's 2025 Grid Code Amendment now mandates two-hour storage on new projects, adding USD 300 per kW but reducing curtailment exposure and strengthening the Africa renewable energy market's risk profile.
Other drivers and restraints analyzed in the detailed report include:
- Mini-Grid Programs Backed by DFI Concessional Funding
- Emerging Green-Hydrogen Export Hubs
- Currency-Convertibility Limitations for IPPs
For complete list of drivers and restraints, kindly check the Table Of Contents.
Segment Analysis
Solar installations stand out as the fastest-growing technology, with a 27.84% CAGR projected from 2026 to 2031, while hydropower accounted for a dominant 62.25% of the Africa renewable energy market share in 2025. Egypt's 1.8 GW Benban cluster and 500 MW Kom Ombo additions showcase how desert irradiance above 2,500 kWh/m2 enables 28% capacity factors without trackers. Morocco's Noor complex integrates 580 MW of concentrated solar power with molten-salt storage, achieving seven-hour dispatchability that commands a premium over pure PV. Wind benefits from South Africa's 48 GW pipeline and Kenya's proven high-factor sites, yet offshore activity remains limited to pre-feasibility studies. The Africa renewable energy market size for wind and solar combined is forecast to eclipse hydropower by 2029 as procurement windows accelerate, module prices retreat, and battery costs drop.
Hydropower's share will erode gradually as social opposition curtails mega-dam ambitions, exemplified by the stalled USD 80 billion Grand Inga project. Run-of-river and pumped-storage schemes gain favor for their lighter resettlement footprint. Kenya leads geothermal with 985 MW at Olkaria and an 83 MW unit commissioned in 2024, leveraging Rift Valley geology for baseload supply. Bioenergy and ocean-energy pilots remain small, but municipal waste-to-power in South Africa signals a gradual broadening of the Africa renewable energy market technology mix.
Complete Report Scope:
- By Technology
- Solar Energy (PV and CSP)
- Wind Energy (Onshore and Offshore)
- Hydropower (Small, Large, PSH)
- Bioenergy
- Geothermal
- Ocean Energy (Tidal and Wave)
- By End-User
- Utilities
- Commercial and Industrial
- Residential
- By Geography
- South Africa
- Egypt
- Nigeria
- Morocco
- Algeria
- Ethiopia
- Kenya
- Ghana
- Rest of Africa
List of Companies Covered in this Report:
- Vestas Wind Systems A/S
- Juwi Holding AG
- ACWA Power
- Enel Green Power S.p.A.
- EDF Renewables
- Acciona SA
- JinkoSolar Holding Co. Ltd
- Canadian Solar Inc.
- First Solar Inc.
- Hidroelectrica de Cahora Bassa S.A.
- Scatec ASA
- Mainstream Renewable Power
- Siemens Gamesa Renewable Energy
- BTE Renewable
- Orsted A/S
- TotalEnergies Renewables
- Masdar Clean Energy
- ENGIE Africa
- Globeleq
- Abengoa Solar
Additional Benefits:
- The market estimate (ME) sheet in Excel format
- 3 months of analyst support
TABLE OF CONTENTS
1 Introduction
- 1.1 Study Assumptions & Market Definition
- 1.2 Scope of the Study
2 Research Methodology
3 Executive Summary
4 Market Landscape
- 4.1 Market Overview
- 4.2 Market Drivers
- 4.2.1 Rapid decline in solar PV CAPEX
- 4.2.2 Utility-scale wind project pipeline acceleration in South Africa
- 4.2.3 Mini-grid programs backed by DFI concessional funding
- 4.2.4 Emerging green-hydrogen export hubs
- 4.2.5 Growing corporate PPAs from mining companies
- 4.2.6 Expansion of climate-aligned blended-finance platforms
- 4.3 Market Restraints
- 4.3.1 Weak grid stability & curtailment risk
- 4.3.2 Currency-convertibility limitations for IPPs
- 4.3.3 Delays in sovereign guarantees for power-purchase agreements
- 4.3.4 Rising opposition to large hydro projects on social-environment grounds
- 4.4 Supply-Chain Analysis
- 4.5 Regulatory Landscape
- 4.6 Technological Outlook
- 4.7 Porter's Five Forces
- 4.7.1 Bargaining Power of Suppliers
- 4.7.2 Bargaining Power of Consumers
- 4.7.3 Threat of New Entrants
- 4.7.4 Threat of Substitute Products & Services
- 4.7.5 Intensity of Competitive Rivalry
5 Market Size & Growth Forecasts
- 5.1 By Technology
- 5.1.1 Solar Energy (PV and CSP)
- 5.1.2 Wind Energy (Onshore and Offshore)
- 5.1.3 Hydropower (Small, Large, PSH)
- 5.1.4 Bioenergy
- 5.1.5 Geothermal
- 5.1.6 Ocean Energy (Tidal and Wave)
- 5.2 By End-User
- 5.2.1 Utilities
- 5.2.2 Commercial and Industrial
- 5.2.3 Residential
- 5.3 By Geography
- 5.3.1 South Africa
- 5.3.2 Egypt
- 5.3.3 Nigeria
- 5.3.4 Morocco
- 5.3.5 Algeria
- 5.3.6 Ethiopia
- 5.3.7 Kenya
- 5.3.8 Ghana
- 5.3.9 Rest of Africa
6 Competitive Landscape
- 6.1 Market Concentration
- 6.2 Strategic Moves (M&A, JVs, Funding, PPAs)
- 6.3 Market Share Analysis (Market Rank/Share for key companies)
- 6.4 Company Profiles (includes Global-level Overview, Market-level Overview, Core Segments, Financials, Strategic Information, Products & Services, Recent Developments)
- 6.4.1 Vestas Wind Systems A/S
- 6.4.2 Juwi Holding AG
- 6.4.3 ACWA Power
- 6.4.4 Enel Green Power S.p.A.
- 6.4.5 EDF Renewables
- 6.4.6 Acciona SA
- 6.4.7 JinkoSolar Holding Co. Ltd
- 6.4.8 Canadian Solar Inc.
- 6.4.9 First Solar Inc.
- 6.4.10 Hidroelectrica de Cahora Bassa S.A.
- 6.4.11 Scatec ASA
- 6.4.12 Mainstream Renewable Power
- 6.4.13 Siemens Gamesa Renewable Energy
- 6.4.14 BTE Renewable
- 6.4.15 Orsted A/S
- 6.4.16 TotalEnergies Renewables
- 6.4.17 Masdar Clean Energy
- 6.4.18 ENGIE Africa
- 6.4.19 Globeleq
- 6.4.20 Abengoa Solar
7 Market Opportunities & Future Outlook
- 7.1 White-Space & Unmet-Need Assessment


