

|
시장보고서
상품코드
2116784
폐기물 처리 장비 시장 : 점유율 분석, 업계 동향과 통계, 성장 예측(2026-2031년)Waste Disposal Equipment - Market Share Analysis, Industry Trends & Statistics, Growth Forecasts (2026 - 2031) |
||||||
 Mordor Intelligence
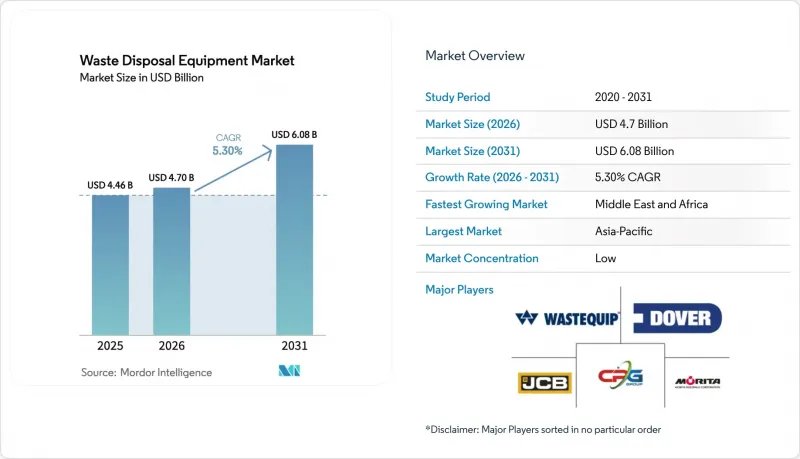
Mordor Intelligence에 의하면, 2026년 세계의 폐기물 처리 장비 시장 규모는 47억 달러로 추정되고 있어 2025년 44억 6,000만 달러에서 확대해, 2031년에는 60억 8,000만 달러에 이를 것으로 예측됩니다.
2026년부터 2031년까지 연평균 성장률(CAGR) 5.30%로 성장할 것으로 전망됩니다.
본 보고서는 설비 유형(폐기물 재활용 설비 등), 폐기물 유형(유해 폐기물 등), 최종 사용자(산업 시설 등), 운영 형태(고정형 설비 등), 자동화 수준(수동 등), 지역(아시아 등) 등을 기준으로 분류되어 있습니다. 본 보고서에서는 상기 모든 부문에 대해 시장 규모 및 전망(금액: 달러)을 제시하고 있습니다.
전 세계 폐기물 처리 장비 시장 동향 및 인사이트
AI 탑재 광학 선별기 도입 가속화
AI를 활용한 광학 선별기의 재료 인식 정확도는 현재 99%에 달하며, 금속 및 목재 회수율 향상을 실현함과 동시에 대규모 자원 회수 시설의 운영 비용을 절감하고 있습니다. 7년간의 비용 비교에 따르면, 자동화 플랜트의 총 비용은 1,400만 달러인 반면, 같은 규모의 수작업 운영은 2,360만 달러로, 전체 수명 주기에서 40.6%의 비용 절감으로 이어집니다. 이러한 경제적 이점 외에도 인력 부족 완화 및 순도 기준 강화가 맞물리면서, 인건비가 높은 유럽 시장에서 도입이 가속화되고 있으며, 그 흐름은 북미와 아시아의 선진 거점으로까지 확산되고 있습니다.
금지 조치 이후 전자 폐기물 재활용을 뒷받침하는 움직임
전자 폐기물 수입에 대한 지역적 금지 조치와 국내에서 발생하는 290만 톤의 노후화된 기기를 배경으로, 아시아태평양 각국 정부는 현지 처리 능력 확대에 본격적으로 나서고 있습니다. 『Global e-Waste Monitor』에 따르면, 미처리 스크랩에는 620억 달러 상당의 회수 가능한 자원이 잠들어 있다고 합니다. 리튬 배터리를 안전하게 회수할 수 있는 분쇄기, 오염 제거 라인, 로봇 해체기에 대한 투자가 잇따르고 있으며, 이 지역 전체에서 전문 장비 도입이 가속화되고 있습니다.
로봇 피킹 장치의 투자 회수 기간이 길다.
소규모 시설의 경우 처리량이 적고 자본 예산도 제한적이기 때문에 여러 대의 로봇으로 구성된 시스템 도입을 정당화하기 어려우며, 손익분기점에 도달하기까지 5년 이상 걸리고 있습니다. 자금 조달 프로그램이나 ‘서비스형 장비(Equipment-as-a-Service)’ 모델을 통해 이러한 장벽은 점차 완화되고 있지만, 개발도상 지역에서의 보급은 여전히 더딘 실정입니다.
부문 분석
2025년, 폐기물 재활용 장비는 전 세계 폐기물 처리 장비 시장에서 35.40%의 매출 점유율을 차지했습니다. 제조업체들은 순도를 높이고 인건비를 절감하기 위해 근적외선 센서, 머신러닝, 로봇 기술을 통합하고 있습니다. 시설들이 더 높은 자원 회수율을 추구하고 부가가치가 낮은 작업을 자동화함에 따라, AI 기반 시스템은 연평균 성장률(CAGR) 11.9%를 나타낼 것으로 예측되며, 기존의 체·자석식 선별 라인을 능가하는 성장이 기대됩니다. 유서 깊은 제조업체들은 기존 고객 기반을 유지하기 위해 기존 선별기에 광학식 감지 키트를 사후 장착하고 있는 반면, 전문 스타트업 기업들은 소규모 지자체 대상으로 모듈식 트레일러 탑재형 유닛을 추진하고 있습니다.
수집 및 운반 차량의 전동화로의 전환은 보다 광범위한 탈탄소화 추세를 반영하고 있습니다. 배터리 팩, 전동 PTO, 회생 제동 장치는 현재 새로운 쓰레기 수거차 입찰에서 표준 사양으로 자리 잡고 있습니다. 부수적인 스마트 기기, 충전 레벨 센서, 경로 최적화 소프트웨어, 압축기 압력 모니터를 통해 디지털 모니터링 범위는 투입 구획의 경계를 넘어 확장되고 있습니다. 조기 도입 기업들로부터는 예방적 유지보수를 통한 비용 절감과, 전 세계 폐기물 처리 장비 시장에서 순환형 경제 목표를 뒷받침하는 보다 명확한 물질 흐름 데이터가 보고되고 있습니다.
2025년 매출의 69.80%는 비유해 폐기물에서 발생했으나, 유해 폐기물 처리 솔루션은 2031년까지 연평균 성장률(CAGR) 7.7%라는 가장 빠른 성장세를 보이고 있습니다. 의료 폐기물, 화학 폐기물, 전자 폐기물에 대한 규제가 강화됨에 따라 밀폐형 분쇄기, 음압 공급 시스템 및 열처리 장치에 대한 수요가 증가하고 있습니다. 리튬 배터리 회수 플랜트와 용제 회수 라인이 가동을 시작함에 따라, 유해 폐기물 처리 분야의 전 세계 폐기물 처리 장비 시장 규모는 확대될 것으로 예측됩니다.
전자 폐기물의 경우, 공식 재활용률이 22.3%에 그치고 있어 비즈니스 기회가 확대되고 있음이 부각되고 있습니다. 로봇식 오염 제거 스테이션에서는 현재 98%의 순도로 배터리나 커패시터를 추출할 수 있게 되어, 안전상의 위험을 줄이는 동시에 고부가가치 금속을 회수하고 있습니다. 또한, 건설·철거 폐기물의 경우, 콘크리트와 금속을 회수하여 재이용하기 위한 이동식 분쇄기 및 밀도에 기반한 자동 선별기에 대한 투자가 촉진되고 있습니다.
지역별 분석
2025년, 아시아태평양은 전 세계 폐기물 처리 장비 시장 매출의 46.50%를 차지했습니다. 중국과 인도는 도시 인구 증가와 산업 활동 활성화에 따라 이러한 주도적 지위를 확립하고 있으며, MRF(분리 수거 시설) 네트워크, 발생원별 분리 수거, 전자 폐기물 해체에 대한 투자를 촉진하고 있습니다. 정부 보조금 및 기술 제휴를 통해 AI 탑재 선별기 및 리튬 배터리 회수 라인이 추진되고 있으며, 이 지역의 폐기물 처리 장비 시장 규모는 평균 이상의 속도로 확대되고 있습니다.
중동 및 아프리카은 2031년까지 연평균 성장률(CAGR)이 6.95%로 가장 강력한 성장 궤도를 보이고 있습니다. 이 대륙에서는 2024년에 1억 2,500만 톤의 일반 폐기물이 발생할 것으로 예상되며, 내년에는 2억 4,400만 톤에 달할 것으로 전망됩니다. 재활용률은 4%에 그치고 있지만, 재활용 가능한 함유율이 80-90%에 달하는 점을 고려할 때 잠재적인 수요가 존재함을 시사하고 있습니다. 동아프리카 국가들은 2025년, 전자폐기물(e-waste) 인프라 강화를 위한 10개 항목의 행동 계획을 채택하고, 자본 유입 및 기술 이전을 촉진함으로써 세계 폐기물 처리 장비 시장에서의 아프리카의 진출을 확대되고 있습니다.
유럽에서는 매립 폐기물 감축, 생산자 책임, 탄소 중립에 관한 엄격한 지침에 따라 견조한 추세를 유지하고 있습니다. 매립세 인상 및 순환형 경제 정책 패키지를 통해 압축기, 베일러 및 집하장 개보수 프로그램에 필요한 자금이 확보되고 있습니다. 스칸디나비아 국가들에서는 고밀도 프레스기 및 전기 쓰레기 수거차 도입이 앞서 나가고 있으며, 그 성능 기준이 대륙 전체로 확산되고 있습니다.
북미에서는 자산 갱신이 지연되고 있음을 나타내는 ‘C+’ 인프라 평가를 배경으로, 설비의 꾸준한 갱신이 이어지고 있습니다. 연방 정부의 제로 배출 차량 목표와 확대되는 생산자 책임 확대(EPR) 법에 따라, 전기화된 차량군 및 스마트 MRF(분리 수거 시설) 업그레이드에 대한 투자가 뒷받침되고 있습니다. 중동에서는 GCC 국가들을 필두로, 석유 수입이 폐기물 발전 플랜트, 자동 선별 및 첨단 퇴비화에 투입되고 있어, 세계 폐기물 처리 장비 시장에서 주목할 만한 틈새 시장을 형성하고 있습니다.
기타 혜택:
- 엑셀 형식 시장 예측(ME) 시트
- 3개월간의 애널리스트 지원
자주 묻는 질문
목차
제1장 서론
제2장 조사 방법
제3장 주요 요약
제4장 시장 구도
제5장 시장 규모와 성장 예측
제6장 경쟁 구도
제7장 시장 기회와 향후 전망
JHS 26.08.28According to Mordor Intelligence, global waste disposal equipment market size in 2026 is estimated at USD 4.7 billion, growing from 2025 value of USD 4.46 billion with 2031 projections showing USD 6.08 billion, growing at 5.30% CAGR over 2026-2031.
This report is Segmented by Equipment Type (Waste Recycling Equipment and More), by Waste Type (Hazardous Waste and More), by End User (Industrial Facilities and More), by Mode of Operation (Stationary Equipment and More), by Automation Level (Manual and More), by Geography (Asia and More) and More. The Report Offers Market Size and Forecasts in Value (USD) for all the Above Segments.
Global Waste Disposal Equipment Market Trends and Insights
Accelerated Adoption of AI-enabled Optical Sorters
AI-guided optical sorters now reach 99% material-recognition accuracy, unlocking higher recovery rates for metals and wood and trimming operating budgets for large material-recovery facilities. A seven-year cost comparison shows an automated plant all-in expense of USD 14.0 million, versus USD 23.6 million for a similarly sized manual operation, translating to a 40.6% life-cycle saving.These financial gains, coupled with labor-shortage relief and tighter purity mandates, are propelling deployment across Europe's high-labor-cost markets and spilling into North America and advanced Asian hubs.
Post-ban E-waste Recycling Stimulus
Regional bans on electronic waste imports and the domestic generation of 2.9 million tons of obsolete devices have galvanized Asia-Pacific governments to expand local processing. The Global e-Waste Monitor notes USD 62 billion in recoverable resources locked in unprocessed scrap. Investment is flowing into shredders, depollution lines, and robotic dismantlers capable of safely extracting lithium batteries, encouraging faster uptake of specialized equipment across the region.
Long Payback for Robotic Pickers
Smaller facilities struggle to justify multi-robot systems where throughput is modest and capital budgets are tight, prolonging break-even horizons beyond five years. Financing programs and equipment-as-a-service models are gradually easing this barrier, but uptake remains slow in developing regions.
Other drivers and restraints analyzed in the detailed report include:
- Transition to Electric Refuse Collection Fleets
- Mandatory Source Segregation Laws
- Semiconductor Shortages
For complete list of drivers and restraints, kindly check the Table Of Contents.
Segment Analysis
Waste recycling equipment held a 35.40% revenue share of the Global waste disposal equipment market in 2025. Manufacturers are integrating near-infrared sensors, machine learning, and robotics to raise purity and reduce labor costs. AI-driven systems are projected to post a 11.9% CAGR, outpacing conventional screen-and-magnet lines as facilities chase higher commodity yields and automate low-value tasks. Traditional brands are retrofitting optical detection kits into existing sorters to protect installed bases, while specialized startups push modular, trailer-mounted units for smaller municipalities.
The electric shift in collection and transfer vehicles mirrors broader decarbonization trends; battery packs, electric PTOs, and regenerative braking are now standard in new refuse-truck tenders. Ancillary smart devices, fill-level sensors, route-optimization software, and compactor-pressure monitors extend digital oversight beyond the tipping floor. Early adopters report preventive-maintenance savings and clearer material-flow data that underpin circular economy targets inside the Global waste disposal equipment market.
Non-hazardous streams generated 69.80% of 2025 revenue, yet hazardous-waste solutions are advancing fastest at 7.7% CAGR through 2031. Regulatory focus on medical, chemical, and electronic residues boosts demand for sealed shredders, negative-pressure feeding systems, and thermal destruction units. The Global waste disposal equipment market size for hazardous-waste treatment is expected to expand as lithium-battery recovery plants and solvent-recapture lines come online.
E-waste, with only 22.3% formal recycling, underlines a widening opportunity. Robotic depollution stations now remove batteries and capacitors at 98% purity, alleviating safety risks and retrieving high-value metals. Construction-and-demolition debris also prompts investments in mobile crushers and automated density-based separators, which reclaim concrete and metals for reuse.
Complete Report Scope:
- By Equipment Type
- Waste Sorting Equipment
- Mechanical Sorting Systems
- Optical / AI-based Sorting Systems
- Robotic Picking Systems
- Waste Recycling Equipment
- Shredders
- Balers & Compactors
- Crushers & Pulverizers
- Conveying & Screening Systems
- Waste Collection & Transportation Vehicles
- Refuse Collection Trucks
- Hook-lift & Skip Loaders
- Automated Vacuum Collection Systems
- Waste Landfill & Treatment Equipment
- Landfill Compactors & Dozers
- Incinerators & Thermal Treatment Units
- Composting & Anaerobic Digestion Units
- Ancillary & Smart Monitoring Devices
- Smart Bins & Fill-level Sensors
- Software & Digital Platforms
- Waste Sorting Equipment
- By Waste Type
- Municipal Solid Waste
- Industrial Waste (Non-Hazardous)
- Hazardous Waste
- Medical & Bio-hazardous Waste
- Electronic Waste (E-waste)
- Construction & Demolition Debris
- By End-user
- Municipal Authorities
- Waste Management Service Providers
- Industrial Facilities
- Commercial Establishments
- Residential Sector
- By Mode of Operation
- Stationary Equipment
- Mobile / Portable Equipment
- By Automation Level
- Manual
- Semi-automatic
- Fully Automatic / Smart
- By Power Source
- Diesel
- Electric
- Hybrid
- Hydraulic / PTO-driven
- By Geography
- North America
- United States
- Canada
- Mexico
- South America
- Brazil
- Argentina
- Colombia
- Rest of South America
- Europe
- Germany
- United Kingdom
- France
- Italy
- Spain
- NORDICS (Denmark, Finland, Iceland, Norway, and Sweden)
- Rest of Europe
- Middle East and Africa
- GCC
- Israel
- Turkey
- South Africa
- Egypt
- Rest of Middle East and Africa
- Asia-Pacific
- China
- Japan
- India
- South Korea
- ASEAN (Indonesia, Thailand, Philippines, Malaysia, Vietnam)
- Australia & New Zealand
- Rest of Asia-Pacific
- North America
Geography Analysis
Asia-Pacific held 46.50% of the Global waste disposal equipment market revenue in 2025. China and India anchor this leadership as urban populations climb and industrial activity intensifies, fostering investments in MRF networks, source-segregated collection, and e-waste dismantling. National subsidies and technology partnerships drive AI-enabled sorters and lithium-battery recovery lines, enlarging the regional Global waste disposal equipment market size at above-average speed.
The Middle East and Africa represent the most dynamic growth trajectory at 6.95% CAGR through 2031. The continent generated 125 million tons of municipal solid waste in 2024 and faces a projected 244 million tons load next year. Recycling lags at 4%, yet an 80-90% recyclable content signals latent demand. East African economies endorsed a ten-point action plan in 2025 to boost e-waste infrastructure, encouraging capital inflows and technology transfer that widen African participation in the Global waste disposal equipment market.
Europe maintains a robust stance thanks to stringent directives on landfill diversion, producer responsibility, and carbon neutrality. Escalating landfill taxes and circular-economy policy packages fund compactor, baler, and depot refurbishment programs. Regions within Scandinavia lead adoption of high-density presses and electric refuse trucks, setting performance benchmarks that ripple across the continent.
North America continues steady equipment renewal, guided by a C+ infrastructure grade that highlights deferred asset replacement. Federal zero-emission vehicle targets and expanding extended-producer-responsibility statutes sustain investment in electrified fleets and smart MRF upgrades. The Middle East, led by GCC nations, channels oil-revenues into waste-to-energy plants, automated sorting, and advanced composting, adding a noteworthy niche within the Global waste disposal equipment market.
- Wastequip
- CP Manufacturing Inc.
- Dover Corporation
- Morita Holdings Corporation
- JCB
- Caterpillar Inc.
- TOMRA Systems ASA
- Veolia Environment S.A.
- SUEZ Group
- Babcock & Wilcox Enterprises
- Metso Outotec
- Komptech GmbH
- Tana Oy
- McNeilus Truck and Manufacturing Inc.
- Kirchhoff Group
- Blue Group
- Sierra International Machinery
- Fujian Longma Environmental Sanitation Equipment
- Henan Winner Vibrating Equipment
- Danieli Centro Recycling
- Terex Corporation
- Covanta
- Bollegraaf Recycling Solutions
- Steinert GmbH
Additional Benefits:
- The market estimate (ME) sheet in Excel format
- 3 months of analyst support
TABLE OF CONTENTS
1 Introduction
- 1.1 Study Assumptions & Market Definition
- 1.2 Scope of the Study
2 Research Methodology
3 Executive Summary
4 Market Landscape
- 4.1 Market Overview
- 4.2 Market Drivers
- 4.2.1 Accelerated adoption of AI-enabled optical sorters across Europe
- 4.2.2 Transition to electric refuse-collection fleets across North America
- 4.2.3 Post-ban e-waste recycling stimulus throughout Asia-Pacific
- 4.2.4 Mandatory source-segregation laws in South Asia's metropolitan clusters
- 4.2.5 Escalating landfill-tax regimes across the Nordic region driving compactor demand
- 4.2.6 Extended Producer Responsibility (EPR) funds boosting baler upgrades in Latin America
- 4.3 Market Restraints
- 4.3.1 Long payback for robotic pickers in midsize MRFs
- 4.3.2 Semiconductor shortages inflating PLC lead-times
- 4.3.3 Fragmented municipal procurement processes across Africa
- 4.3.4 Costly EU battery-safety certification for lithium-shredding equipment
- 4.4 Value / Supply-Chain Analysis
- 4.5 Regulatory Outlook
- 4.6 Technological Outlook
- 4.7 Porter's Five Forces
- 4.7.1 Threat of New Entrants
- 4.7.2 Bargaining Power of Buyers
- 4.7.3 Bargaining Power of Suppliers
- 4.7.4 Threat of Substitute Products
- 4.7.5 Intensity of Competitive Rivalry
- 4.8 Regional Insights on Waste Disposal Equipment
5 Market Size & Growth Forecasts (Value, In USD Billion)
- 5.1 By Equipment Type
- 5.1.1 Waste Sorting Equipment
- 5.1.1.1 Mechanical Sorting Systems
- 5.1.1.2 Optical / AI-based Sorting Systems
- 5.1.1.3 Robotic Picking Systems
- 5.1.2 Waste Recycling Equipment
- 5.1.2.1 Shredders
- 5.1.2.2 Balers & Compactors
- 5.1.2.3 Crushers & Pulverizers
- 5.1.2.4 Conveying & Screening Systems
- 5.1.3 Waste Collection & Transportation Vehicles
- 5.1.3.1 Refuse Collection Trucks
- 5.1.3.2 Hook-lift & Skip Loaders
- 5.1.3.3 Automated Vacuum Collection Systems
- 5.1.4 Waste Landfill & Treatment Equipment
- 5.1.4.1 Landfill Compactors & Dozers
- 5.1.4.2 Incinerators & Thermal Treatment Units
- 5.1.4.3 Composting & Anaerobic Digestion Units
- 5.1.5 Ancillary & Smart Monitoring Devices
- 5.1.5.1 Smart Bins & Fill-level Sensors
- 5.1.5.2 Software & Digital Platforms
- 5.1.1 Waste Sorting Equipment
- 5.2 By Waste Type
- 5.2.1 Municipal Solid Waste
- 5.2.2 Industrial Waste (Non-Hazardous)
- 5.2.3 Hazardous Waste
- 5.2.4 Medical & Bio-hazardous Waste
- 5.2.5 Electronic Waste (E-waste)
- 5.2.6 Construction & Demolition Debris
- 5.3 By End-user
- 5.3.1 Municipal Authorities
- 5.3.2 Waste Management Service Providers
- 5.3.3 Industrial Facilities
- 5.3.4 Commercial Establishments
- 5.3.5 Residential Sector
- 5.4 By Mode of Operation
- 5.4.1 Stationary Equipment
- 5.4.2 Mobile / Portable Equipment
- 5.5 By Automation Level
- 5.5.1 Manual
- 5.5.2 Semi-automatic
- 5.5.3 Fully Automatic / Smart
- 5.6 By Power Source
- 5.6.1 Diesel
- 5.6.2 Electric
- 5.6.3 Hybrid
- 5.6.4 Hydraulic / PTO-driven
- 5.7 By Geography
- 5.7.1 North America
- 5.7.1.1 United States
- 5.7.1.2 Canada
- 5.7.1.3 Mexico
- 5.7.2 South America
- 5.7.2.1 Brazil
- 5.7.2.2 Argentina
- 5.7.2.3 Colombia
- 5.7.2.4 Rest of South America
- 5.7.3 Europe
- 5.7.3.1 Germany
- 5.7.3.2 United Kingdom
- 5.7.3.3 France
- 5.7.3.4 Italy
- 5.7.3.5 Spain
- 5.7.3.6 NORDICS (Denmark, Finland, Iceland, Norway, and Sweden)
- 5.7.3.7 Rest of Europe
- 5.7.4 Middle East and Africa
- 5.7.4.1 GCC
- 5.7.4.2 Israel
- 5.7.4.3 Turkey
- 5.7.4.4 South Africa
- 5.7.4.5 Egypt
- 5.7.4.6 Rest of Middle East and Africa
- 5.7.5 Asia-Pacific
- 5.7.5.1 China
- 5.7.5.2 Japan
- 5.7.5.3 India
- 5.7.5.4 South Korea
- 5.7.5.5 ASEAN (Indonesia, Thailand, Philippines, Malaysia, Vietnam)
- 5.7.5.6 Australia & New Zealand
- 5.7.5.7 Rest of Asia-Pacific
- 5.7.1 North America
6 Competitive Landscape
- 6.1 Market Concentration
- 6.2 Strategic Moves by Key Players in the Industry
- 6.3 Market Share Analysis (Key Players)
- 6.4 Company Profiles (includes Global level Overview, Market level overview, Core Segments, Financials as available, Strategic Information, Products & Services, and Recent Developments)
- 6.4.1 Wastequip
- 6.4.2 CP Manufacturing Inc.
- 6.4.3 Dover Corporation
- 6.4.4 Morita Holdings Corporation
- 6.4.5 JCB
- 6.4.6 Caterpillar Inc.
- 6.4.7 TOMRA Systems ASA
- 6.4.8 Veolia Environment S.A.
- 6.4.9 SUEZ Group
- 6.4.10 Babcock & Wilcox Enterprises
- 6.4.11 Metso Outotec
- 6.4.12 Komptech GmbH
- 6.4.13 Tana Oy
- 6.4.14 McNeilus Truck and Manufacturing Inc.
- 6.4.15 Kirchhoff Group
- 6.4.16 Blue Group
- 6.4.17 Sierra International Machinery
- 6.4.18 Fujian Longma Environmental Sanitation Equipment
- 6.4.19 Henan Winner Vibrating Equipment
- 6.4.20 Danieli Centro Recycling
- 6.4.21 Terex Corporation
- 6.4.22 Covanta
- 6.4.23 Bollegraaf Recycling Solutions
- 6.4.24 Steinert GmbH


