

|
시장보고서
상품코드
2116792
유럽의 수소 생산 시장 : 점유율 분석, 업계 동향과 통계, 성장 예측(2026-2031년)Europe Hydrogen Generation - Market Share Analysis, Industry Trends & Statistics, Growth Forecasts (2026 - 2031) |
||||||
 Mordor Intelligence
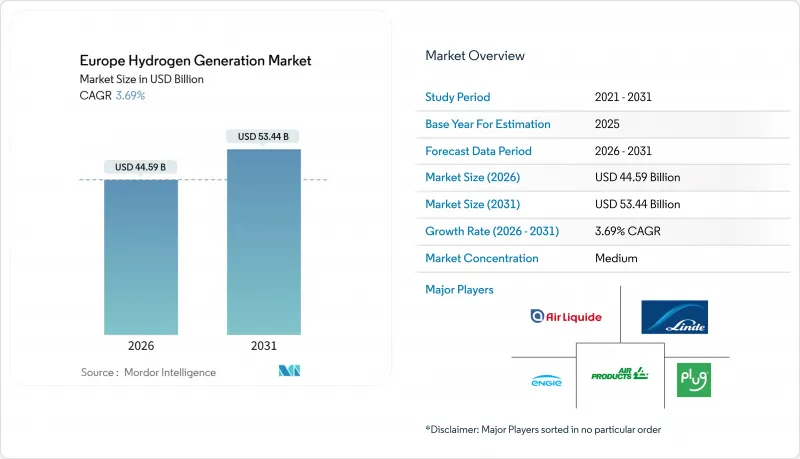
유럽의 수소 생산 시장 규모는 2026년에 445억 9,000만 달러로 추정되고 있어 예측 기간(2026-2031년) CAGR 3.69%로 확대되어 2031년에는 534억 4,000만 달러에 이를 전망입니다.
본 보고서는 원료별(그레이, 블루, 그린, 터콰이즈, 핑크), 기술별(SMR, 석탄 가스화, ATR, POX, 전해),용도(석유 정제, 화학 처리, 철강, 운송용 연료, 전력 및 에너지 저장, 주거·상업용 난방), 그리고 지역(독일, 프랑스, 영국, 네덜란드, 스페인, 이탈리아, 노르웨이, 덴마크 등)별로 분류되어 있습니다.
유럽 수소 생산 시장 동향 및 인사이트
EU의 ‘Fit-for-55’ 및 그린 딜 의무
2030년까지 국내 재생 가능 수소 1,000만 톤 및 수입 수소 1,000만 톤이라는 EU의 법적 구속력 있는 목표로 인해, 단기적인 비용 측면의 역풍이 있음에도 불구하고 수요의 확실성이 높아지고 있습니다. 독일의 2023년 전략에서는 전해 및 수입 회랑에 총 81억 달러를 배정했으며, 한편 프랑스는 2030년까지 산업의 탈탄소화를 위해 79억 달러를 배분했습니다. 2025년 7월에 도입된 RFNBO 규정에서는 추가성 및 시간 단위 매칭이 도입되어, 의도적으로 도입 속도를 늦추면서도 탄소 무결성을 확보함으로써 민간 자본의 위험을 경감시키고 있습니다. 회원국들의 경매, 독일의 ‘H2Global’ 및 프랑스의 ‘Hydrogene decarbone’ 입찰, 10년간의 구매 가격 보장 등이 그레이 수소와 그린 수소의 비용 격차를 좁히고 있습니다. 이러한 조치들이 맞물려 유럽의 수소 발전 시장을 구조적으로 저배출 경로로 이끌고 있는 동시에, 선구적인 프로젝트에 대한 자금 조달의 확실성을 높이고 있습니다.
전해조 비용 감소(규모의 경제와 학습 곡선)
기가팩토리의 가동에 따라 알칼리계 시스템의 가격은 2020년 1kW당 1,300유로에서 2025년 말까지 1kW당 600-800유로까지 하락하여, 중국에서 수입되는 스택과 동등한 가격 수준에 도달했습니다. thyssenkrupp nucera사의 20 MW 모듈 및 Nel사의 3.5 MW 스택은 현재 kW당 700유로 미만으로 출하되고 있는 반면,Sunfire사의 SOEC 시범 프로젝트에서는 설비 투자(Capex)가 높긴 하지만, 10-15퍼센트 포인트의 효율 향상이 나타나고 있습니다. 용량이 2배가 될 때마다 18-22%의 학습 곡선이 시사하듯이, 헝가리와 베를린에서 발표된 기가팩토리 덕분에 2029년까지 알칼리형 연료전지의 비용은 kW당 400유로 미만으로 떨어질 것이며, 풍력 자원이 풍부한 지역에서는 그린 수소가 비용 평형을 달성할 전망입니다. 설비 가격 하락은 프로젝트 수준의 균등화 비용(LCOH) 절감으로 직접 이어져, 유럽 수소 생산 시장이 보조금 의존에서 벗어나는 데 필요한 기간을 단축하게 될 것입니다.
탄소 가격이 안정적으로 책정되지 않을 경우, 그린 수소(LCOH)와 그레이 수소 간의 비용 격차는 클 것으로 보입니다.
2025년 그린 수소의 평균 가격은 1kg당 4.50-6.50유로인 반면,그레이 수소는 1.80-2.30유로로 2.70-4.20유로의 격차가 남아 있지만, ETS 가격이 75유로/t 미만을 기록하고 있는 현 상황에서는 이 격차가 아직 해소되지 않았습니다. 독일의 2024년 탄소 가격 차액 계약(CFD)은 1kg당 4유로의 행사 가격을 설정하고 있지만, 제1차 경매에서 확보된 용량은 고작 1.2GW에 그쳐 2030년 목표인 10GW를 크게 밑돌고 있습니다. 유럽 수소 은행의 고정 프리미엄형 경매에서는 10년간 1kg당 0.40-0.48유로가 제시되고 있습니다. 이는 유익하기는 하지만, 공공 자금에 대한 의존은 2027년 이후 재정 우선순위의 변화에 따라 프로젝트가 영향을 받을 위험을 수반합니다. EUA 가격이 톤당 90-110유로에 도달할 때까지는 트레이더들이 헤지를 하거나 자유 시장에서의 대규모 구매를 미루게 되어, 유럽 수소 발전 시장의 확대 속도가 주춤하게 될 것입니다.
부문 분석
2025년 유럽 수소 발전 시장 규모에서 그레이 수소 시장 규모는 310억 달러에 달하고, 전체의 70.1%를 차지했으나, 재생에너지를 활용한 방식이 기존 방식을 능가함에 따라 그 점유율은 2031년까지 55% 미만으로 떨어질 것입니다. 그린 수소 생산량은 설비 투자 감소와 ‘Fit-for-55’에 따른 수요 보장을 배경으로 연간 25.5%의 속도로 성장할 것입니다. 이러한 급증으로 인해 2031년까지 그린 수소 시장 규모는 126억 달러에 달할 것이며, 이는 전해법을 사용하는 생산업체들에게 유럽 수소 생산 시장 내 점유율의 현저한 확대로 이어질 것입니다. 블루 수소는 CO₂ 포집률 90% 이상의 프로젝트를 통해 완만하게 증가하겠지만, CCS 인프라에 대한 여론의 저항으로 인해 성장폭은 제한적일 것입니다. 한편, 터콰이즈 및 핑크 수소는 폴리머 산업이나 원자력 발전을 기반으로 하는 클러스터 내의 틈새 수요를 충족시킬 것입니다. 전반적으로 에너지 원천 구성의 전환은 급격한 변화가 아닌 관리된 단계적 전환임을 보여주며, 기존 가스 공급업체에게는 현금 흐름 위험을 완화하는 동시에, RFNBO 기준을 충족하는 공급량을 확보한 신규 진입업체에게는 시장 진입의 여지가 열립니다.
2차적인 영향은 가스 시장의 헤지 및 암모니아 무역 흐름에서 나타납니다. 정유사는 그린 수소와의 가격 평준화를 기다리는 동안 블루 수소에 대한 3-5년짜리 브릿지 계약을 체결하는 한편, 대형 화학 제조업체는 RFNBO 프리미엄 크레딧을 수익화할 수 있는 그린 암모니아 수출에 주력하고 있습니다. 그 결과, 각 공급 경로를 아우르는 선택지가 헤지 전략이 되어, 기업 구매자는 핵심 사업에 차질을 빚지 않으면서도 규정 준수 기한을 무사히 넘길 수 있게 됩니다.
기타 혜택:
- 엑셀 형식 시장 예측(ME) 시트
- 3개월간의 애널리스트 지원
자주 묻는 질문
목차
제1장 서론
제2장 조사 방법
제3장 개요
제4장 시장 구도
제5장 시장 규모와 성장 예측
제6장 경쟁 구도
제7장 시장 기회와 향후 전망
JHS 26.09.01According to Mordor Intelligence, the Europe hydrogen generation market size is estimated at USD 44.59 billion in 2026, and is expected to reach USD 53.44 billion by 2031, at a CAGR of 3.69% during the forecast period (2026-2031).
This report is Segmented by Source (Grey, Blue, Green, Turquoise, and Pink), Technology (SMR, Coal Gasification, ATR, POX, and Electrolysis), Application (Oil Refining, Chemical Processing, Iron and Steel, Transportation Fuel, Power and Energy Storage, and Residential and Commercial Heating), and Geography (Germany, France, United Kingdom, Netherlands, Spain, Italy, Norway, Denmark, and More).
Europe Hydrogen Generation Market Trends and Insights
EU "Fit-for-55" & Green Deal Mandates
Binding EU targets of 10 million tonnes of domestic renewable hydrogen and 10 million tonnes of imports by 2030 elevate demand certainty despite near-term cost headwinds. Germany's 2023 strategy earmarked USD 8.1 billion across electrolysis and import corridors, while France allocated USD 7.9 billion through 2030 for industrial decarbonization. July 2025 RFNBO rules introduced additionality and hourly matching, deliberately slowing deployment yet locking in carbon integrity that derisks private capital. Member-state auctions, H2Global in Germany and France's "Hydrogene decarbone" tenders, guarantee offtake prices for ten years, narrowing the grey-green cost gap. Collectively, these measures push the European Hydrogen Generation Market toward structurally lower emissions pathways while providing bankability for first-mover projects.
Electrolyser Cost Decline (Scale & Learning Curves)
Alkaline system prices fell from EUR 1,300 per kW in 2020 to EUR 600-800 per kW by late 2025 as gigafactories came online, achieving parity with imported Chinese stacks. thyssenkrupp nucera's 20 MW modules and Nel's 3.5 MW stacks now ship at sub-EUR 700 per kW, while Sunfire's SOEC pilots show 10-15 percentage-point efficiency gains, albeit at higher capex. Learning curves of 18-22% per capacity doubling suggest that announced gigafactories in Hungary and Berlin will drive alkaline costs below EUR 400 per kW by 2029, positioning green hydrogen for parity in wind-rich zones. Falling equipment prices translate directly into project-level levelized cost reductions, compressing the time needed for the European Hydrogen Generation Market to decouple from subsidies.
High LCOH Gap vs. Grey H2 Without Robust Carbon Price
Green hydrogen averaged EUR 4.50-6.50 kg in 2025 against EUR 1.80-2.30 kg for grey, leaving a EUR 2.70-4.20 gap that sub-EUR 75 t ETS prices do not yet close. Germany's 2024 carbon contracts-for-difference pay a EUR 4.00 kg strike price but covered only 1.2 GW in the first auction, well below the 10 GW 2030 target. The European Hydrogen Bank's fixed-premium auctions offer EUR 0.40-0.48 kg for ten years; while helpful, reliance on public finance exposes projects to shifting fiscal priorities after 2027. Until EUA prices clear EUR 90-110 t, merchants will hedge but delay large free-market purchases, capping the expansion speed of the European Hydrogen Generation Market.
Other drivers and restraints analyzed in the detailed report include:
- Corporate Net-Zero Commitments (Heavy Industry & Mobility)
- EU Funding: IPCEI, Horizon Europe, CEF, ETS Innovation Fund
- Renewable-Power Availability Constraints for Large-Scale Electrolysis
For complete list of drivers and restraints, kindly check the Table Of Contents.
Segment Analysis
Europe's hydrogen generation market size for grey hydrogen equaled USD 31.0 billion in 2025, representing 70.1% of volume, but its share slips below 55% by 2031 as renewable-powered routes outpace legacy. Green output grows 25.5% a year, leveraging falling capex and Fit-for-55 demand guarantees; this surge elevates green hydrogen value to USD 12.6 billion by 2031, translating into notable Europe hydrogen generation market share gains for electrolytic producers. Blue hydrogen rises modestly on projects with >=90% CO2 capture but remains capped by public resistance to CCS infrastructure, while turquoise and pink routes fill niche needs in polymer and nuclear-anchored clusters. Altogether, the shifting source mix confirms a managed glidepath rather than an abrupt switch, smoothing cash-flow risk for incumbent gas suppliers yet opening room for new entrants with RFNBO-compliant volumes.
Second-order effects appear in gas-market hedging and ammonia trade flows. Refiners sign three- to five-year bridge contracts for blue hydrogen while awaiting green parity, whereas chemical majors lean into green-ammonia exports that monetize RFNBO premium credits. As a result, optionality across source routes becomes a hedge strategy, allowing corporate buyers to straddle compliance deadlines without disrupting core operations.
Complete Report Scope:
- By Source
- Grey Hydrogen
- Blue Hydrogen
- Green Hydrogen
- Turquoise Hydrogen
- Pink Hydrogen
- By Technology
- Steam Methane Reforming (SMR)
- Coal Gasification
- Auto-Thermal Reforming (ATR)
- Partial Oxidation (POX)
- Electrolysis (Alkaline Electrolysis, Proton Exchange Membrane (PEM), Solid Oxide Electrolysis (SOE))
- By Application
- Oil Refining
- Chemical Processing (Ammonia, Methanol)
- Iron and Steel (DRI, H2-BF)
- Transportation Fuel (FCEV, Marine, Aviation)
- Power and Energy Storage
- Residential and Commercial Heating
- By Geography
- Germany
- France
- United Kingdom
- Netherlands
- Spain
- Italy
- Norway
- Denmark
- Poland
- Russia
- Rest of Europe
List of Companies Covered in this Report:
- Air Liquide
- Linde plc
- Air Products & Chemicals
- Engie SA
- Plug Power
- Messer Group
- FuelCell Energy
- Enapter AG
- Siemens Energy
- Nel ASA
- McPhy Energy
- thyssenkrupp nucera
- Sunfire GmbH
- ITM Power
- Shell plc
- BP plc
- TotalEnergies SE
- Equinor ASA
- RWE AG
- Iberdrola SA
Additional Benefits:
- The market estimate (ME) sheet in Excel format
- 3 months of analyst support
TABLE OF CONTENTS
1 Introduction
- 1.1 Study Assumptions & Market Definition
- 1.2 Scope of the Study
2 Research Methodology
3 Executive Summary
4 Market Landscape
- 4.1 Market Overview
- 4.2 Market Drivers
- 4.2.1 EU "Fit-for-55" & Green Deal mandates
- 4.2.2 Electrolyser cost decline (scale & learning curves)
- 4.2.3 Corporate net-zero commitments (heavy industry & mobility)
- 4.2.4 EU funding: IPCEI, Horizon Europe, CEF, ETS Innovation Fund
- 4.2.5 North-Sea offshore-wind curtailment creating near-zero-cost power
- 4.2.6 Repurposing gas grid into "Hydrogen Backbone" lowers mid-stream CAPEX
- 4.3 Market Restraints
- 4.3.1 High LCOH gap vs. grey H2 without robust carbon price
- 4.3.2 Renewable-power availability constraints for large-scale electrolysis
- 4.3.3 Iridium/Pt metal shortages limit PEM electrolyser scaling
- 4.3.4 Public opposition to CCS infrastructure for blue hydrogen
- 4.4 Supply-Chain Analysis
- 4.5 Government Policies & Regulations
- 4.6 Technological Outlook (Alkaline, PEM, SOEC, AEM, SMR-CCS etc.)
- 4.7 Porter's Five Forces
- 4.7.1 Bargaining Power of Suppliers
- 4.7.2 Bargaining Power of Buyers
- 4.7.3 Threat of New Entrants
- 4.7.4 Threat of Substitutes
- 4.7.5 Intensity of Rivalry
5 Market Size & Growth Forecasts
- 5.1 By Source
- 5.1.1 Grey Hydrogen
- 5.1.2 Blue Hydrogen
- 5.1.3 Green Hydrogen
- 5.1.4 Turquoise Hydrogen
- 5.1.5 Pink Hydrogen
- 5.2 By Technology
- 5.2.1 Steam Methane Reforming (SMR)
- 5.2.2 Coal Gasification
- 5.2.3 Auto-Thermal Reforming (ATR)
- 5.2.4 Partial Oxidation (POX)
- 5.2.5 Electrolysis (Alkaline Electrolysis, Proton Exchange Membrane (PEM), Solid Oxide Electrolysis (SOE))
- 5.3 By Application
- 5.3.1 Oil Refining
- 5.3.2 Chemical Processing (Ammonia, Methanol)
- 5.3.3 Iron and Steel (DRI, H2-BF)
- 5.3.4 Transportation Fuel (FCEV, Marine, Aviation)
- 5.3.5 Power and Energy Storage
- 5.3.6 Residential and Commercial Heating
- 5.4 By Geography
- 5.4.1 Germany
- 5.4.2 France
- 5.4.3 United Kingdom
- 5.4.4 Netherlands
- 5.4.5 Spain
- 5.4.6 Italy
- 5.4.7 Norway
- 5.4.8 Denmark
- 5.4.9 Poland
- 5.4.10 Russia
- 5.4.11 Rest of Europe
6 Competitive Landscape
- 6.1 Market Concentration
- 6.2 Strategic Moves (M&A, Partnerships, PPAs)
- 6.3 Market Share Analysis (Market Rank/Share for key companies)
- 6.4 Company Profiles (includes Global level Overview, Market level overview, Core Segments, Financials as available, Strategic Information, Products & Services, and Recent Developments)
- 6.4.1 Air Liquide
- 6.4.2 Linde plc
- 6.4.3 Air Products & Chemicals
- 6.4.4 Engie SA
- 6.4.5 Plug Power
- 6.4.6 Messer Group
- 6.4.7 FuelCell Energy
- 6.4.8 Enapter AG
- 6.4.9 Siemens Energy
- 6.4.10 Nel ASA
- 6.4.11 McPhy Energy
- 6.4.12 thyssenkrupp nucera
- 6.4.13 Sunfire GmbH
- 6.4.14 ITM Power
- 6.4.15 Shell plc
- 6.4.16 BP plc
- 6.4.17 TotalEnergies SE
- 6.4.18 Equinor ASA
- 6.4.19 RWE AG
- 6.4.20 Iberdrola SA
7 Market Opportunities & Future Outlook
- 7.1 White-Space & Unmet-Need Assessment


