|
시장보고서
상품코드
2116927
종이 빨대 : 시장 점유율 분석, 업계 동향과 통계, 성장 예측(2026-2031년)Paper Straw - Market Share Analysis, Industry Trends & Statistics, Growth Forecasts (2026 - 2031) |
||||||
 Mordor Intelligence
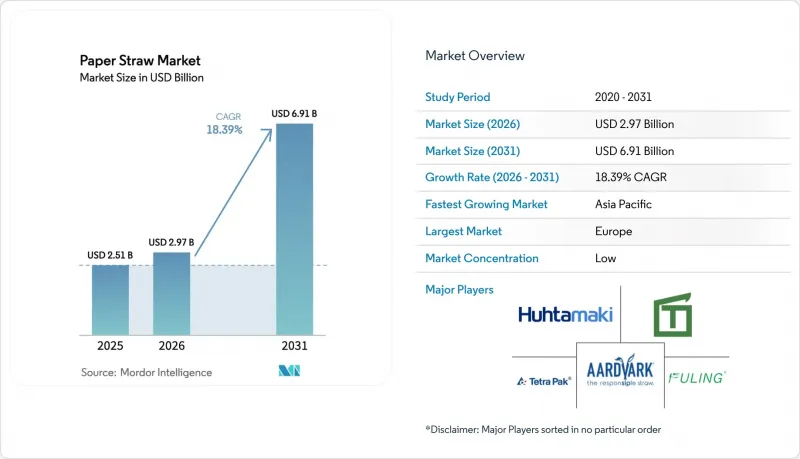
Mordor Intelligence에 따르면 2026년 종이 빨대 시장 규모는 29억 7,000만 달러로 추정되고 있으며, 2025년 25억 1,000만 달러에서 확대하며, 2031년에는 69억 1,000만 달러에 달할 것으로 예측됩니다.
2026-2031년까지 연평균 성장률(CAGR) 18.39%로 성장할 것으로 전망됩니다.
이 보고서는 소재 유형(버진지, 재생지), 빨대 제품 유형(무지, 인쇄·브랜드 표시), 최종 용도 분야(외식 산업, 가정용 소매, 업무용 케이터링),빨대의 직경·크기(표준 6-7mm, 와이드/버블티용 8-12mm, 특수 제품 12mm 이상), 판매 채널(오프라인 B2B 유통, 온라인/E-Commerce), 그리고 지역별로 분류되어 있습니다. 시장 예측은 금액(달러) 기준으로 제시되어 있습니다.
글로벌 종이 빨대 시장의 동향 및 인사이트
전 세계적인 일회용 플라스틱 사용 금지가 시장 변화를 촉진
현재 주요 경제국에서 협조적인 규제가 시행되고 있으며, 소매업체와 음식점은 분해되지 않는 플라스틱 빨대 사용을 중단해야 할 의무가 있습니다. 중국의 ‘플라스틱 오염 대책 행동 계획’과 홍콩의 2024년 시행 금지 조치로 인해 규제 준수에 대한 유예 기간이 단축된 반면, EU의 ‘일회용 플라스틱 지침’은 신흥 시장이 채택하는 시행 모델이 되고 있습니다. 이러한 법규는 측정 가능한 폐기물 감축 목표를 부과하고 있으며, 이를 통해 가공업체들은 새로운 제지 기계 및 코팅 라인에 대한 투자에 자신감을 갖게 되었습니다. 또한 규제의 투명성이 높아짐에 따라 투자자들은 수익성이 낮은 패스트푸드 분야라 하더라도 종이 빨대 시장의 장기적인 판매량이 증가할 것이라고 확신하게 되었습니다.
친환경 제품에 대한 소비자의 선호도가 높아지면서 조달 방식이 변화하고 있습니다.
Z세대는 환경 친화성과 기능성을 모두 갖춘 포장을 원하고 있습니다. 조사에 따르면 이 세대는 물에 젖거나 맛이 변하는 빨대를 싫어하므로 가공 제조업체들은 더 높은 성능 기준을 충족하기 위해 셀룰로오스 나노크리스탈이나 바이오폴리에스터를 이용한 코팅을 개발하고 있습니다. 컴퍼스 그룹(Compass Group)과 같은 대형 케이터링 기업은 이러한 사양을 계약 입찰에 반영하고 있으며, 종이 빨대 업계 전반의 공급업체들에게 진입 기준을 높일 것을 요구하고 있습니다. QSR 체인점들이 재생 가능한 소재 사용에 관한 이정표를 발표함에 따라 소비자의 기대는 더욱 높아지고 있으며, 혁신과 보급이 가속화되고 있습니다.
플라스틱 빨대보다 높은 단가가 보급을 제약하고 있습니다.
플라스틱 빨대 제조 기계는 생산 속도가 빠르고 원자재 비용도 저렴하므로 단위당 경제성이 여전히 유리한 상태를 유지하고 있습니다. 인플레이션으로 인해 외식 사업자의 투입 비용이 상승하더라도, 특히 신흥 시장에서는 조달 팀이 1인분당 비용을 엄격하게 검토하고 있습니다. 포트웨인의 종이 빨대 공장 폐쇄는 이익률 압박이 얼마나 생산 능력 감축으로 이어질 수 있는지를 여실히 보여주고 있습니다. 그러나 매립 처리세 및 플라스틱과 관련된 평판 리스크가 비용 격차를 좁히고 있는 한편, 갈대를 원료로 한 기판 등 새로운 원자재 공급 경로가 추가적인 비용 절감을 약속하고 있습니다.
부문별 분석
2025년에 재활용 종이는 종이 빨대 시장 규모의 51.20%를 차지할 것이며, 2031년까지 연평균 성장률(CAGR) 22.96%를 기록하며 다른 어떤 소재보다 빠르게 성장할 것으로 예측됩니다. 비용 측면에서의 우위는 수거 네트워크의 성숙화에 기인하며, 현재는 고품질 재생 섬유가 식품 등급 용도로 전환되어 사용되고 있습니다. 버진 포장재에 대한 EPR(생산자 책임 확대) 추가 요금도 조달을 재생 원료 쪽으로 더욱 기울게 하고 있습니다. 고급스러운 외관이나 복잡한 인쇄 색상의 경우, 버진 종이의 중요성은 여전히 남아 있지만, 새로운 그을음 제거 공정을 통해 그 차이가 점차 줄어들고 있으며, 고품질 재생 펄프가 고급 브랜드용 채널에도 적합한 소재로 자리 잡고 있습니다.
가공 설비에 대한 투자도 이러한 추세를 반영하고 있습니다. 스트라 엔소(Stora Enso)는 접이식 상자용 판지 및 코팅 크라프트지를 생산하는 오울 공장의 개보수에 10억 유로를 투자했습니다. 이러한 제품들은 식품 접촉용 빨대의 라미네이트 소재로도 활용될 수 있습니다. 생산 라인의 속도가 향상됨에 따라 재생 롤지의 처리 능력은 버진지 라인에 필적하는 수준에 도달하여, 생산량 격차에 대한 우려는 완화되고 있습니다. 제조사와 지자체 폐기물 관리 당국 간의 제휴를 통해 안정적인 섬유 공급이 확보되어, 공장은 현물 가격 변동의 영향을 덜 받게 되었습니다. 이러한 통합은 후발 기업의 진입 장벽을 높여, 종이 빨대 시장에서 초기 재활용 사업자가 가진 우위를 더욱 공고히 하고 있습니다.
2025년에는 패스트푸드점이 단가를 중시함에 따라 무지 빨대가 시장 수익의 56.12%를 차지했습니다. 그러나 소매업체들이 빨대를 소형 광고판으로 활용하기 시작하면서 인쇄 디자인 시장은 연평균 성장률(CAGR) 24.12%로 성장하고 있습니다. 수성 잉크에 대응하는 디지털 인쇄기를 통해 식품 접촉 기준을 충족하면서도 1만개 미만의 소량 생산이 가능해짐에 따라 부티크 카페 등으로도 맞춤 제작 분야가 확대되고 있습니다. 대형 체인점은 영화 개봉이나 스포츠 이벤트와 연계된 정기적인 캠페인을 활용하여 컬렉션용 빨대 세트를 제작하고 있습니다. 이 전략으로 음료 판매 부대율이 향상되어 프리미엄 가격 책정으로 이어지고 있습니다.
프린트 빨대 제조업체들은 과도한 세팅으로 인한 낭비를 줄이면서 이러한 수요에 부응하기 위해 7색 플렉소 모듈 및 자동 판 장착 장치에 투자하고 있습니다. 또한 석유계 잉크에서 식물 유래 잉크로의 전환은 환경에 대한 배려를 강화하며, 빨대의 그래픽과 지속가능성 브랜딩 메시지를 조화시키고 있습니다. 인쇄의 경제성이 향상됨에 따라 시장 분석가들은 인쇄 빨대가 무지 흰색 빨대와의 가격 차이를 좁히고, 향후 10년 동안 종이 빨대 시장에서의 점유율을 확대할 것으로 예측하고 있습니다.
지역별 분석
2025년에는 엄격한 정책 환경과 성숙한 재활용 물류 체계 덕분에 유럽이 종이 빨대 시장 점유율의 30.40%를 차지하며 1위를 차지했습니다. 독일, 프랑스, 영국에서는 공공 기관이 조달 방침을 EU 일회용 플라스틱 지침에 부합하도록 조정하고 있으며, 수요의 기반이 되고 있습니다. 핀란드 오울루의 제지 공장 설비 갱신과 스웨덴 스코네의 드라이 포밍에 대한 투자는 유럽 생산자들이 장기적인 국내 소비에 대해 확신을 가지고 있음을 보여줍니다. 소매업체들은 대륙 간 운송으로 인한 이산화탄소 배출을 피하기 위해 지역내에서 조달된 빨대를 선호하고 있으며, 이로 인해 유럽내 조달 체제가 강화되고 있습니다.
아시아태평양은 중국, 홍콩, 일본에서 동시에 도입된 규제 조치의 지원을 받아 2031년까지 연평균 성장률(CAGR) 20.58%로 성장하고 있습니다. 타피오카 티(버블티)의 폭발적인 인기와 맞물려, 이러한 조치들은 대구경 제품에 대한 향후 수년간의 수요를 확고히 하고 있습니다. 풍부한 섬유 자원과 노동력에 따른 낮은 제조 비용 덕분에 아시아의 공장은 수출 입찰에서 경쟁력을 발휘하고 있으며, 예측 기간 중 이 지역은 절대 생산량 측면에서 유럽을 앞지를 전망입니다. 각 제조사들은 유럽과 미국의 식품 접촉 기준을 충족하기 위해 자동 검사 시스템 도입을 빠르게 추진하고 있으며, 이로 인해 고급 시장에서의 수용이 가속화되고 있습니다.
북미에서는 주 차원의 규제가 해안 지역에서 중서부 지역으로 확대됨에 따라 꾸준한 성장이 예상됩니다. 맥도날드와 시스코의 노력 덕분에 규제가 여전히 제각각인 지역에서도 일정한 수요량이 확보되고 있습니다. 패킹 코퍼레이션 오브 아메리카(Packing Corporation of America)와 같은 대형 종합 제조업체는 2025년에 사상 최대 매출인 21억 달러를 기록하며 최종 시장의 지속적인 건전성을 부각시켰습니다. 벤처 자금은 해조류나 갈대 같은 틈새 소재에 집중되고 있으며, 대규모 제지 관련 자산을 보완하는 다양한 혁신 분야가 부각되고 있습니다.
기타 혜택:
- 엑셀 형식의 시장 예측(ME) 시트
- 3개월간의 애널리스트 지원
자주 묻는 질문
목차
제1장 서론
제2장 조사 방법
제3장 개요
제4장 시장 구도
제5장 시장 규모와 성장 예측
제6장 경쟁 구도
제7장 시장 기회와 향후 전망
KSA 26.08.26According to Mordor Intelligence, paper straw market size in 2026 is estimated at USD 2.97 billion, growing from 2025 value of USD 2.51 billion with 2031 projections showing USD 6.91 billion, growing at 18.39% CAGR over 2026-2031.
This report is Segmented by Material Type (Virgin Paper, Recycled Paper), Straw Product Type (Non-Printed, Printed/Branded), End-Use Sector (Foodservice, Household Retail, Institutional Catering), Straw Diameter/Size (Standard 6-7mm, Wide/Bubble-tea 8-12mm, Specialty Greater12mm), Sales Channel (Offline B2B Distribution, Online/E-commerce), and Geography. The Market Forecasts are Provided in Terms of Value (USD).
Global Paper Straw Market Trends and Insights
Global bans on single-use plastics drive market transformation
Coordinated restrictions now cover major economies, obligating retailers and food outlets to remove non-degradable plastic straws from service. China's Plastic Pollution Control Action Plan and Hong Kong's 2024 prohibition have tightened compliance windows, while the EU Single-Use Plastics Directive supplies the enforcement template used by emerging markets. These statutes impose measurable waste-reduction targets, giving converters the confidence to finance new paper machines and coating lines. Regulatory visibility also reassures investors that long-term volumes in the paper straw market will rise even in low-margin quick-service segments.
Growing consumer preference for eco-friendly products reshapes procurement
Generation Z demands packaging that blends environmental credibility with functional rigor. Surveys show that this cohort rejects soggy or taste-altering straws, so converters are developing cellulose-nanocrystal and bio-polyester coatings to meet higher performance thresholds. Catering giants such as Compass Group integrate these specifications into contract bids, forcing suppliers across the paper straw industry to raise barrier standards. As QSR chains publicize renewable-content milestones, the consumer expectation loop tightens, accelerating innovation and uptake.
Higher unit cost than plastic straws constrains penetration
Plastic machines benefit from higher production speeds and cheaper feedstocks, keeping unit economics in their favor. When inflation lifts input costs for foodservice operators, procurement teams still scrutinize cents-per-serving, especially in emerging markets. The closure of a Fort Wayne paper straw plant underscores how tight margins can trigger capacity cuts. However, landfill levies and reputational risks tied to plastic are narrowing the gap, while new raw-material pathways such as reed-based substrates promise further cost relief.
Other drivers and restraints analyzed in the detailed report include:
- Fast-food and QSR sustainability pledges create demand anchors
- Extended Producer Responsibility mandates accelerate supply chain integration
- Functional performance limitations drive technology innovation
For complete list of drivers and restraints, kindly check the Table Of Contents.
Segment Analysis
Recycled paper generated 51.20% of paper straw market size in 2025 and is forecast to climb faster than any other substrate, posting a 22.96% CAGR through 2031. Cost advantages arise from maturing collection networks that now divert higher-quality recovered fiber into food-grade applications. EPR surcharges for virgin packaging further tilt procurement toward recycled input. Virgin paper retains relevance for premium aesthetics and complicated print colors, yet new soot-removal processes are closing that gap and making high-grade recycled pulp fit for upscale brand channels.
Conversion investments reflect this momentum. Stora Enso allocated EUR 1 billion to retrofit its Oulu mill for folding box board and coated kraft, supplies that can also feed food-contact straw laminations. As line speeds rise, throughput for recycled rolls is matching virgin lines, easing concerns on output differentials. Manufacturer alliances with municipal waste authorities secure stable fiber inflows, insulating plants from spot price volatility. Such integration raises entry barriers for late entrants and reinforces the advantage held by early recyclers in the paper straw market.
Unprinted straws kept 56.12% of market revenue in 2025 because quick-service restaurants prioritize unit cost. Printed designs, however, are growing at 24.12% CAGR as retailers treat straws as miniature billboards. Digital presses that handle water-based inks now allow sub-10,000-piece runs while retaining food-contact compliance, opening the customization field to boutique cafes. Mass chains use recurring campaigns tied to movie releases or sporting events to create collectable straw sets, a tactic that increases beverage attachment rates and captures premium pricing.
Printed-straw converters invest in seven-color flexo modules and automated plate-mounting to satisfy these briefs without excessive setup waste. The transition from petroleum-based inks to vegetable formulations also advances environmental credentials, harmonizing messaging across straw graphics and sustainability branding. As printing economics improve, market analysts expect printed options to narrow the price delta with plain white counterparts, amplifying their share of the paper straw market over the decade.
Complete Report Scope:
- By Material Type
- Virgin Paper
- Recycled Paper
- By Straw Product Type
- Non-printed
- Printed / Branded
- By End-Use Sector
- Foodservice (QSR, cafes, bars)
- Household Retail
- Institutional Catering (schools, hospitals, airlines)
- By Straw Diameter / Size
- Standard (6-7 mm)
- Wide / Bubble-tea (8-12 mm)
- Specialty (greater than 12 mm)
- By Sales Channel
- Offline B2B Distribution
- Online / E-commerce
- By Geography
- North America
- United States
- Canada
- Mexico
- Europe
- United Kingdom
- Germany
- France
- Italy
- Rest of Europe
- Asia-Pacific
- China
- Japan
- India
- South Korea
- Rest of Asia-Pacific
- Middle East
- Israel
- Saudi Arabia
- United Arab Emirates
- Turkey
- Rest of Middle East
- Africa
- South Africa
- Egypt
- Rest of Africa
- South America
- Brazil
- Argentina
- Rest of South America
- North America
Geography Analysis
Europe led with a 30.40% paper straw market share in 2025 thanks to an enforcement-heavy policy environment and mature recycling logistics. Germany, France, and the United Kingdom anchor demand as public institutions align procurement with the EU Single-Use Plastics Directive. Mill upgrades at Oulu, Finland, and dry-forming investments in Skene, Sweden, demonstrate European producers' confidence in long-term domestic consumption. Retailers favor regionally supplied straws to avoid carbon emissions from transcontinental shipping, reinforcing intra-European sourcing.
Asia-Pacific is growing at 20.58% CAGR to 2031, propelled by synchronized regulatory acts in China, Hong Kong, and Japan. Combined with the runaway popularity of bubble tea, these measures lock in multi-year demand for wide-diameter products. Lower conversion costs due to abundant fiber and labor pools allow Asian plants to compete on export tenders, positioning the region to surpass Europe in absolute volume during the forecast. Manufacturers are rapidly integrating automated inspection to meet Western food-contact standards, accelerating acceptance in premium markets.
North America delivers steady expansion as state-level bans spread from coastal regions toward the Midwest. McDonald's and Sysco's commitments guarantee baseline volume even where regulation remains patchwork. Large integrated producers like Packaging Corporation of America reported record 2025 revenue of USD 2.1 billion, spotlighting sustained end-market health. Venture funding targets niche materials such as seaweed or reed, underlining a diverse innovation scene that complements scaled paper assets.
- Aardvark Straws LLC (Hoffmaster Group Inc.)
- Huhtamaki Oyj
- Transcend Packaging Ltd
- Tembo Paper B.V.
- Tetra Pak International SA
- Fuling Global Inc.
- Uflex Ltd
- Canada Brown Eco Products Ltd
- Karat Packaging Inc.
- IPI Srl
- Footprint International Holdings Inc.
- Biopac UK Ltd
- Lollicup USA Inc.
- OkStraw Paper Straws
- Strawland Packaging Co. Ltd
- Vegware Ltd
- Ningbo Henvcon Package Co. Ltd
- Soton Daily Necessities Co. Ltd
- GP PRO (Georgia-Pacific LLC)
- U.S. Paper Straw
Additional Benefits:
- The market estimate (ME) sheet in Excel format
- 3 months of analyst support
TABLE OF CONTENTS
1 INTRODUCTION
- 1.1 Study Assumptions and Market Definition
- 1.2 Scope of the Study
2 RESEARCH METHODOLOGY
3 EXECUTIVE SUMMARY
4 MARKET LANDSCAPE
- 4.1 Market Overview
- 4.2 Market Drivers
- 4.2.1 Global bans on single-use plastics
- 4.2.2 Growing consumer preference for eco-friendly products
- 4.2.3 Fast-food and QSR sustainability pledges
- 4.2.4 Extended Producer Responsibility (EPR) mandates
- 4.2.5 Breakthrough hydrophobic paper-coating technologies
- 4.2.6 Retail private-label "green branding" initiatives
- 4.3 Market Restraints
- 4.3.1 Higher unit cost than plastic straws
- 4.3.2 Functional performance (sogginess, taste)
- 4.3.3 PFAS contamination scrutiny
- 4.3.4 Sustainable fiber supply bottlenecks
- 4.4 Value / Supply-Chain Analysis
- 4.5 Regulatory Landscape
- 4.6 Technological Outlook
- 4.7 Porter's Five Forces Analysis
- 4.7.1 Bargaining Power of Suppliers
- 4.7.2 Bargaining Power of Buyers
- 4.7.3 Threat of New Entrants
- 4.7.4 Threat of Substitutes
- 4.7.5 Competitive Rivalry
- 4.8 Industry Value-Chain Analysis
- 4.9 Geopolitical Impact Assessment
5 MARKET SIZE AND GROWTH FORECASTS (VALUE)
- 5.1 By Material Type
- 5.1.1 Virgin Paper
- 5.1.2 Recycled Paper
- 5.2 By Straw Product Type
- 5.2.1 Non-printed
- 5.2.2 Printed / Branded
- 5.3 By End-Use Sector
- 5.3.1 Foodservice (QSR, cafes, bars)
- 5.3.2 Household Retail
- 5.3.3 Institutional Catering (schools, hospitals, airlines)
- 5.4 By Straw Diameter / Size
- 5.4.1 Standard (6-7 mm)
- 5.4.2 Wide / Bubble-tea (8-12 mm)
- 5.4.3 Specialty (greater than 12 mm)
- 5.5 By Sales Channel
- 5.5.1 Offline B2B Distribution
- 5.5.2 Online / E-commerce
- 5.6 By Geography
- 5.6.1 North America
- 5.6.1.1 United States
- 5.6.1.2 Canada
- 5.6.1.3 Mexico
- 5.6.2 Europe
- 5.6.2.1 United Kingdom
- 5.6.2.2 Germany
- 5.6.2.3 France
- 5.6.2.4 Italy
- 5.6.2.5 Rest of Europe
- 5.6.3 Asia-Pacific
- 5.6.3.1 China
- 5.6.3.2 Japan
- 5.6.3.3 India
- 5.6.3.4 South Korea
- 5.6.3.5 Rest of Asia-Pacific
- 5.6.4 Middle East
- 5.6.4.1 Israel
- 5.6.4.2 Saudi Arabia
- 5.6.4.3 United Arab Emirates
- 5.6.4.4 Turkey
- 5.6.4.5 Rest of Middle East
- 5.6.5 Africa
- 5.6.5.1 South Africa
- 5.6.5.2 Egypt
- 5.6.5.3 Rest of Africa
- 5.6.6 South America
- 5.6.6.1 Brazil
- 5.6.6.2 Argentina
- 5.6.6.3 Rest of South America
- 5.6.1 North America
6 COMPETITIVE LANDSCAPE
- 6.1 Market Concentration
- 6.2 Strategic Moves
- 6.3 Market Share Analysis
- 6.4 Company Profiles (includes Global Overview, Market-Level Overview, Core Segments, Financials as available, Strategic Information, Market Rank/Share, Products and Services, Recent Developments)
- 6.4.1 Aardvark Straws LLC (Hoffmaster Group Inc.)
- 6.4.2 Huhtamaki Oyj
- 6.4.3 Transcend Packaging Ltd
- 6.4.4 Tembo Paper B.V.
- 6.4.5 Tetra Pak International SA
- 6.4.6 Fuling Global Inc.
- 6.4.7 Uflex Ltd
- 6.4.8 Canada Brown Eco Products Ltd
- 6.4.9 Karat Packaging Inc.
- 6.4.10 IPI Srl
- 6.4.11 Footprint International Holdings Inc.
- 6.4.12 Biopac UK Ltd
- 6.4.13 Lollicup USA Inc.
- 6.4.14 OkStraw Paper Straws
- 6.4.15 Strawland Packaging Co. Ltd
- 6.4.16 Vegware Ltd
- 6.4.17 Ningbo Henvcon Package Co. Ltd
- 6.4.18 Soton Daily Necessities Co. Ltd
- 6.4.19 GP PRO (Georgia-Pacific LLC)
- 6.4.20 U.S. Paper Straw
7 MARKET OPPORTUNITIES AND FUTURE OUTLOOK
- 7.1 White-space and Unmet-Need Assessment