|
시장보고서
상품코드
2117204
IT 자산 처분 : 시장 점유율 분석, 업계 동향과 통계, 성장 예측(2026-2031년)IT Asset Disposition - Market Share Analysis, Industry Trends & Statistics, Growth Forecasts (2026 - 2031) |
||||||
 Mordor Intelligence
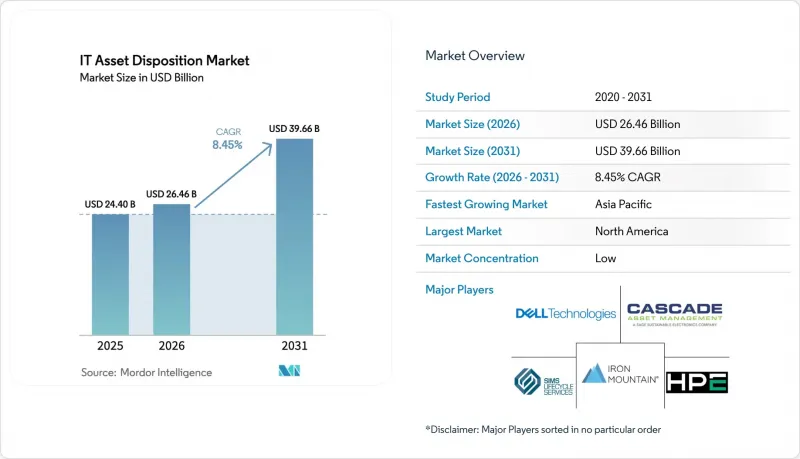
Mordor Intelligence에 따르면 IT 자산 처분 시장 규모는 2025년 244억 달러에서 2026년에는 264억 6,000만 달러로 확대되고, 2026년부터 2031년까지 CAGR 8.45%를 기록하며 2031년에는 396억 6,000만 달러에 달할 것으로 예측됩니다.
본 보고서는 서비스별(데이터 삭제·파기, 재판매/리마케팅, 재활용 및 자재 회수, 리버스 물류 및 창고 보관, 풀스택 자산 수명주기 관리), 자산 유형별(데스크톱/노트북, 모바일 단말기, 서버 등), 기업 규모별(대기업, 중소기업), 최종사용자 산업(BFSI, IT·통신, 헬스케어 등), 및 지역별로 분류되어 있습니다.
세계 IT 자산 처분 시장의 동향 및 인사이트
AI 지원 데이터센터의 교체 주기 급격한 확대
AI에 최적화된 인프라의 교체 주기가 단축됨에 따라, 전례 없는 규모의 하드웨어가 IT 자산 처분 시장으로 유입되고 있습니다. 기업들은 AI 지원 기기로의 전환에 따라 2025년 중 약 2억 4,000만 대의 Windows 10 PC를 폐기했으며, 이에 따라 자산 처분 업체들은 처리 능력을 확대하는 동시에 데이터 삭제 기준을 더욱 엄격히 적용할 수밖에 없는 상황입니다. 2022년, 데이터센터에서는 6,190만 메트르톤의 전자폐기물이 발생했으나, 정식 재활용을 통해 회수된 양은 그 중 고작 22.3%에 그쳤으며, 이 격차를 메우기 위해 인증 공급업체들이 급속도로 대응하고 있다는 사실이 부각되고 있습니다. 마이크로소프트의 Cyclic Materials에 대한 투자는 폐기된 하드 드라이브에서 희토류를 회수하는 방향으로의 전환을 보여주며, 데이터 보안과 첨단 소재 추출이 밀접하게 연결되어 있음을 시사합니다. 분쇄 처리, 자석 제거, 정밀한 금속 분리를 통합할 수 있는 공급업체들은 현재 높은 수익률을 확보하고 있습니다. AI 워크로드가 확대됨에 따라 서버급 GPU에 대한 수요가 증가하고, 서버 교체 주기가 더욱 단축됨에 따라 IT 자산 처분 시장의 장기적인 성장이 지속될 것입니다.
리버스 물류 조항을 포함한 ‘DaaS(Device-as-a-Service)’ 계약
DaaS(Device-as-a-Service) 모델은 수명주기 종료 시의 의무를 구매자에서 공급업체로 이전하고, 인증된 회수 경로를 보장함과 동시에 처분량의 안정화를 도모합니다. 2025년 Cascade Asset Management가 55개사를 대상으로 실시한 조사에 따르면, 응답자의 34%가 IT 조달에 ESG 기준을 반영하고 있으며, 이는 2년 전의 18%에서 증가한 수치입니다. 대규모로 분산된 직원들은 택배를 통한 회수 및 검증된 보관 이력 추적에 의존하고 있으며, 이에 따라 폐기 업체들은 지오펜스 기능이 탑재된 스케줄링 소프트웨어와 변조 방지 포장에 대한 투자를 확대하고 있습니다. 표준화된 반품 조항을 통해 그레이 마켓으로의 유출이 억제되고, 리마케팅 채널의 수요 예측 정확도가 향상됩니다. 장기적으로는 통합된 역물류 시스템을 통해 리커머스 흐름이 정상화되어, IT 자산 처분 시장에서 재생 노트북 및 스마트폰의 가격 안정화가 뒷받침될 것으로 예상됩니다.
분산된 전 세계 보관 이력(체인 오브 커스터디) 기준
다국적 기업들은 폐기물 분류, 운송 허가, 데이터 삭제 증명과 관련하여 국가마다 상충되는 규정으로 인해 종종 골머리를 앓고 있습니다. 유럽 산업 원탁 회의(European Round Table for Industry)는 2025년에 국경을 넘는 전자폐기물 흐름을 방해하는 100개 이상의 규제 장벽을 목록화했으며, 여기에는 리튬이온 배터리 운송 요건의 차이도 포함되어 있습니다. 2025년 1월에 발효된 바젤 협약 개정안에 따라 수출업체는 많은 전자 스크랩 범주에 대해 사전 정보에 기반한 동의(PIC)를 취득해야 할 의무가 부과되었으며, 이로 인해 운송 시간이 길어지고 관리상의 부담이 증가하고 있습니다. 다국적으로 사업을 전개하는 폐기물 처리 기업들은 컴플라이언스 부서를 통해 이러한 비용을 흡수하고 있지만, 소규모 전문 업체들은 이익률이 압박받거나 사업을 양도하게 되어 IT 자산 폐기 시장 전체의 성장을 둔화시키고 있습니다.
부문 분석
재판매 및 리마케팅은 2025년 매출의 36.95%를 차지하며, 예측 가능한 중고 장비 수요를 통해 IT 자산 처분 시장의 기반을 형성하고 있습니다. 그러나 급성장하고 있는 ‘풀스택 자산 수명주기 관리’ 제품군은 연평균 성장률(CAGR) 12.25%를 기록하며, 예측 기간 동안 IT 자산 처분 시장 전체에서 그 점유율을 끌어올릴 것으로 전망됩니다. 기업들은 규정 준수를 간소화하고 구매 주기의 초기 단계에서 잔존 가치에 대한 인사이트를 얻기 위해 조달, 유지보수, 처분을 단일 마스터 서비스 계약으로 통합하고 있습니다.
풀스택 프로그램에는 도입 시 자산 태깅, 폐기 시 펌웨어 삭제, 네오디뮴 등 중요 광물의 소재 회수가 통합되어 있습니다. 실시간 재고 포털, 인증된 물류, 다운스트림 정제 파트너십을 결합한 공급업체는 순수한 재판매 마진이 상품화되더라도 가격 경쟁력을 유지할 수 있습니다. 이러한 통합적인 접근 방식 덕분에 ITAD(IT 자산 처분)와 매니지드 서비스의 경계가 모호해지면서, IT 자산 처분 시장에서 고객 충성도가 더욱 높아지고 있습니다.
2025년에는 기업 내 모바일 단말기의 지속적인 교체로 인해 데스크톱 및 노트북이 IT 자산 처분 시장의 30.45%를 차지했습니다. 그러나 하이퍼스케일러가 x86 랙을 GPU 고밀도 노드로 대체함에 따라 서버 처리량은 연평균 성장률(CAGR) 12%로 확대되어 IT 자산 처분 시장에서의 점유율을 확대할 전망입니다. 랙 스케일 폐기물 처리의 경우, 현장 파쇄 처리나 일련번호를 통한 부품 추적이 선호되기 때문에 물류 처리의 복잡성이 증가하고 있습니다.
AI 가속기를 탑재한 블레이드 서버는 중고 시장에서 고가에 거래되므로, 재판매 가치를 극대화하기 위해 외관을 세심하게 관리해야 합니다. 또한, 하이퍼 컨버지드 인프라(HCI)에서 스토리지, 컴퓨팅, 네트워크가 통합됨에 따라 처분 전문 업체에 대한 기술적 장벽도 높아지고 있습니다. SSD를 분리하여 안전하게 데이터를 삭제하고, 동시에 방열판의 구리를 회수할 수 있는 기업은 IT 자산 처분 시장에서 성장 기회를 최대한 포착하는 데 가장 유리한 입장에 있습니다.
지역별 분석
북미는 2025년에도 매출의 41.35%를 차지했으며, 그 배경에는 SEC(미국 증권거래위원회)의 기후 변화 정보 공개, 성숙한 중고 하드웨어 유통 채널, 그리고 R2v3와 같은 정착된 인증 프로토콜이 있습니다. Carahsoft와 같은 유통업체를 통해 수주한 정부 계약은 연방 정부의 수요를 안정화시키고, 텍사스주, 오하이오주, 온타리오주의 파쇄 시설 가동률을 높은 수준으로 유지하고 있습니다.
유럽에서는 CSRD나 WEEE와 같은 법규를 활용하여 순환 경제 목표를 추진하고 있으며, 문서화의 철저함이 경쟁상의 차별화 요인이 되고 있습니다. EU 내 규제의 불균일성은 규정 준수 비용을 높이지만, 다국어 감사 체제에 대응할 수 있는 공급업체에게는 프리미엄 가격 책정 기회로도 작용하고 있습니다. 바젤 협약의 수출 규제 개정에 따라 채널을 넘나드는 흐름에 대한 행정 절차가 복잡해지고 있으며, 독일, 프랑스, 북유럽 국가에 현지 처리 능력을 갖춘 폐기물 처리 기업이 유리한 입장에 있습니다.
아시아태평양은 디지털 정부 프로그램 및 하이퍼스케일 투자의 급속한 확대를 반영하여 연평균 성장률(CAGR) 12.8%로 성장하고 있습니다. SK테스의 VSD 홀딩스와의 합작 회사는 2026년 초까지 하노이에 공장을 개설할 예정이며, 이는 동남아시아가 회수에서 완전한 처리로 전환되고 있음을 여실히 보여줍니다. 중국의 확대 생산자 책임(EPR) 규정과 인도의 전자폐기물(관리) 개정법에 따라 OEM 기업들은 국내에서 재활용을 증명해야 하며, 이는 라이선스를 취득한 현지 파트너십을 통해 전 세계 ITAD 브랜드의 시장 진입 경로가 되고 있습니다. 이러한 동향들이 결합되면서 IT 자산 처분 시장의 수익원이 다각화되고, 환율 리스크 헤지 효과도 거두고 있습니다.
기타 혜택:
- 엑셀 형식의 시장 예측(ME) 시트
- 3개월간의 애널리스트 지원
자주 묻는 질문
목차
제1장 소개
제2장 조사 방법
제3장 주요 요약
제4장 시장 구도
제5장 시장 규모와 성장 예측
제6장 경쟁 구도
제7장 시장 기회와 향후 전망
KSM 26.08.26According to Mordor Intelligence, the IT asset disposition market size is expected to grow from USD 24.4 billion in 2025 to USD 26.46 billion in 2026 and is forecast to reach USD 39.66 billion by 2031 at 8.45% CAGR over 2026-2031.
This report is Segmented by Service (Data Sanitisation and Destruction, Resale / Remarketing, Recycling and Material Recovery, Reverse Logistics and Warehousing, Full-Stack Asset Lifecycle Management), Asset Type (Desktop / Laptop, Mobile Devices, Servers, and More), Enterprise Size (Large Enterprises, Small and Medium Enterprises), End-User Industry (BFSI, IT and Telecom, Healthcare, and More), and Geography.
Global IT Asset Disposition Market Trends and Insights
Explosion of AI-ready Data-Centre Refresh Cycles
Compressed refresh intervals for AI-optimized infrastructure are channeling unprecedented hardware volumes into the IT asset disposition market. Enterprises are retiring an estimated 240 million Windows 10 PCs during 2025 as they transition to AI-capable devices, forcing disposition providers to expand capacity while elevating data-sanitization rigor. Data centers generated 61.9 million metric tonnes of e-waste in 2022, yet formal recycling captured only 22.3% of that stream, underscoring a gap that certified vendors are rushing to fill. Microsoft's investment in Cyclic Materials illustrates the pivot toward rare-earth recovery from retired hard drives, intertwining data security with advanced materials extraction. Providers able to integrate shredding, degaussing, and precision metals separation now command premium margins. As AI workloads proliferate, demand for server-grade GPUs will further compress server refresh timelines, sustaining long-run growth for the IT asset disposition market.
Device-as-a-Service Contracts Embedding Reverse-Logistics Clauses
DaaS models shift end-of-life obligations from buyers to vendors, guaranteeing certified take-back pathways and stabilizing disposition volumes. The 2025 Cascade Asset Management survey of 55 enterprises reported that 34% of respondents embed ESG benchmarks in IT procurement, up from 18% two years earlier. Large, distributed workforces rely on courier-based pick-up and validated chain-of-custody tracking, which is prompting disposition firms to invest in geofenced scheduling software and tamper-evident packaging. Standardized return clauses reduce leakage into grey markets and improve forecasting for remarketing channels. Over the long term, embedded reverse logistics is expected to normalize re-commerce flows, underpinning price stability for refurbished laptops and smartphones in the IT asset disposition market.
Fragmented Global Chain-of-Custody Standards
Multinational corporations often wrestle with conflicting national rules on waste classification, shipment permits, and data-destruction attestations. The European Round Table for Industry catalogued more than 100 regulatory barriers hampering cross-border e-waste flows in 2025, including diverging lithium-ion battery transit requirements. Basel Convention amendments effective January 2025 now obligate exporters to secure prior informed consent for many e-scrap categories, prolonging transit times and elevating administrative overhead. Disposition firms with multinational footprints absorb these costs through compliance departments, but smaller specialists lose margin or cede business, tempering overall IT asset disposition market growth.
Other drivers and restraints analyzed in the detailed report include:
- Mandatory Carbon-Accounting Disclosures Elevating ITAD Demand
- ESG-Linked Credit Pricing Rewarding Certified Circular-Tech Practices
- Talent Shortages in Certified Data-Destruction Operatives
For complete list of drivers and restraints, kindly check the Table Of Contents.
Segment Analysis
Resale and remarketing captured 36.95% of 2025 revenue, anchoring the IT asset disposition market through predictable secondary-device demand. Yet the fast-growing Full-Stack Asset Lifecycle Management suite is posting a 12.25% CAGR that will lift its contribution within the overall IT asset disposition market size over the forecast period. Enterprises are bundling procurement, maintenance, and disposition under a single master service agreement to simplify compliance and unlock residual-value insights early in the buying cycle.
Full-stack programs integrate asset tagging at deployment, firmware erasure at retirement, and materials reclamation for critical minerals such as neodymium. Providers that combine real-time inventory portals, certified logistics, and downstream refining partnerships can defend pricing, even as pure-play resale margins commoditize. This integrated stance blurs the line between ITAD and managed services, deepening stickiness in the IT asset disposition market.
Desktop and laptop devices held 30.45% of the IT asset disposition market share in 2025 due to persistent enterprise mobility refreshes. However, server volumes are slated to expand at a 12% CAGR, enlarging their slice of the IT asset disposition market size as hyperscalers replace x86 racks with GPU-dense nodes. Rack-scale retirements favor on-site shredding and serialized component tracking, elevating logistics complexity.
Blades housing AI accelerators fetch a premium in secondary markets, encouraging meticulous cosmetic handling to maximize resale value. The convergence of storage, compute, and networking within hyper-converged infrastructure also raises the technical bar for disposition specialists. Firms capable of separating solid-state drives for secure erasure while harvesting heat-sink copper are best positioned to capture upside in the IT asset disposition market.
Complete Report Scope:
- By Service
- Data Sanitisation and Destruction
- Resale / Remarketing
- Recycling and Material Recovery
- Reverse Logistics and Warehousing
- Full-Stack Asset Lifecycle Management
- By Asset Type
- Desktop / Laptop
- Mobile Devices
- Servers
- Storage Devices
- Networking and Edge Equipment
- Others
- By Enterprise Size
- Large Enterprises
- Small and Medium Enterprises
- By End-user Industry
- BFSI
- IT and Telecom
- Healthcare
- Government and Public Institutions
- Industrial and Energy
- Education and Others
- By Geography
- North America
- United States
- Canada
- Europe
- Germany
- United Kingdom
- France
- Rest of Europe
- Asia-Pacific
- China
- Japan
- India
- South Korea
- Rest of Asia-Pacific
- South America
- Brazil
- Rest of South America
- Middle East and Africa
- Middle East
- GCC
- Turkey
- Africa
- South Africa
- Rest of Africa
- North America
Geography Analysis
North America retained a 41.35% revenue stake in 2025, underpinned by SEC climate disclosures, mature secondary-hardware channels, and entrenched certification protocols such as R2v3. Government contracts accessed through distributors like Carahsoft ensure predictable federal demand, keeping utilization rates high for shredding plants in Texas, Ohio, and Ontario.
Europe leverages CSRD and WEEE legislation to enforce circular-economy targets, making documentation depth a competitive differentiator. Regulatory heterogeneity across the bloc heightens compliance costs but also invites premium pricing for vendors that can navigate multi-language audit regimes. Basel Convention export revisions add administrative layers for cross-channel flows, favoring disposition firms with local processing capacity in Germany, France, and the Nordics.
Asia-Pacific is expanding at a 12.8% CAGR, reflecting digital government programs and booming hyperscale investments. SK Tes's joint venture with VSD Holdings will open a Hanoi plant by early 2026, underlining Southeast Asia's shift from collection to full processing. Chinese Extended Producer Responsibility rules and India's e-Waste (Management) Amendment impel OEMs to prove domestic recycling, presenting an entry path for global ITAD brands through licensed local partnerships. Together these dynamics diversify revenue for the IT asset disposition market and hedge currency risk.
- Iron Mountain
- Dell Technologies
- Sims Lifecycle Services
- Hewlett Packard Enterprise
- Cascade Asset Management
- Apto Solutions
- SK tes
- Ingram Micro
- Procurri
- Wisetek
- Sage Sustainable Electronics
- Arrow Value Recovery
- DMD Systems
- CloudBlue
- Celestica
- IBM Global Asset Recovery
- Global Resale
- TES-AMM
- ERI
- PlanITROI
Additional Benefits:
- The market estimate (ME) sheet in Excel format
- 3 months of analyst support
TABLE OF CONTENTS
1 INTRODUCTION
- 1.1 Study Assumptions and Market Definition
- 1.2 Scope of the Study
2 RESEARCH METHODOLOGY
3 EXECUTIVE SUMMARY
4 MARKET LANDSCAPE
- 4.1 Market Overview
- 4.2 Market Drivers
- 4.2.1 Explosion of AI-Ready Data-Centre Refresh Cycles
- 4.2.2 Device-As-A-Service (Daas) Contracts Embedding Reverse-Logistics Clauses
- 4.2.3 Mandatory Carbon-Accounting Disclosures (SEC, CSRD) Elevating ITAD Demand
- 4.2.4 ESG-Linked Credit Pricing Rewarding Certified Circular-Tech Practices
- 4.2.5 Hyperscaler Divest-to-Invest Model for Legacy Servers in Emerging Regions
- 4.2.6 On-Premise HSM/TPM Retirement Triggered by Post-Quantum Crypto Migrations
- 4.3 Market Restraints
- 4.3.1 Fragmented Global Chain-of-Custody Standards
- 4.3.2 Talent Shortages in Certified Data-Destruction Operatives
- 4.3.3 Battery-Fire Insurance Premiums for Logistics Providers
- 4.3.4 Growing Grey-Market Exports Driving Price Compression
- 4.4 Regulatory Landscape
- 4.5 Technological Outlook
- 4.6 Porter's Five Forces Analysis
- 4.6.1 Bargaining Power of Suppliers
- 4.6.2 Bargaining Power of Buyers
- 4.6.3 Threat of New Entrants
- 4.6.4 Threat of Substitute Products
- 4.6.5 Intensity of Competitive Rivalry
5 MARKET SIZE AND GROWTH FORECASTS (VALUE)
- 5.1 By Service
- 5.1.1 Data Sanitisation and Destruction
- 5.1.2 Resale / Remarketing
- 5.1.3 Recycling and Material Recovery
- 5.1.4 Reverse Logistics and Warehousing
- 5.1.5 Full-Stack Asset Lifecycle Management
- 5.2 By Asset Type
- 5.2.1 Desktop / Laptop
- 5.2.2 Mobile Devices
- 5.2.3 Servers
- 5.2.4 Storage Devices
- 5.2.5 Networking and Edge Equipment
- 5.2.6 Others
- 5.3 By Enterprise Size
- 5.3.1 Large Enterprises
- 5.3.2 Small and Medium Enterprises
- 5.4 By End-user Industry
- 5.4.1 BFSI
- 5.4.2 IT and Telecom
- 5.4.3 Healthcare
- 5.4.4 Government and Public Institutions
- 5.4.5 Industrial and Energy
- 5.4.6 Education and Others
- 5.5 By Geography
- 5.5.1 North America
- 5.5.1.1 United States
- 5.5.1.2 Canada
- 5.5.2 Europe
- 5.5.2.1 Germany
- 5.5.2.2 United Kingdom
- 5.5.2.3 France
- 5.5.2.4 Rest of Europe
- 5.5.3 Asia-Pacific
- 5.5.3.1 China
- 5.5.3.2 Japan
- 5.5.3.3 India
- 5.5.3.4 South Korea
- 5.5.3.5 Rest of Asia-Pacific
- 5.5.4 South America
- 5.5.4.1 Brazil
- 5.5.4.2 Rest of South America
- 5.5.5 Middle East and Africa
- 5.5.5.1 Middle East
- 5.5.5.2 GCC
- 5.5.5.3 Turkey
- 5.5.6 Africa
- 5.5.6.1 South Africa
- 5.5.6.2 Rest of Africa
- 5.5.1 North America
6 COMPETITIVE LANDSCAPE
- 6.1 Market Concentration
- 6.2 Strategic Moves
- 6.3 Market Share Analysis
- 6.4 Company Profiles (Includes global-level overview, market-level overview, core segments, financials (as available), strategic information, market rank/share, products and services, and recent developments)
- 6.4.1 Iron Mountain
- 6.4.2 Dell Technologies
- 6.4.3 Sims Lifecycle Services
- 6.4.4 Hewlett Packard Enterprise
- 6.4.5 Cascade Asset Management
- 6.4.6 Apto Solutions
- 6.4.7 SK tes
- 6.4.8 Ingram Micro
- 6.4.9 Procurri
- 6.4.10 Wisetek
- 6.4.11 Sage Sustainable Electronics
- 6.4.12 Arrow Value Recovery
- 6.4.13 DMD Systems
- 6.4.14 CloudBlue
- 6.4.15 Celestica
- 6.4.16 IBM Global Asset Recovery
- 6.4.17 Global Resale
- 6.4.18 TES-AMM
- 6.4.19 ERI
- 6.4.20 PlanITROI
7 MARKET OPPORTUNITIES AND FUTURE OUTLOOK
- 7.1 White-space and Unmet-Need Assessment