

|
시장보고서
상품코드
2117229
금속 가공제품 시장 : 시장 점유율 분석, 업계 동향 및 통계, 성장 예측(2026-2031년)Fabricated Metal Products - Market Share Analysis, Industry Trends & Statistics, Growth Forecasts (2026 - 2031) |
||||||
 Mordor Intelligence
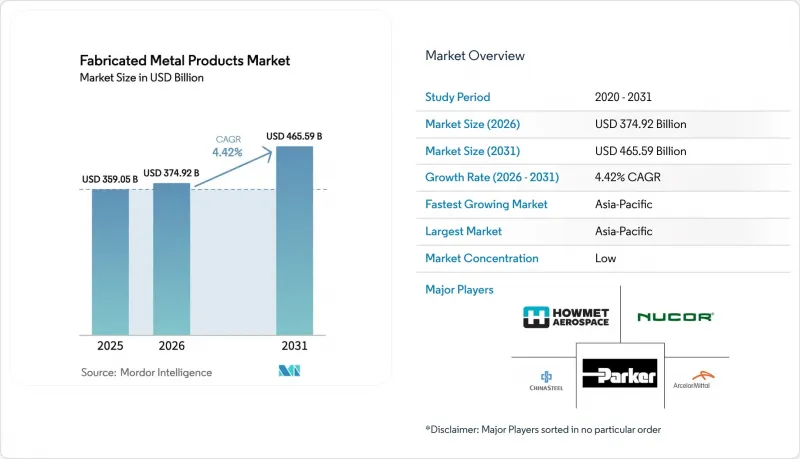
Mordor Intelligence에 의하면, 금속 가공제품 시장 규모는 2025년에 3,590억 5,000만 달러로 평가되었고, 2026년 3,749억 2,000만 달러에서 2031년까지 4,655억 9,000만 달러에 이를 것으로 예측되며, 예측 기간(2026-2031년) CAGR은 4.42%를 나타낼 전망입니다.
본 보고서는 소재 유형별(철강, 알루미늄, 기타 합금), 제조 공정별(주조, 단조, 기계 가공, 용접·튜브 가공, 기타), 최종 사용자 산업별(제조업, 전력·유틸리티, 기타), 지역별(북미, 남미, 유럽, 아시아태평양, 중동 및 아프리카)로 분류되어 있습니다. 시장 예측은 금액(달러) 기준으로 제시되어 있습니다.
세계의 금속 가공제품 시장 동향 및 인사이트
건설 부문의 구조용 자재 수요 급증
정밀 가공된 구조용 강재, 건축용 금속 제품 및 모듈식 건축자재 덕분에 건설 부문은 계속해서 금속 가공제품 시장에서 가장 큰 판매 채널로 자리 잡고 있습니다. 미국, 인도, 인도네시아의 인프라 구축 추진은 동남아시아의 도시화와 맞물려 보, 트러스 및 냉간 성형 단면의 수주 잔고를 끌어올리고 있습니다. 건설업체들은 프로젝트 주기를 단축하고 있으며, 볼트로 조립하기만 하면 되는 프리팹 부품에 대한 의존도가 높아지고 있습니다. 이로 인해 제조의 복잡성과 이익률이 상승하고 있습니다. 엄격한 내진 기준 및 에너지 효율 기준으로 인해 더 까다로운 공차와 인증된 용접 절차가 의무화되고 있으며, 이는 비파괴 검사를 통해 품질을 검증할 수 있는 기술적으로 진보된 공장에 강점이 됩니다. 건설 지출에는 주기적인 변동이 나타나지만, 주택 및 교통 인프라의 갱신을 요구하는 인구 통계학적 압력이 간헐적인 둔화를 상쇄하며 수년에 걸친 지속적인 수요를 뒷받침하고 있습니다.
금속 가공 부품이 필요한 재생에너지 설비의 설치 확대
풍력, 태양광 및 송전망 강화 프로젝트로 인해 정밀한 타워 부재, 랙 시스템 및 구리를 많이 사용하는 전기 기기에 대한 수요가 가속화되고 있습니다. 국제에너지기구(IEA)는 2025년에 전 세계 신규 재생에너지 설비 용량의 60% 이상을 태양광 발전이 차지할 것으로 예측하고 있으며, 태양광 발전 설비 1메가와트당 약 5.5톤의 구리 도체가 사용됩니다. 중국 국가전망이 2025년에 실시할 175만 7,000톤 규모의 강철 격자 타워 입찰은 전년의 46만 톤을 훨씬 상회하며, 이는 대구경 보 및 앵글재 제조 공장에 지속적인 수주량으로 이어질 것입니다. 해상 풍력 발전소 건설에는 극한의 동적 하중을 견뎌야 하는 XL 모노파일 및 나셀 하우징이 필수적이며, 멀티패스 수중 아크 용접에 숙련된 제조업체에게 큰 비즈니스 기회가 되고 있습니다. 또한, 배터리 에너지 저장 시설의 건설로 그 범위가 더욱 확대되면서, 알루미늄 판이나 스테인리스 스틸 구조 부재를 사용한 열 관리 기능이 탑재된 케이스에 대한 수요가 증가하고 있습니다.
철강·알루미늄 가격 변동
열간 압연 코일 가격은 2024년 말까지 톤당 700달러 대를 유지했습니다. 이는 중국의 경기 부양책에 힘입은 것이었지만, 유럽과 미국 수요 부진과 서비스 센터의 과잉 재고로 인해 상승폭이 제한되었습니다. 14개 관할 구역에서 생산된 알루미늄 압출재에 대한 미국의 반덤핑 관세로 인해 40만 톤의 수입이 차단되면서 국내 가격 변동이 심화되었고, 수주 가공업체의 이익률이 압박을 받았습니다. 대형 가공업체들은 선물 헤지나 원가 가산 계약을 활용하여 가격 변동의 충격을 완화하고 있지만, 중소기업들은 추가 비용 전가에 어려움을 겪고 있어 장기 발주 수락을 미루고 있습니다. 예산 초과를 우려하는 프로젝트 발주자는 철강을 많이 사용하는 건설 공사를 연기하기도 하여, 그 결과 금속 가공제품 시장 전체에서 가동률에 편차가 발생하고 있습니다. 디지털 조달 플랫폼이나 투명성이 높은 지수 연동 메커니즘은 투입 비용의 불확실성을 해소해 주지는 않지만, 그 영향을 완화해 주며, 가격의 급등락은 여전히 지속적인 제약 요인으로 작용하고 있습니다.
부문 분석
2025년, 철강은 금속 가공제품 시장 점유율의 62.60%를 차지했으며, 이는 자동차용 프레임, I형 강재, 중장비용 하우징에서 낮은 비용 대비 강도 비율에 힘입은 것입니다. 그러나 알루미늄 매출은 연평균 성장률(CAGR) 5.66%로 증가하고 있으며, 이 경량 금속은 예측 기간 동안 금속 가공제품 시장 규모 확대에 가장 빠르게 기여할 요인이 될 것으로 보입니다. 수요의 원천은 전기차 섀시, 항공우주용 동체 패널, 태양광 발전용 랙 등에 있으며, 경량화는 연비 향상과 현장 설치 용이성으로 이어지고 있습니다. 플라즈마식 분말 분무 기술로 티타늄의 투입 비용이 낮아지면서 터빈이나 의료용 임플란트와 같은 틈새 시장이 개척된 반면, 고전류 재생 에너지용 회로의 보급에 따라 구리 수요량은 급증하고 있습니다. 환경 스코어카드를 통해 구매자들은 재활용률 95%, 탄소 발자국이 1kg당 1.52kg CO2e인 스테인리스 합금으로 유도되고 있으며, 재료 선택과 스코프 3 배출 감축 공약 간의 연계가 더욱 강화되고 있습니다.
다운스트림 공정에서는 합금 대체 전략이 상품 가격의 급등락과 내진 기준 개정에 대응하고 있습니다. 철강 제조업체들은 스크랩 재활용 순환을 확대하기 위해 전기 아크로 생산 능력을 증강하고 있는 한편, 압출 성형 제조업체들은 내식성이 뛰어난 6000계 프로파일을 통해 태양광 발전 OEM 제조업체 확보에 주력하고 있습니다. 원가 계산과는 별개로, 티타늄의 생체 적합성과 높은 비강도는 높은 수익률을 가져다주는 정형외과용 임플란트 및 우주 규격 적합 용도로의 문을 열어주고 있습니다. 구리의 뛰어난 전도성은 가격 급등에도 불구하고 전기차(EV)의 버스바 및 인버터 방열판에 있어 여전히 필수적인 요소로 남아 있으며, 가공 업체들은 네스팅 알고리즘 및 재용해 파트너십을 통해 수율 최적화를 도모하고 있습니다. 디지털 트윈에 통합된 수명 주기 평가(LCA) 도구를 통해 엔지니어는 견적 단계에서 탄소 강도를 시뮬레이션할 수 있으며, 이를 통해 금속 가공제품 시장은 지속가능성 준수를 판매의 레버리지로 전환할 수 있게 되었습니다.
지역별 분석
2025년 금속 가공제품 시장에서 아시아태평양이 차지한 48.35%의 점유율은 이 지역이 제조 대국인 동시에 인프라 건설의 거점이라는 역할과 일치합니다. 중국의 175만 7,000톤 규모 초고압(UHV) 송전탑 입찰이 제철소의 생산을 뒷받침하는 한편, 인도의 ‘스마트 시티 미션’은 다중 모드 터미널, 지하철, 고가도로 건설에 자금을 지원하고 있으며, 이는 대량의 압연 및 용접 형강을 필요로 합니다. 베트남 등 동남아시아 국가들은 국내로 회귀한 전자기기 조립 수주를 확보하며, 정밀 판금 섀시, 서버 랙, 방열판에 대한 수요를 촉진하고 있습니다. 일본과 한국은 시장이 성숙기에 접어들었음에도 불구하고, 가공, 연삭, 계측을 한 지붕 아래 통합한 린(Lean) 생산 시스템을 활용하여 고정밀 반도체 장비 프레임 및 로봇용 하위 어셈블리의 수출을 뒷받침하고 있습니다. 아시아 지역 내 무역 회랑을 통해 운송 루프가 단축되어, 코일이나 봉강을 제철소에서 지역 가공업체로 직접 납품할 수 있게 되었으며, 이로 인해 금속 가공제품 시장의 경쟁력이 강화되고 있습니다.
북미의 전망은 청정 에너지, 첨단 반도체, 교통 회랑에 투입된 2조 달러가 넘는 연방 정부의 경기 부양책에 힘입어 밝습니다. 2024년 5월 미국의 제조업 건설 공사는 연율 환산으로 2,340억 달러에 달했고, 2019년 대비 217% 급증했으며, 이는 메자닌, HVAC 플레넘, 구조용 프레임 분야에서 수년에 걸친 수주 잔고가 발생하고 있음을 나타냅니다. 캐나다의 ‘중요 광물 전략’에 따라 배터리 재료 가공 공장에 자본이 투입되면서, 스테인리스 스틸 반응기 및 합금강 이송 시스템의 수주가 급증하고 있습니다. 멕시코는 백색 가전 조립 및 2차 자동차 하위 조립품의 니어쇼어링 혜택을 받고 있으며, 튜브 레이저 가공 라인 및 로봇 MIG 용접 셀에 대한 투자가 촉진되고 있습니다. 국경을 초월한 밸류체인은 USMCA의 관세 면제 규정을 활용하면서도 지리적 근접성을 유지함으로써, 가공된 하위 부품의 물류 위험을 최소화하고 있습니다. 유럽은 에너지 가격 변동에 어려움을 겪고 있지만, 해상 풍력 발전용 모노파일, 수소 전기분해 장치, 의료기기 케이스 등 고부가가치의 틈새 시장을 통해 이를 보완하고 있습니다. 독일의 중견 기업(미텔슈탄트)은 박판 스테인리스 성형에 뛰어나며, 한편 이탈리아는 고급 자동차용 맞춤형 기계 가공으로 사업 중심을 옮기고 있습니다. EU의 탄소 국경 조정 메커니즘은 전기 아크로를 채택하고 고철 사용률이 높은 제철소를 우대하고 있어, 저탄소강 조달 동향에 영향을 미치고 있습니다. 북유럽 생산자들은 수력발전을 활용하여 해상 태양광 발전소 구조물용으로 보다 친환경적인 알루미늄 빌렛을 제련하고 있습니다. 중동 및 아프리카에서는 리야드 메트로와 이집트의 신행정수도 등 유틸리티 메가 프로젝트가 진행 중이며, 교량용 거더와 건축용 파사드에 대한 수요가 증가하고 있습니다. 남미에서는 광산용 컨베이어 교체 및 부유식 LNG 허브 건설로 인해 거시경제의 변동에도 불구하고 두꺼운 강판 및 강관 제품에 대한 수요가 유지되고 있어, 금속 가공제품 시장의 지리적 확장을 여실히 보여주고 있습니다.
기타 혜택 :
- 엑셀 형식 시장 예측(ME) 시트
- 3개월간 애널리스트 지원
자주 묻는 질문
목차
제1장 서론
제2장 조사 방법
제3장 개요
제4장 시장 구도
제5장 시장 규모 및 성장 예측
제6장 경쟁 구도
제7장 시장 기회 및 향후 전망
AJY 26.09.01According to Mordor Intelligence, the fabricated metal products market size was valued at USD 359.05 billion in 2025 and estimated to grow from USD 374.92 billion in 2026 to reach USD 465.59 billion by 2031, at a CAGR of 4.42% during the forecast period (2026-2031).
This report is Segmented by Material Type (Steel, Aluminum, Other Alloys), by Fabrication Process (Casting, Forging, Machining, Welding & Tubing, Others), by End-User Industry (Manufacturing, Power & Utilities, and More), and by Geography (North America, South America, Europe, Asia-Pacific, Middle East and Africa). The Market Forecasts are Provided in Terms of Value (USD).
Global Fabricated Metal Products Market Trends and Insights
Surge in Demand from the Construction Sector for Structural Components
Precision-engineered structural steel, architectural metalwork, and modular building elements keep the construction sector the single largest off-take channel for the fabricated metal products market. Infrastructure stimulus in the United States, India, and Indonesia is synchronizing with urbanization in Southeast Asia, lifting order backlogs for beams, trusses, and cold-formed sections. Contractors are shortening project cycles, prompting higher reliance on prefabricated assemblies that arrive ready for bolt-up, thereby raising fabrication complexity and margins. Strict seismic and energy-efficiency codes mandate tighter tolerances and certified weld procedures, which play to the strengths of technologically sophisticated shops able to validate quality with non-destructive testing. Although construction spending can be cyclical, demographic pressures for housing and transport renewal underpin a multi-year demand runway that offsets intermittent slowdowns.
Growth in Renewable-Energy Installations Requiring Fabricated Metal Parts
Wind, solar, and grid-reinforcement projects accelerate the need for precision tower sections, racking systems, and copper-intensive electrical hardware. The International Energy Agency expects solar additions to top 60% of new global renewable capacity in 2025, and each megawatt of photovoltaic capacity anchors roughly 5.5 tons of copper conductors. China's State Grid tender for 1.757 million tons of steel lattice towers in 2025 dwarfs the previous year's 460,000 tons, translating into continuous throughput for heavy-section beam and angle-line fabrication shops. Offshore wind construction depends on XL monopiles and nacelle housings that must absorb extreme dynamic loads, rewarding fabricators proficient at multi-pass submerged-arc welding. Battery-energy-storage sites further widen the scope, calling for thermally managed enclosures built from aluminum sheet and stainless structural members.
Volatility in Steel & Aluminum Prices
Hot-rolled coil hovered in the USD 700s per ton through late 2024, propped up by Chinese stimulus yet capped by slack Western demand and bloated service-center inventories. The U.S. antidumping duty on aluminum extrusions from 14 jurisdictions removed 400,000 tons of imports, amplifying domestic price swings and squeezing job-shop margins. While larger fabricators employ futures hedges or cost-plus contracts to mute volatility, small and medium enterprises struggle to pass surcharges through, delaying acceptance of long-term purchase orders. Project owners, wary of budget overruns, sometimes postpone steel-intensive builds, producing uneven utilization rates across the fabricated metal products market. Digital procurement platforms and transparent indexation mechanisms ease, not erase, input uncertainty, leaving price gyrations as a persistent constraint.
Other drivers and restraints analyzed in the detailed report include:
- Resurgence of Manufacturing Activity & Reshoring Initiatives
- Technological Advances in CNC & Additive Manufacturing
- Skilled-Welder Shortage Amid Retirement Cliff
For complete list of drivers and restraints, kindly check the Table Of Contents.
Segment Analysis
Steel held 62.60% of the fabricated metal products market share in 2025, underpinned by its low cost-to-strength ratio for automotive frames, I-beams, and heavy machinery housings. Yet aluminum revenues are climbing at a 5.66% CAGR, positioning the lighter metal as the quickest-expanding contributor to the fabricated metal products market size over the outlook. Demand stems from electric-vehicle chassis, aerospace fuselage panels, and photovoltaic racking, where weight savings translate into fuel economy or easier field installation. Plasma-based powder atomization lowered titanium input prices, opening turbine and medical-implant niches, while copper volumes surge alongside high-ampere renewable circuits. Environmental scorecards guide buyers toward stainless alloys boasting 95% recycled content and 1.52 kg CO2e per kg footprints, tightening the link between material choice and Scope-3 pledges.
Downstream, alloy substitution strategies respond to commodity price gyrations and seismic code revisions. Steel producers ramp electric-arc-furnace capacity to widen scrap recycling loops, whereas extruders court solar OEMs with corrosion-resistant 6000-series profiles. Separate from cost calculus, titanium's biocompatibility and high specific strength unlock orthopedic implant and space-qualified applications that command premium margins. Copper's conductive superiority keeps it indispensable for EV busbars and inverter heat-sinks despite price spikes, pushing fabricators to optimize yield through nesting algorithms and remelt partnerships. Life-cycle assessment tools embedded in digital twins let engineers simulate carbon intensity at the quotation stage, helping the fabricated metal products market transform sustainability compliance into a sales lever.
Complete Report Scope:
- By Material Type
- Steel
- Aluminum
- Other Alloys (Titanium, Copper, etc.)
- By Fabrication Process
- Casting
- Forging
- Machining
- Welding & Tubing
- Others (Stamping, Additive Manufacturing)
- By End-user Industry
- Manufacturing
- Power & Utilities
- Construction & Infrastructure
- Oil & Gas
- Automotive
- Aerospace & Defense
- Other Industries
- By Geography
- North America
- United States
- Canada
- Mexico
- South America
- Brazil
- Argentina
- Peru
- Rest of South America
- Europe
- United Kingdom
- Germany
- France
- Italy
- Spain
- BENELUX (Belgium, Netherlands, and Luxembourg)
- NORDICS (Denmark, Finland, Iceland, Norway, and Sweden)
- Rest of Europe
- Asia-Pacific
- China
- India
- Japan
- Australia
- South Korea
- ASEAN (Indonesia, Thailand, Philippines, Malaysia, Vietnam)
- Rest of Asia-Pacific
- Middle East and Africa
- Saudi Arabia
- United Arab Emirates
- Qatar
- Kuwait
- Turkey
- Egypt
- South Africa
- Nigeria
- Rest of Middle East and Africa
- North America
Geography Analysis
Asia-Pacific's 48.35% stake in the fabricated metal products market share during 2025 aligns with its role as both a manufacturing powerhouse and an infrastructure build-site. China's 1.757 million tons UHV tower tender anchors mill output, while India's Smart Cities Mission funds multi-modal terminals, metro rails, and flyovers that demand high tonnage of rolled and welded sections. Southeast Asian countries like Vietnam capture re-shored electronics assemblies, catalyzing demand for precision sheet-metal chassis, server racks, and heat-sinks. Japan and South Korea, though mature, feed exports of high-precision semiconductor equipment frames and robotic sub-assemblies, capitalizing on lean production systems that blend machining, grinding, and metrology under one roof. Intra-Asia trade corridors shorten transit loops, allowing mill-direct deliveries of coil and bar to regional fabricators, fortifying competitiveness within the fabricated metal products market.
North America's outlook is reinforced by more than USD 2 trillion federal stimulus earmarked for clean energy, advanced chips, and transport corridors. U.S. manufacturing construction hit USD 234 billion annualized in May 2024, a 217% surge versus 2019, indicating multi-year backlogs for mezzanines, HVAC plenums, and structural frames. Canada's Critical Minerals Strategy funnels capital into battery-materials processing plants, inflating orders for stainless reactors and alloy-steel conveyance systems. Mexico gains from near-shoring of white-goods assembly and Tier-2 automotive sub-assemblies, spurring investments in tube-laser lines and robotic MIG cells. Cross-border supply chains leverage USMCA duty-free rules while retaining geographic proximity that minimizes logistics risk for fabricated sub-components. Europe grapples with energy-price volatility yet compensates via high-value niches in offshore wind monopiles, hydrogen electrolyzers, and medical-device housings. Germany's Mittelstand excels at thin-gauge stainless forming, whereas Italy pivots toward boutique machining for luxury automotive. The EU's carbon-border adjustment mechanism privileges mills employing electric-arc furnaces and high scrap ratios, influencing procurement toward low-carbon steel. Nordic producers exploit hydropower to smelt greener aluminum billets destined for offshore solar-farm structures. Middle East and Africa ride public-works megaprojects, Riyadh Metro and Egypt's New Administrative Capital, requiring bridge girders and architectural facades. South America's mining conveyor upgrades and floating LNG hubs sustain demand for heavy-duty plate and tubular fabrications despite macro-volatility, underscoring the geographic breadth of the fabricated metal products market.
- ArcelorMittal
- Nucor Corporation
- China Steel Corporation
- Howmet Aerospace
- Parker-Hannifin Corporation
- Ametek Inc.
- Ball Corporation
- Generac Holdings Inc.
- Inner Mongolia Baotou Steel Union Co., Ltd.
- Toyota Tsusho Corporation
- Voestalpine AG
- United States Steel Corporation
- JFE Holdings Inc.
- Thyssenkrupp AG
- BlueScope Steel Ltd.
- Reliance Steel & Aluminum Co.
- O'Neal Manufacturing Services
- Mayville Engineering Company Inc.
- BTD Manufacturing
Additional Benefits:
- The market estimate (ME) sheet in Excel format
- 3 months of analyst support
TABLE OF CONTENTS
1 Introduction
- 1.1 Study Assumptions & Market Definition
- 1.2 Scope of the Study
2 Research Methodology
3 Executive Summary
4 Market Landscape
- 4.1 Market Overview
- 4.2 Market Drivers
- 4.2.1 Surge in demand from construction sector for structural components
- 4.2.2 Resurgence of manufacturing activity & reshoring initiatives
- 4.2.3 Growth in renewable-energy installations requiring fabricated metal parts
- 4.2.4 Technological advances in CNC & additive manufacturing
- 4.2.5 Adoption of digital twins enabling design-to-fab integration in SMEs
- 4.2.6 Rising use of modular prefabricated data-center skids
- 4.3 Market Restraints
- 4.3.1 Volatility in steel & aluminum prices
- 4.3.2 High CAPEX for advanced fabrication equipment
- 4.3.3 Skilled-welder shortage amid retirement cliff
- 4.3.4 Scope-3 emissions reporting pressure on fabricators
- 4.4 Value / Supply-Chain Analysis
- 4.5 Regulatory Landscape
- 4.6 Technological Outlook
- 4.7 Industry Attractiveness - Porter's Five Forces Analysis
- 4.7.1 Threat of New Entrants
- 4.7.2 Bargaining Power of Buyers
- 4.7.3 Bargaining Power of Suppliers
- 4.7.4 Threat of Substitutes
- 4.7.5 Competitive Rivalry
5 Market Size & Growth Forecasts (Value, In USD Billion)
- 5.1 By Material Type
- 5.1.1 Steel
- 5.1.2 Aluminum
- 5.1.3 Other Alloys (Titanium, Copper, etc.)
- 5.2 By Fabrication Process
- 5.2.1 Casting
- 5.2.2 Forging
- 5.2.3 Machining
- 5.2.4 Welding & Tubing
- 5.2.5 Others (Stamping, Additive Manufacturing)
- 5.3 By End-user Industry
- 5.3.1 Manufacturing
- 5.3.2 Power & Utilities
- 5.3.3 Construction & Infrastructure
- 5.3.4 Oil & Gas
- 5.3.5 Automotive
- 5.3.6 Aerospace & Defense
- 5.3.7 Other Industries
- 5.4 By Geography
- 5.4.1 North America
- 5.4.1.1 United States
- 5.4.1.2 Canada
- 5.4.1.3 Mexico
- 5.4.2 South America
- 5.4.2.1 Brazil
- 5.4.2.2 Argentina
- 5.4.2.3 Peru
- 5.4.2.4 Rest of South America
- 5.4.3 Europe
- 5.4.3.1 United Kingdom
- 5.4.3.2 Germany
- 5.4.3.3 France
- 5.4.3.4 Italy
- 5.4.3.5 Spain
- 5.4.3.6 BENELUX (Belgium, Netherlands, and Luxembourg)
- 5.4.3.7 NORDICS (Denmark, Finland, Iceland, Norway, and Sweden)
- 5.4.3.8 Rest of Europe
- 5.4.4 Asia-Pacific
- 5.4.4.1 China
- 5.4.4.2 India
- 5.4.4.3 Japan
- 5.4.4.4 Australia
- 5.4.4.5 South Korea
- 5.4.4.6 ASEAN (Indonesia, Thailand, Philippines, Malaysia, Vietnam)
- 5.4.4.7 Rest of Asia-Pacific
- 5.4.5 Middle East and Africa
- 5.4.5.1 Saudi Arabia
- 5.4.5.2 United Arab Emirates
- 5.4.5.3 Qatar
- 5.4.5.4 Kuwait
- 5.4.5.5 Turkey
- 5.4.5.6 Egypt
- 5.4.5.7 South Africa
- 5.4.5.8 Nigeria
- 5.4.5.9 Rest of Middle East and Africa
- 5.4.1 North America
6 Competitive Landscape
- 6.1 Market Concentration
- 6.2 Strategic Moves
- 6.3 Market Share Analysis
- 6.4 Company Profiles (includes Global level Overview, Market level overview, Core Segments, Financials as available, Strategic Information, Products & Services, and Recent Developments)
- 6.4.1 ArcelorMittal
- 6.4.2 Nucor Corporation
- 6.4.3 China Steel Corporation
- 6.4.4 Howmet Aerospace
- 6.4.5 Parker-Hannifin Corporation
- 6.4.6 Ametek Inc.
- 6.4.7 Ball Corporation
- 6.4.8 Generac Holdings Inc.
- 6.4.9 Inner Mongolia Baotou Steel Union Co., Ltd.
- 6.4.10 Toyota Tsusho Corporation
- 6.4.11 Voestalpine AG
- 6.4.12 United States Steel Corporation
- 6.4.13 JFE Holdings Inc.
- 6.4.14 Thyssenkrupp AG
- 6.4.15 BlueScope Steel Ltd.
- 6.4.16 Reliance Steel & Aluminum Co.
- 6.4.17 O'Neal Manufacturing Services
- 6.4.18 Mayville Engineering Company Inc.
- 6.4.19 BTD Manufacturing
7 Market Opportunities & Future Outlook
- 7.1 White-space & Unmet-Need Assessment


