|
시장보고서
상품코드
2117403
차량 배출가스 기준 및 영향 분석 : 시장 점유율 분석, 업계 동향 및 통계, 성장 예측(2026-2031년)Vehicle Emission Standards and Impact Analysis - Market Share Analysis, Industry Trends & Statistics, Growth Forecasts (2026 - 2031) |
||||||
 Mordor Intelligence
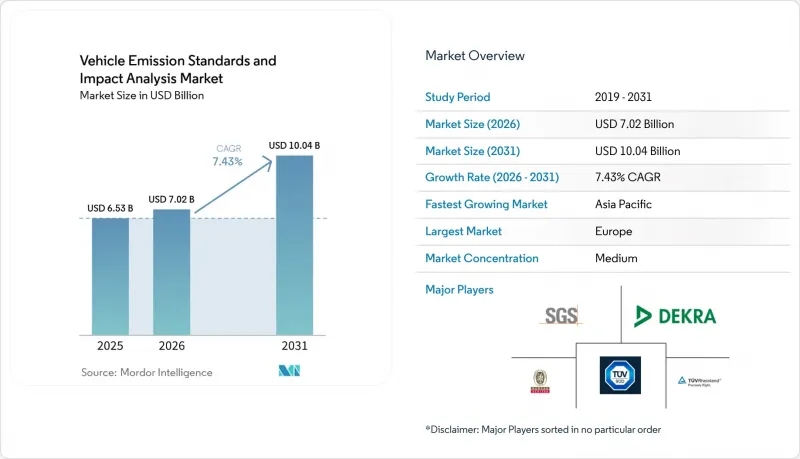
Mordor Intelligence에 의하면, 차량 배출가스 기준 및 영향 분석 시장 규모는 2025년에 65억 3,000만 달러로 평가되었습니다. 2026년에는 70억 2,000만 달러로 추정되며, 2031년까지 100억 4,000만 달러에 이를 것으로 예측됩니다.
2026년부터 2031년까지 연평균 성장률(CAGR) 7.43%로 성장할 것으로 전망됩니다.
본 보고서는 차종(이륜차, 삼륜차, 승용차, 상용차),구동 방식(내연기관(ICE) 등), 배기가스 유형(CO2, NOx, PM 등), 최종 사용자(정부 규제 기관, OEM 등), 지역(북미, 남미, 유럽 등)별로 세분화되어 있습니다. 시장 예측은 금액(달러) 기준으로 제시되어 있습니다.
세계의 차량 배출가스 기준 및 영향 분석 : 시장 동향 및 인사이트
전 세계 배기가스 기준의 강화가 시장 변화를 주도
유로 7은 유로 6의 배기관 배출 기준을 유지하면서, 미세 입자에 대한 입자 수 측정, 제동 시 입자 배출 상한선, 그리고 타이어 마모에 관한 기준치와 같은 새로운 조치를 도입하고 있습니다. 이러한 조치는 우선 신차에 적용되며, 이후 모든 신규 등록 차량에 순차적으로 적용될 예정입니다. 중국의 ‘국가 VII’ 초안에서는 질소산화물 배출 제한이 강화되고, 암모니아 배출량 상한선이 설정되었습니다. 최종안은 조만간 발표될 전망이며, 단계적인 시행이 예정되어 있습니다. 캘리포니아주의 저NOx 규제는 당초 대형 엔진의 배출 기준을 강화한 뒤, 이후 더욱 엄격한 기준이 도입될 예정입니다. 이 조치로 인해 주 전체의 NOx 배출량이 대폭 감소할 것으로 예측됩니다. 각 제조업체는 WLTP, FTP-75, CLTC와 같은 서로 다른 시험 주기에 대응해야 하므로, 검증 작업의 중복이라는 과제에 직면해 있습니다. 이로 인해 시험 비용이 증가할 뿐만 아니라, 차량 배출가스 기준 및 영향 분석 시장도 확대될 것입니다.
EV 및 HEV 생산 급증으로 시험 프로토콜 재구축
배터리식 전기차(BEV) 모델은 차량 총중량이 무거워 내연기관 차량에 비해 타이어에서 배출되는 입자상 물질량이 많기 때문에 새로운 비배기계 측정 지표 도입이 추진되고 있습니다. 회생 제동 시스템이라 하더라도 제동 미립자 물질 검사를 의무화하는 ‘유로 7’ 규제를 충족하기 위해, 시험소는 현재 UN GTR 22 규격에 부합하는 PN10 카운터와 제동 동력계를 도입하고 있습니다. 하이브리드 차량은 더욱 복잡성을 가중시킵니다. 동력 분할 주행, 콜드 스타트 시의 배출 피크, 배터리 충전 상태의 변동 등으로 인해 듀얼 사이클 평가가 필요하며, 시험 시간이 2배로 늘어나는 경우도 드물지 않습니다. 업계가 BEV 및 HEV 프로토콜로 전환되고 있음을 감안하여, AVL사는 수익의 일부를 전동화 시험대 확충에 투자했습니다.
막대한 설비 투자가 필요하기 때문에 시장 진입이 제한되고 있습니다.
단일 입자 수 측정용 PEMS 키트도 고가이지만, 사륜구동용 기후 조건 대응 섀시 동력계(chassis dynamometer)의 비용은 훨씬 더 비쌉니다. 이러한 막대한 지출은 특히 생산 대수가 적은 지역에서 투자 회수 기간을 길게 만듭니다. 이러한 재정적 부담은 이러한 첨단 시험 시스템에 정기적인 유지보수 및 교정이 필요하다는 점으로 인해 더욱 심각해지고 있으며, 운영 비용 증가로 이어지고 있습니다. DEKRA는 설비 투자를 위해 막대한 자금을 확보하고 있지만, 이와 같은 재정적 뒷받침이 없는 수많은 지역 연구소는 지역적 처리 능력의 한계에 시달리고 있어, 배출가스 시험 서비스에 대한 증가하는 수요에 대응하는 능력이 저해되고 있습니다.
부문별 분석
2025년에는 승용차가 차량 배출가스 기준 및 영향 분석 시장의 57.42%를 차지했으나, 인도와 동남아시아에서 오토릭샤 차량군의 전동화가 진행됨에 따라 삼륜차가 7.97%라는 가장 높은 연평균 성장률(CAGR)을 나타낼 전망입니다. 인도의 전기 삼륜차 등록 대수는 중요한 전환점을 넘어섰으며, 이에 따라 감시가 강화되고 새로운 배터리 안전성 시험 및 회생 제동 시험 도입이 진행되고 있습니다. 한편, 유로 7 타이어 규제는 SUV에 과제를 안겨주며, 이 주요 차종 카테고리에서 비배기계 컴플라이언스 비용을 상승시키고 있습니다. 승용차, 상용차, 이륜차 및 삼륜차 각 부문에 걸쳐 있는 시험소는 처리량 변동에 적절히 대응하기 위해 전략적으로 사업 다각화를 추진하고 있습니다.
규제 동향이 성장 궤도를 결정하고 있습니다. 태국과 인도네시아가 유로 4에 상응하는 기준에 가까워짐에 따라, 이들 국가는 삼륜차 OEM 각사를 ARAI나 ICAT과 같은 인증을 받은 시험 기관으로 유도하고 있습니다. 상용 트럭은 더욱 엄격한 배기가스 기준에 대비하고 있어, 대형 PEMS에 대한 견조한 수요가 두드러지고 있습니다. 한편, 배터리식 스쿠터가 배기관 시험을 회피함에 따라 이륜차의 대수는 감소 추세를 보이고 있지만, 기존의 가솔린 차량에 대해서는 도심 진입을 위해 여전히 정기적인 검사가 요구되고 있습니다. 이처럼 차종의 다양화가 진행되는 역동적인 상황 속에서 차량 배출가스 기준 및 영향 분석 시장은 확립된 승용차 부문의 수익과 급성장하는 틈새 시장 간의 균형을 맞추고 있습니다.
배터리 전기차(BEV) 플랫폼은 연평균 성장률(CAGR) 8.48%를 기록하며 추진 방식 중 가장 높은 성장률을 보이고 있지만, 2025년에도 내연기관은 매출 점유율의 73.47%를 유지했습니다. 유로 7에서는 브레이크 먼지에 대한 엄격한 제한치가 설정되어 있습니다. 그 결과, 전기식 회생 제동 시스템에서는 사용 빈도가 낮은 브레이크 패드의 마모를 모방하기 위해 맞춤형 알고리즘이 채택되기 시작했습니다. 또한, 전기차의 차량 총중량이 증가함에 따라 타이어에서 배출되는 미세 입자량도 증가하고 있습니다. 이에 대응하기 위해 시험소에서는 초미세 입자를 검출할 수 있는 중량 분석 장비에 대한 투자를 추진하고 있습니다.
하이브리드 차량 시험은 가장 비용이 많이 드는 작업입니다. 통일된 시험 주기가 없기 때문에 각 OEM 업체는 내연 모드와 전기 모드 모두에서 하이브리드 차량을 평가할 수밖에 없습니다. 이러한 이중 시험은 시험대의 가동률을 2배로 높일 뿐만 아니라, 특히 차량 배출가스 기준 및 영향 분석 분야에서 추진계 시험 시장 규모를 확대시키고 있습니다. 내연기관의 검증 기술은 성숙 단계에 이르렀지만, 여전히 수익성이 높은 분야입니다. 이는 주로 입자 수 측정 및 암모니아 슬립 검사를 중시하는 EU 및 중국의 규제에 기인합니다. 기존 시험대를 고부가가치 BEV/HEV 패키지로 상쇄하는 방식으로 운영하는 시험소는 자산 활용도를 최적화하고 있습니다.
지역별 분석
유럽의 34.28% 점유율은 유로 7 규제와 320개가 넘는 저배출 구역의 존재에 기인합니다. 런던의 네트워크만 해도 1,500 km²를 커버하고 있으며, 노후화된 차량 군에 대한 정기적인 재인증이 필요합니다. 독일, 영국, 프랑스, 이탈리아, 스페인, 네덜란드의 투자 클러스터에서는 PN10 카운터와 배터리 챔버의 규모가 확대되고 있는 반면, 동유럽에서는 서비스가 수입되고 있어 대기 시간이 길어지고 있지만, 서유럽 허브의 가동률은 향상되고 있습니다.
아시아태평양은 중국의 ‘국가 VII’ 초안과 인도의 ‘바랏 스테이지 VI 2단계’ 규제 덕분에 연평균 성장률(CAGR) 9.28%로 성장을 주도하고 있습니다. 중국 자동차 기술 연구센터는 암모니아 누출 및 10나노미터 입자 수를 모니터링하기 위해 시설 업그레이드를 진행하고 있습니다. 인도에서는 특히 전동 삼륜차를 대상으로 배터리 안전 시험 시설이 확충되고 있습니다. 한편, 일본의 JARI는 수소 연료전지 사이클 분야에서 선도적인 역할을 수행하고 있습니다. 인도네시아와 한국을 비롯한 아시아태평양 국가들은 PEMS 보급률에서 뒤처져 있습니다. 이러한 격차로 인해 국경을 초월한 아웃소싱이 진행되고 있으며, 비용은 상승하는 반면 지역별 차량 배출가스 기준 및 영향 분석의 확산을 가속화하고 있습니다.
북미에서는 차세대 장비 승인에 있어 CARB의 저NOx 기준 및 미국 EPA에 대한 의존도가 높아지고 있습니다. 호리바의 IRLAM(TM)은 인증을 획득했으며, 대형 차량용 수주를 통해 그 입지를 공고히 하고 있습니다. DEKRA는 미시간주에 시험소를 개설하고 디트로이트의 OEM 클러스터를 목표로 삼고 있습니다. 남미에서는 유로 6과 유사한 Proconve L7 기준으로의 전환이 검토되고 있습니다. 한편, 중동에서는 특히 걸프 국가들이 유로 규격에 부합하는 차량을 수입하고 있어, 인증 획득을 위해 튀르키예에 주목하고 있습니다. 아프리카에서는 수요가 싹트고 있지만, 규제의 일관성이 더 광범위하게 적용되기 전까지는 여전히 성장이 더딘 상황입니다.
기타 혜택 :
- 엑셀 형식 시장 예측(ME) 시트
- 3개월간의 애널리스트 지원
자주 묻는 질문
목차
제1장 서론
제2장 조사 방법
제3장 개요
제4장 시장 구도
제5장 시장 규모 및 성장 예측
제6장 경쟁 구도
제7장 시장 기회 및 향후 전망
KTH 26.09.02According to Mordor Intelligence, the vehicle emission standards and impact analysis market size was valued at USD 6.53 billion in 2025, is estimated at USD 7.02 billion in 2026, and is projected to reach USD 10.04 billion by 2031, growing at a CAGR of 7.43% from 2026 to 2031.
This report is Segmented by Vehicle Type (Two-Wheeler, Three-Wheeler, Passenger Cars, and Commercial Vehicles), Propulsion Type (ICE and More), Emission Type (CO2, NOx, PM, and More), End-Users (Government Regulating Agencies, Oems, and More), and Geography (North America, South America, Europe, and More). The Market Forecasts are Provided in Terms of Value (USD).
Global Vehicle Emission Standards and Impact Analysis Market Trends and Insights
Stricter Global Emission Standards Drive Market Transformation
Euro 7 retains the tailpipe limits of Euro 6 but introduces new measures: a particle number measurement for smaller particles, a brake particulate ceiling, and thresholds for tire wear . These measures will take effect first for new vehicle types, followed by all new registrations. China's National VII draft lowers nitrogen oxide limits and sets caps on ammonia emissions. The final version is anticipated soon, with a phased enforcement extending over time. California's Low-NOx regulation initially tightens limits on heavy-duty engines, with even stricter standards planned later. This move is projected to significantly reduce statewide NOx emissions. Manufacturers face challenges as they navigate divergent cycles-WLTP, FTP-75, and CLTC-which lead to duplicate validations. This not only inflates testing expenses but also bolsters the Vehicle Emission Standards and Impact Analysis market.
Surge in EV and HEV Production Reshapes Testing Protocols
Battery-electric models, due to their heavier curb mass, produce higher tire particulate emissions than their internal-combustion counterparts, prompting the introduction of new non-exhaust metrics. In response to Euro 7 regulations, which mandate brake particulate checks even for regenerative systems, laboratories are now incorporating PN10 counters and brake dynamometers in accordance with UN GTR 22 standards. Hybrids introduce complexities: their power-split operation, cold-start spikes, and fluctuations in battery state of charge necessitate a dual-cycle evaluation, often doubling test hours. Highlighting the industry's shift towards BEV and HEV protocols, AVL allocated a portion of its revenue to expand its electrification benches.
High Capital Investment Requirements Limit Market Entry
Though a single particle-number PEMS kit commands a hefty price, the cost of a 4-wheel-drive climate chassis dynamometer is even steeper. Such a considerable outlay extends the payback period, particularly in areas with lower volumes. This financial burden is further exacerbated by the need for regular maintenance and calibration of these advanced testing systems, which increases operational costs. While DEKRA has set aside considerable resources for capital ventures, numerous local labs, without similar financial backing, grapple with limitations in their regional capacity, hindering their ability to meet growing demand for emissions testing services.
Other drivers and restraints analyzed in the detailed report include:
- AI Integration Transforms Emissions Monitoring Capabilities
- Low-Emission Zones Expansion Creates Testing Demand
- Complexity of Capturing Real-World Emissions
For complete list of drivers and restraints, kindly check the Table Of Contents.
Segment Analysis
Three-wheelers will command the fastest 7.97% CAGR as India and Southeast Asia electrify auto-rickshaw fleets, even though passenger cars retained 57.42% of the Vehicle Emission Standards and Impact Analysis market in 2025. Electric three-wheeler registrations in India have surpassed a significant threshold, prompting heightened scrutiny and new battery safety and regenerative braking tests. At the same time, Euro 7's tire restrictions imposed challenges on SUVs, escalating non-exhaust compliance costs for this leading car category. Laboratories spanning the car, commercial, and two- to three-wheeler sectors have strategically diversified to better navigate volume fluctuations.
Regulatory rhythms dictate growth trajectories. As Thailand and Indonesia move closer to Euro 4-equivalent standards, they're steering three-wheeler OEMs towards accredited hubs like ARAI and ICAT. Commercial trucks are preparing for stricter emission standards, underscoring a robust demand for heavy-duty PEMS. While two-wheeler volumes wane as battery scooters sidestep tailpipe tests, traditional petrol fleets still require regular checks for urban entry. This dynamic landscape, with its vehicle-type diversification, sees the Vehicle Emission Standards and Impact Analysis market balancing established passenger car revenues with burgeoning niches.
Battery-electric platforms post an 8.48% CAGR, the fastest among propulsion lines, yet internal combustion engines maintain a 73.47% revenue share in 2025. Euro 7 sets a stringent brake dust limit. As a result, electric regenerative systems now rely on tailored algorithms to mimic the wear of low-use pads. Furthermore, the increased curb weight of electric vehicles has led to higher tire particulate levels. In response, laboratories are channeling investments into gravimetric analyzers, capable of detecting ultra-fine particles.
Evaluating hybrid stands is the priciest endeavor. Without a unified testing cycle, OEMs are compelled to assess hybrids in both combustion and electric modes. This dual testing not only doubles bench occupancy but also amplifies the market size for propulsion testing, particularly in the realm of Vehicle Emission Standards and Impact Analysis. While internal combustion validation has matured, it remains lucrative. This is largely due to EU and Chinese regulations, which emphasize particle counting and ammonia slip checks. Laboratories that cross-subsidize legacy benches with premium BEV/HEV packages optimize asset utilization.
Complete Report Scope:
- By Vehicle Type
- Two-Wheeler
- Three-Wheeler
- Passenger Cars
- Hatchbacks
- Sedans
- SUV & MUVs
- Commercial Vehicles
- Light Commercial Vehicles
- Medium & Heavy Commercial Vehicles
- Buses & Coaches
- By Propulsion Type
- Internal-Combustion Engine Vehicles
- Hybrid Electric Vehicles
- Battery Electric Vehicles
- By Emission Type
- CO2 (Carbon Dioxide)
- NOx (Nitrogen Oxides)
- PM (Particulate Matter)
- HC (Hydrocarbons)
- Others (CO, etc.)
- By End-Users
- Government Regulating Agencies
- OEMs
- Independent Testing Labs
- By Geography
- North America
- United States
- Canada
- Rest of North America
- South America
- Brazil
- Argentina
- Rest of South America
- Europe
- Germany
- United Kingdom
- Spain
- Italy
- France
- Netherlands
- Rest of Europe
- Asia-Pacific
- India
- China
- Japan
- South Korea
- Indonesia
- Rest of Asia-Pacific
- Middle East and Africa
- United Arab Emirates
- Saudi Arabia
- Turkey
- Egypt
- South Africa
- Rest of Middle East & Africa
- North America
Geography Analysis
Europe's 34.28% slice stems from Euro 7 and more than 320 low-emission zones. London's network alone covers 1,500 km2 and requires periodic recertification of aging fleets. Investment clusters in Germany, the U.K., France, Italy, Spain, and the Netherlands are scaling PN10 counters and battery chambers, while Eastern Europe imports services, extending queue times but raising utilization at Western hubs.
Asia-Pacific leads growth at 9.28% CAGR thanks to China's National VII draft and India's Bharat Stage VI Phase 2 rules. China's Automotive Technology and Research Center is upgrading its facilities to monitor ammonia slip and 10 nm particle counts. In India, battery-safety laboratories are being expanded specifically for electric three-wheelers. Meanwhile, Japan's JARI is leading the way with hydrogen fuel cell cycles. Countries like Indonesia, Korea, and others in the Asia-Pacific region are falling behind in PEMS density. This gap has led to cross-border outsourcing, which, while inflating costs, is hastening the penetration of regional Vehicle Emission Standards and Impact Analysis.
In North America, there's a heavy reliance on CARB Low-NOx and the U.S. EPA for the green light on next-generation equipment. HORIBA's IRLAM(TM) has clinched certification, solidifying its position with heavy-duty bookings. DEKRA has set its sights on Detroit's OEM clusters with a lab in Michigan. South America is eyeing a move to a Euro 6-like Proconve L7 standard. Meanwhile, the Middle East is turning to Turkey for validation, especially as Gulf states import vehicles that meet Euro specifications. In Africa, demand is budding but remains sluggish until broader regulatory alignment occurs.
- SGS SA
- Bureau Veritas
- DEKRA SE
- TUV SUD
- TUV Rheinland
- Applus+
- HORIBA Ltd.
- AVL List GmbH
- Intertek Group plc
- Opus Group AB
- MTS Systems Corp.
- Ricardo plc
- IAV GmbH
- Automotive Research Association of India (ARAI)
Additional Benefits:
- The market estimate (ME) sheet in Excel format
- 3 months of analyst support
TABLE OF CONTENTS
1 Introduction
- 1.1 Study Assumptions and Market Definition
- 1.2 Scope of the Study
2 Research Methodology
3 Executive Summary
4 Market Landscape
- 4.1 Market Overview
- 4.2 Market Drivers
- 4.2.1 Stricter global emission standards (Euro 7, China 7, CARB Low-NOx)
- 4.2.2 Surge in EV and HEV production demanding new testing protocols
- 4.2.3 Government incentives for low-emission technologies
- 4.2.4 Rising outsourcing of TIC services by OEMs
- 4.2.5 AI-driven remote sensing & real-world analytics adoption
- 4.2.6 Expansion of city-level Low-Emission Zones (LEZs)
- 4.3 Market Restraints
- 4.3.1 High capital cost of advanced testing equipment
- 4.3.2 Complexity of capturing real-world emissions (PEMS)
- 4.3.3 Fragmented data-access rules limiting independent labs
- 4.3.4 Uncertain global harmonization causing duplicate tests
- 4.4 Value / Supply-Chain Analysis
- 4.5 Regulatory Landscape
- 4.6 Technological Outlook
- 4.7 Porter's Five Forces
- 4.7.1 Threat of New Entrants
- 4.7.2 Bargaining Power of Suppliers
- 4.7.3 Bargaining Power of Buyers
- 4.7.4 Threat of Substitutes
- 4.7.5 Intensity of Competitive Rivalry
5 Market Size and Growth Forecasts (Value in USD)
- 5.1 By Vehicle Type
- 5.1.1 Two-Wheeler
- 5.1.2 Three-Wheeler
- 5.1.3 Passenger Cars
- 5.1.3.1 Hatchbacks
- 5.1.3.2 Sedans
- 5.1.3.3 SUV & MUVs
- 5.1.4 Commercial Vehicles
- 5.1.4.1 Light Commercial Vehicles
- 5.1.4.2 Medium & Heavy Commercial Vehicles
- 5.1.4.3 Buses & Coaches
- 5.2 By Propulsion Type
- 5.2.1 Internal-Combustion Engine Vehicles
- 5.2.2 Hybrid Electric Vehicles
- 5.2.3 Battery Electric Vehicles
- 5.3 By Emission Type
- 5.3.1 CO2 (Carbon Dioxide)
- 5.3.2 NOx (Nitrogen Oxides)
- 5.3.3 PM (Particulate Matter)
- 5.3.4 HC (Hydrocarbons)
- 5.3.5 Others (CO, etc.)
- 5.4 By End-Users
- 5.4.1 Government Regulating Agencies
- 5.4.2 OEMs
- 5.4.3 Independent Testing Labs
- 5.5 By Geography
- 5.5.1 North America
- 5.5.1.1 United States
- 5.5.1.2 Canada
- 5.5.1.3 Rest of North America
- 5.5.2 South America
- 5.5.2.1 Brazil
- 5.5.2.2 Argentina
- 5.5.2.3 Rest of South America
- 5.5.3 Europe
- 5.5.3.1 Germany
- 5.5.3.2 United Kingdom
- 5.5.3.3 Spain
- 5.5.3.4 Italy
- 5.5.3.5 France
- 5.5.3.6 Netherlands
- 5.5.3.7 Rest of Europe
- 5.5.4 Asia-Pacific
- 5.5.4.1 India
- 5.5.4.2 China
- 5.5.4.3 Japan
- 5.5.4.4 South Korea
- 5.5.4.5 Indonesia
- 5.5.4.6 Rest of Asia-Pacific
- 5.5.5 Middle East and Africa
- 5.5.5.1 United Arab Emirates
- 5.5.5.2 Saudi Arabia
- 5.5.5.3 Turkey
- 5.5.5.4 Egypt
- 5.5.5.5 South Africa
- 5.5.5.6 Rest of Middle East & Africa
- 5.5.1 North America
6 Competitive Landscape
- 6.1 Market Concentration
- 6.2 Strategic Moves
- 6.3 Market Share Analysis
- 6.4 Company Profiles (Includes Global level Overview, Market level overview, Core Segments, Financials as available, Strategic Information, Market Rank/Share for key companies, Products & Services, and Recent Developments)
- 6.4.1 SGS SA
- 6.4.2 Bureau Veritas
- 6.4.3 DEKRA SE
- 6.4.4 TUV SUD
- 6.4.5 TUV Rheinland
- 6.4.6 Applus+
- 6.4.7 HORIBA Ltd.
- 6.4.8 AVL List GmbH
- 6.4.9 Intertek Group plc
- 6.4.10 Opus Group AB
- 6.4.11 MTS Systems Corp.
- 6.4.12 Ricardo plc
- 6.4.13 IAV GmbH
- 6.4.14 Automotive Research Association of India (ARAI)