|
시장보고서
상품코드
2117464
연료전지 파워트레인 시장 : 점유율 분석, 업계 동향과 통계, 성장 예측(2026-2031년)Fuel Cell Powertrain - Market Share Analysis, Industry Trends & Statistics, Growth Forecasts (2026 - 2031) |
||||||
 Mordor Intelligence
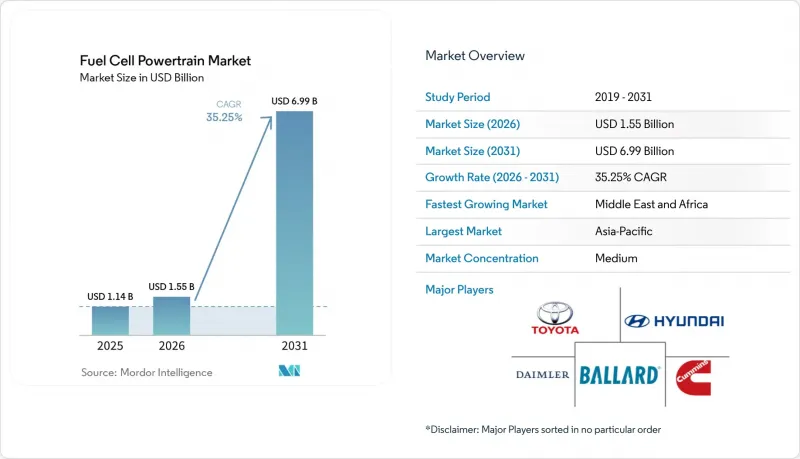
Mordor Intelligence에 의하면, 연료전지 파워트레인 시장 규모는 2025년에 11억 4,000만 달러로 평가되었고 2026년에는 15억 5,000만 달러에 이르고, 2031년까지 69억 9,000만 달러에 이를 것으로 예상되고 있어 2026년부터 2031년까지 CAGR 35.25%로 성장할 전망입니다.
본 보고서는 구성 요소 유형(연료전지 시스템, 배터리 시스템 등), 구동 방식(후륜구동(RWD), 전륜 구동(FWD) 등), 차종(승용차, 소형 상용차(LCV) 등),출력(150 kW 미만, 150-250 kW, 기타), 지역별로 분류되어 있습니다. 시장 예측은 금액(미 달러) 기준으로 제시되어 있습니다.
전 세계 연료전지 파워트레인 시장 동향 및 인사이트
제로 배출 차량의 보급을 가속화하는 정부의 배기가스 규제
캘리포니아주의 ‘Advanced Clean Cars II’ 규정은 2035년까지 경차 판매 대수를 100% 무공해 차량으로 전환하도록 규정하고 있으며,EPA의 ‘Heavy-Duty Omnibus’에서는 2027년형 트럭의 NOx 배출량이 제한되며, 중국에서는 2027년까지 구매세 면제 기간이 연장되었습니다. 이 모든 요인이 OEM의 일정을 앞당기며, 적재량이 중요한 부문에서 차량 함대를 수소 솔루션으로 이끌고 있습니다. EU의 ‘대체 연료 인프라 규정’에서는 2030년까지 TEN-T 회랑 전역에 200km마다 수소 충전소를 설치하도록 의무화하고 있어, 국경을 넘는 화물 운송 시 주행 거리에 대한 우려를 완화하고 있습니다. 2025년, 독일은 2030년까지 공공 수소 충전소를 대폭 확충하겠다는 비전을 내걸고 막대한 자금을 배정하여 국내 보급을 뒷받침했습니다. 그 결과, 연료전지 파워트레인 시장 관계자들은 중기적인 수요 동향을 형성하는 데 있어 기술적 진보보다 규제 조치의 영향이 더 크다고 인식하고 있습니다.
연료전지 스택의 내구성과 비용 면에서의 획기적인 진전
혼다는 막-전극 어셈블리의 최적화를 통해 효율을 향상시킨 차세대 모듈을 발표했습니다. 이 혁신을 통해 비용을 대폭 절감하면서도 모듈의 수명을 연장할 수 있게 되었습니다. 마찬가지로, 토요타의 3세대 스택도 소재 사용에 있어 기술적 진보를 도입함으로써 내구성 측면에서 주목할 만한 성과를 달성했습니다. 또한, 셀센트릭(Cellcentric)의 최신 모델은 출력 밀도를 향상시켜 뛰어난 내구성을 발휘하고 있습니다. 이러한 기술적 진전이 맞물리면서 디젤 차량과의 총 소유 비용(TCO) 격차가 줄어들고, 연료전지 파워트레인 시장에 대한 신뢰가 높아지고 있습니다.
BEV와의 초기 비용 차이
타타 모터스는 인도 버스 부문에서 상당한 비용 프리미엄이 존재함을 확인했으며, 수소와의 가격 평형을 달성하기 위해서는 수년의 운영 기간이 필요할 것으로 추정하고 있습니다. 한편, 아르곤 국립연구소는 대규모 생산량에 따른 일정 수준의 비용 절감이 달성되어야만 구매 가격의 패리티가 가능해질 것이라고 시사하고 있습니다. 그 결과, 차량 관리 책임자들은 배터리 탑재로 인한 추가 비용이 비용 프리미엄을 상회하는 노선으로만 수소 사용을 제한하고 있습니다.
부문 분석
700바의 유형 IV 탱크가 중량 대비 6.8%의 용량을 달성하고 적재 용량이 확대됨에 따라, 수소 저장 시스템은 연평균 성장률(CAGR) 35.88%로 성장하여 연료전지 파워트레인 시장 전체의 성장률을 상회할 전망입니다. 스택이 여전히 가치의 기반을 이루고 있기 때문에 2025년 매출의 48.17%는 연료전지 시스템이 차지할 것으로 예상되지만, Cellcentric사의 모듈식 설계로 인해 제조 복잡성이 40% 감소하여 조만간 상품화가 진행될 것으로 시사되고 있습니다.
NPROXX사의 컨포머블 탱크는 휠베이스를 연장하지 않고도 이용 가능한 수소량을 18% 증가시켰으며, Bosch사의 실리콘 카바이드 인버터는 스위칭 손실을 30% 줄여, 연료전지 파워트레인 시장 내 서브시스템의 혁신이 결실을 맺고 있음을 보여줍니다. 커민스(Cummins)사의 전해조와 스택에 걸친 수직 통합은 OEM의 조달을 효율화하고 보증 대응을 신속하게 하는 턴키 패키지의 등장을 예고합니다.
2025년에는 단축 레이아웃이 도시 내 운송 및 지역 간 운송의 듀티 사이클을 최저 비용으로 충족함에 따라, 후륜구동이 54.22%의 점유율을 차지하며 주류가 되었습니다. 2031년까지 사륜구동은 연평균 성장률(CAGR) 36.01%로 성장할 것입니다. 이는 쓰레기 수거차, 광산 차량, 군용 차량이 험준한 지형에 대응하기 위해 토크 벡터링이 필요하기 때문이며, 이로 인해 연료전지 파워트레인의 잠재 시장이 확대되고 있습니다.
다임러의 액체 수소 트랙터의 경우, 얼어붙은 오르막길에서 견인력을 확보하기 위해 탠덤 액슬 방식의 6X4 구성에 대한 시험이 진행되고 있습니다. 한편, 볼보는 차량이 움직이지 못해 발생하는 가동 중단 시간을 고려할 때, 모터를 추가하는 투자가 정당화된다고 판단했습니다. 장거리 운송 차량군에서는 후륜구동 구성이 주류를 이루겠지만, 2031년까지는 사륜구동 구성이 시장에서 상당한 점유율을 차지할 가능성이 있습니다. 이러한 변화는 연료전지 파워트레인 시장이, 기존에는 디젤 엔진을 탑재한 4X4 및 6X6 섀시 영역이었던 운영 주기에 대응하기 시작했기 때문입니다.
지역별 분석
2025년, 아시아태평양은 전 세계 매출의 40.12%를 차지했습니다. 이는 중국과 일본 등 국가들의 정부 보조금에 힘입은 결과로, 이러한 보조금은 연료전지 트럭 및 승용차의 도입을 지원했습니다. 이러한 지원 덕분에 연료전지 파워트레인 시장에서 아시아태평양의 우위가 확고해졌습니다. 현대는 2030년까지 상용 연료전지 전기차(FCEV)의 연간 판매 대수에 대해 야심 찬 목표를 세웠습니다. 동시에 인도는 막대한 미션 기금을 투입해 전해조의 현지 생산을 뒷받침하고 있으며, 여러 국가에 의한 협력적인 노력이 두드러지고 있습니다. 중국에서는 실증 클러스터가 운영 보조금을 통해 초기 도입 차량군을 장려하고 있어, 연료전지 파워트레인 시장에서 중국의 주도적 지위를 공고히 하고 있습니다.
한편, 중동 및 아프리카는 산유국들이 그린 수소로 중심을 옮기면서 36.41%라는 견실한 연평균 성장률(CAGR)을 기록하며 가장 빠르게 성장하는 지역으로 부상하고 있습니다. NEOM의 전해조 프로젝트는 2026년까지 상당한 생산량을 달성할 전망이며, 내부 건설용 차량 및 수출 수요를 모두 충족시킴으로써 해당 지역의 연료전지 시장을 견인할 것입니다. UAE, 이집트, 남아프리카공화국 등의 국가들은 시범 버스 프로젝트에 공공 자금을 투입할 뿐만 아니라, 국내 백금 매장량을 활용하여 촉매의 안정적인 공급을 확보함으로써 생태계의 공백을 효과적으로 메우고 있습니다.
유럽에서는 ‘대체 연료 인프라 규정’이 성과를 거두고 있으며, 이에 따라 일정 간격으로 연료 충전소를 설치하는 것이 의무화되었습니다. 이러한 노력은 국경을 넘는 화물 운송을 원활하게 할 뿐만 아니라, 유럽의 연료전지 시장을 활성화시키고 있습니다. 독일은 2030년까지 대중교통을 대폭 확대하는 것을 목표로 한 투자로 주목받고 있습니다. 동시에 영국의 ‘Element 2’ 프로그램에서는 다수의 거점이 조성될 예정이며, 네트워크의 밀도를 한층 더 높이는 데 주력하고 있습니다. 북미에서는 에너지부의 허브 보조금과 캘리포니아주의 저탄소 연료 기준(LCFS) 크레딧이 결합되어, 로스앤젤레스 항과 롱비치 항이 중요한 역할을 담당하는 입지에 놓여 있습니다. 남미는 아직 초기 단계에 있지만, 브라질과 칠레는 야심 찬 목표를 제시하며 연료전지 파워트레인 시장의 잠재적 성장을 시사하고 있습니다.
기타 혜택:
- 엑셀 형식 시장 예측(ME) 시트
- 3개월간의 애널리스트 지원
자주 묻는 질문
목차
제1장 서론
제2장 조사 방법
제3장 개요
제4장 시장 구도
제5장 시장 규모와 성장 예측
제6장 경쟁 구도
제7장 시장 기회와 향후 전망
JHS 26.09.01According to Mordor Intelligence, the fuel cell powertrain market size was valued at USD 1.14 billion in 2025, is expected to reach USD 1.55 billion in 2026, and to reach USD 6.99 billion by 2031, growing at a CAGR of 35.25% over 2026-2031.
This report is Segmented by Component Type (Fuel Cell System, Battery System, and More), Drive Type (Rear Wheel Drive (RWD), Front Wheel Drive (FWD), and More), Vehicle Type (Passenger Cars, Light Commercial Vehicles (LCV), and More), Power Output (Less Than 150 KW, 150-250 KW, and More), and Geography. The Market Forecasts are Provided in Terms of Value (USD).
Global Fuel Cell Powertrain Market Trends and Insights
Government Emission Mandates Accelerating Zero-Emission Adoption
California's Advanced Clean Cars II rule locks in 100% zero-emission light-duty sales by 2035, the EPA's Heavy-Duty Omnibus limits NOx for 2027 trucks, and China extends purchase-tax exemptions through 2027, all compressing OEM timelines and driving fleets toward hydrogen solutions for payload-sensitive segments . The EU's Alternative Fuels Infrastructure Regulation requires hydrogen stations every 200 km across TEN-T corridors by 2030, mitigating range anxiety for cross-border freight. In 2025, Germany allocated significant funding with a vision to substantially increase its public stations by 2030, bolstering domestic adoption. As a result, players in the fuel cell powertrain market discern a stronger influence from regulatory measures over technological advancements in shaping medium-term demand trends.
Breakthroughs in Fuel-Cell Stack Durability and Cost
Honda has introduced its next-generation module, delivering improved efficiency through optimized membrane-electrode assemblies. This innovation significantly reduces costs while extending the module's lifespan. Similarly, Toyota's third-generation stack has achieved a notable milestone in durability by implementing advancements in material usage. Additionally, Cellcentric's latest model enhances power density and demonstrates impressive durability. These technological developments collectively narrow the total-cost-of-ownership gap with diesel, strengthening confidence in the fuel cell powertrain market.
Capital Cost Premium Vs. BEVs
Tata Motors has identified a significant bus premium in India, estimating that it would take several years of service to achieve price parity with hydrogen. Meanwhile, Argonne National Laboratory suggests that purchase-price parity is possible only if certain cost reductions are achieved, which depend on large-scale production volumes. As a result, fleet managers are limiting hydrogen use to routes where the added costs of battery payloads are more significant than the premium.
Other drivers and restraints analyzed in the detailed report include:
- Rapid Build-Out of Hydrogen Refueling Corridors
- OEM Commitments to Fuel-Cell Heavy-Duty Fleets
- Constrained Hydrogen Production and Logistics
For complete list of drivers and restraints, kindly check the Table Of Contents.
Segment Analysis
Hydrogen storage systems will expand at a 35.88% CAGR, surpassing overall fuel cell powertrain market growth, as 700-bar Type IV tanks achieve 6.8 wt% gravimetric capacity and unlock higher payload margins. Fuel cell systems still captured 48.17% 2025 revenue because stacks remain the value anchor, yet modular designs from Cellcentric slash manufacturing complexity 40%, signaling imminent commoditization.
NPROXX's conformable tanks add 18% usable hydrogen without wheelbase stretch, and silicon-carbide inverters from Bosch cut switching losses 30%, demonstrating the fertility of subsystem innovation inside the fuel cell powertrain market. Cummins' vertical integration across electrolyzers and stacks foreshadows turnkey packages that streamline OEM sourcing and expedite warranty coverage.
Rear-wheel drive dominated 2025 with 54.22% share because single-axle layouts satisfy transit and regional-haul duty cycles at the lowest cost. All-wheel drive grows 36.01% CAGR through 2031 as refuse, mining, and military vehicles demand torque vectoring for challenging terrain, widening the addressable fuel cell powertrain market.
Daimler's liquid-hydrogen tractors are testing tandem-axle 6X4 setups to ensure traction on icy slopes. Meanwhile, Volvo has identified that downtime for stuck vehicles justifies the investment in additional motors. While rear-wheel configurations will dominate line-haul fleets, there's potential for all-wheel setups to capture a significant share of the market by 2031. This shift comes as the fuel cell powertrain market begins to take on duty cycles that have historically been the domain of diesel-powered 4X4 and 6X6 chassis.
Complete Report Scope:
- By Component Type
- Fuel Cell System
- Battery System
- Drive System
- Hydrogen Storage System
- Others
- By Drive Type
- Rear Wheel Drive (RWD)
- Front Wheel Drive (FWD)
- All-Wheel Drive (AWD)
- By Vehicle Type
- Passenger Cars
- Light Commercial Vehicles (LCV)
- Buses
- Trucks
- By Power Output
- Less than 150 kW
- 150-250 kW
- More than 250 kW
- By Geography
- North America
- United States
- Canada
- Rest of North America
- South America
- Brazil
- Argentina
- Rest of South America
- Europe
- United Kingdom
- Germany
- Spain
- Italy
- France
- Russia
- Rest of Europe
- Asia-Pacific
- India
- China
- Japan
- South Korea
- Rest of Asia-Pacific
- Middle East and Africa
- United Arab Emirates
- Saudi Arabia
- Turkey
- Egypt
- South Africa
- Rest of Middle East and Africa
- North America
Geography Analysis
In 2025, Asia-Pacific accounted for 40.12% of global revenue, driven by government subsidies in countries like China and Japan, which supported the adoption of fuel-cell trucks and passenger cars. This support solidified Asia-Pacific's dominance in the fuel cell powertrain market. Hyundai aims for an ambitious target of commercial fuel cell electric vehicles (FCEVs) annually by 2030. Concurrently, India is backing electrolyzer localization with a significant mission fund, underscoring a concerted push across multiple nations. In China, demonstration clusters are incentivizing early fleets with operating subsidies, cementing the country's leadership in the fuel cell powertrain market.
Meanwhile, the Middle East and Africa are emerging as the fastest-growing regions, boasting a robust CAGR of 36.41%, as oil-rich nations pivot towards green hydrogen. NEOM's electrolyzer project is set to produce significant output by 2026, catering to both in-house construction fleets and export needs, thereby bolstering the regional fuel cell market. Countries like the UAE, Egypt, and South Africa are not just investing state funds into pilot bus projects but are also leveraging their domestic platinum reserves to ensure a steady catalyst supply, effectively bridging ecosystem gaps.
Europe is reaping benefits from the Alternative Fuels Infrastructure Regulation, which mandates fuel stations at regular intervals . This initiative not only facilitates cross-border freight but also boosts Europe's fuel cell market. Germany is making headlines with investments aimed at significantly increasing public transport by 2030. Simultaneously, the UK's Element 2 program is set to establish a large number of sites, further densifying the network. In North America, the Department of Energy's hub grants, coupled with California's Low Carbon Fuel Standard credits, are positioning the ports of Los Angeles and Long Beach as pivotal players. While South America is still in its nascent stages, Brazil and Chile are setting ambitious targets, signaling a burgeoning potential for the fuel cell powertrain market.
- Toyota Motor Corporation
- Hyundai Motor Company
- Honda Motor Co., Ltd.
- Daimler Truck AG
- Ballard Power Systems Inc.
- Cummins Inc.
- General Motors Company
- Nikola Corporation
- Robert Bosch GmbH
- Plug Power Inc.
- Doosan Fuel Cell Co., Ltd.
- Horizon Fuel Cell Technologies
- Proton Motor Power Systems plc
- Tata Motors Limited
- Wrightbus
Additional Benefits:
- The market estimate (ME) sheet in Excel format
- 3 months of analyst support
TABLE OF CONTENTS
1 Introduction
- 1.1 Study Assumptions & Market Definition
- 1.2 Scope of the Study
2 Research Methodology
3 Executive Summary
4 Market Landscape
- 4.1 Market Overview
- 4.2 Market Drivers
- 4.2.1 Government Emission Mandates Accelerating Zero-Emission Adoption
- 4.2.2 Breakthroughs in Fuel-Cell Stack Durability and Cost
- 4.2.3 Rapid Build-Out of Hydrogen Refueling Corridors
- 4.2.4 OEM Commitments to Fuel-Cell Heavy-Duty Fleets
- 4.2.5 Green-Ammonia-to-H2 Onboard Cracking Synergies
- 4.2.6 Defense Demand for Silent Powertrains in Unmanned Ground Systems
- 4.3 Market Restraints
- 4.3.1 Capital Cost Premium Vs. BEVs
- 4.3.2 Constrained Hydrogen Production and Logistics
- 4.3.3 Safety and Regulatory Hurdles for Onboard H2 Storage
- 4.3.4 Nickel Price Volatility Impacting PT-NI Catalysts
- 4.4 Value / Supply-Chain Analysis
- 4.5 Regulatory Landscape
- 4.6 Technological Outlook
- 4.7 Porter's Five Forces
- 4.7.1 Threat of New Entrants
- 4.7.2 Bargaining Power of Suppliers
- 4.7.3 Bargaining Power of Buyers
- 4.7.4 Threat of Substitutes
- 4.7.5 Competitive Rivalry
5 Market Size & Growth Forecasts (Value (USD))
- 5.1 By Component Type
- 5.1.1 Fuel Cell System
- 5.1.2 Battery System
- 5.1.3 Drive System
- 5.1.4 Hydrogen Storage System
- 5.1.5 Others
- 5.2 By Drive Type
- 5.2.1 Rear Wheel Drive (RWD)
- 5.2.2 Front Wheel Drive (FWD)
- 5.2.3 All-Wheel Drive (AWD)
- 5.3 By Vehicle Type
- 5.3.1 Passenger Cars
- 5.3.2 Light Commercial Vehicles (LCV)
- 5.3.3 Buses
- 5.3.4 Trucks
- 5.4 By Power Output
- 5.4.1 Less than 150 kW
- 5.4.2 150-250 kW
- 5.4.3 More than 250 kW
- 5.5 By Geography
- 5.5.1 North America
- 5.5.1.1 United States
- 5.5.1.2 Canada
- 5.5.1.3 Rest of North America
- 5.5.2 South America
- 5.5.2.1 Brazil
- 5.5.2.2 Argentina
- 5.5.2.3 Rest of South America
- 5.5.3 Europe
- 5.5.3.1 United Kingdom
- 5.5.3.2 Germany
- 5.5.3.3 Spain
- 5.5.3.4 Italy
- 5.5.3.5 France
- 5.5.3.6 Russia
- 5.5.3.7 Rest of Europe
- 5.5.4 Asia-Pacific
- 5.5.4.1 India
- 5.5.4.2 China
- 5.5.4.3 Japan
- 5.5.4.4 South Korea
- 5.5.4.5 Rest of Asia-Pacific
- 5.5.5 Middle East and Africa
- 5.5.5.1 United Arab Emirates
- 5.5.5.2 Saudi Arabia
- 5.5.5.3 Turkey
- 5.5.5.4 Egypt
- 5.5.5.5 South Africa
- 5.5.5.6 Rest of Middle East and Africa
- 5.5.1 North America
6 Competitive Landscape
- 6.1 Market Concentration
- 6.2 Strategic Moves
- 6.3 Market Share Analysis
- 6.4 Company Profiles (includes Global Level Overview, Market Level Overview, Core Segments, Financials as Available, Strategic Information, Market Rank/Share for Key Companies, Products and Services, SWOT Analysis, and Recent Developments)
- 6.4.1 Toyota Motor Corporation
- 6.4.2 Hyundai Motor Company
- 6.4.3 Honda Motor Co., Ltd.
- 6.4.4 Daimler Truck AG
- 6.4.5 Ballard Power Systems Inc.
- 6.4.6 Cummins Inc.
- 6.4.7 General Motors Company
- 6.4.8 Nikola Corporation
- 6.4.9 Robert Bosch GmbH
- 6.4.10 Plug Power Inc.
- 6.4.11 Doosan Fuel Cell Co., Ltd.
- 6.4.12 Horizon Fuel Cell Technologies
- 6.4.13 Proton Motor Power Systems plc
- 6.4.14 Tata Motors Limited
- 6.4.15 Wrightbus
7 Market Opportunities & Future Outlook
- 7.1 White-space & Unmet-Need Assessment