
|
시장보고서
상품코드
2118025
스포츠 중계권 시장 : 점유율 분석, 업계 동향과 통계, 성장 예측(2026-2031년)Sports Broadcasting Rights - Market Share Analysis, Industry Trends & Statistics, Growth Forecasts (2026 - 2031) |
||||||
 Mordor Intelligence
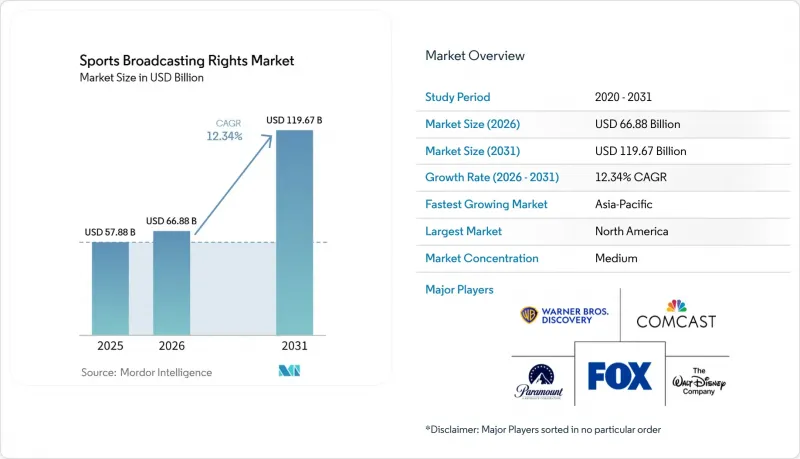
Mordor Intelligence에 의하면, 스포츠 중계권 시장 규모는 2025년에 578억 8,000만 달러로 평가되었고 2026년 668억 8,000만 달러에서 2031년까지 1,196억 7,000만 달러에 이를 것으로 추정되고 있어 예측 기간(2026-2031년) CAGR은 12.34%를 나타낼 전망입니다.
본 보고서는 권리 유형(TV 중계권, 디지털 및 라이브 스트리밍권, 라디오 중계권, 하이라이트 및 클립권 등), 스포츠 리그(세계 프리미엄 스포츠 리그 등), 기기 유형(스마트폰 및 태블릿 등), 스포츠 종목(축구, 농구 등), 그리고 지역별로 분류되어 있습니다. 시장 예측은 금액(달러)으로 표시됩니다.
세계 스포츠 중계권 시장 동향 및 인사이트
구독 서비스의 핵심 요소로서 라이브 스포츠의 가치 상승
라이브 스포츠는 여전히 특정 시간에 특정 플랫폼으로 시청자를 끌어들이는 몇 안 되는 컨텐츠 카테고리 중 하나이며, 이로 인해 스포츠 중계권 시장에는 탁월한 가격 결정력이 발생하고 있습니다. NBA가 디즈니, NBC 유니버설, 아마존과 체결한 11년 계약은 2025-26 시즌부터 시작되며, 전미 규모의 경기가 널리 보급된 스트리밍 서비스와 TV 방송을 통해 중계될 예정입니다. 이 계약 패키지의 아마존 부분에는 광범위한 국제 중계권도 포함되어 있으며, 이는 권리의 가치가 현재 플랫폼의 규모 확대와 지속적인 참여도를 얼마나 지원할 수 있는지에 따라 평가되고 있음을 보여줍니다. 이에 따라 스포츠 중계권 시장의 협상 논리가 변화했습니다. 리그 측은 프로그램 제작 예산뿐만 아니라 시청자 수 증가에 대해서도 구매 측에 요구할 수 있게 되었기 때문입니다. 이러한 변화로 인해 계약 갱신 시의 최저 조건은 높은 수준을 유지하고 있으며, 재무 기반이 탄탄한 기업으로 경쟁의 장이 한정되면서 라이브 스포츠는 장기적인 플랫폼 계획에서 더욱 중심적인 위치를 차지하게 되었습니다.
패키지 및 윈도우를 아우르는 권리의 세분화
스포츠 중계권 시장에서는 단일 대형 국내 패키지보다 개별 윈도우로 나누는 편이 더 많은 입찰자를 유치하는 경우가 많기 때문에 각 리그는 권리를 더 많은 패키지로 분할하고 있습니다. 미국 연방통신위원회(FCC)에 따르면, 2025년에는 NFL 경기가 미국 내 10개 서비스에서 방송될 것이며, 모든 경기를 시청하려는 팬들은 1,500달러 이상을 지출할 가능성이 있다고 지적하고 있습니다. 프리미어리그의 국내 생중계권과 무료 방송 하이라이트도 별도의 체계를 통해 판매되고 있으며, 이는 최상위 스포츠 컨텐츠가 현재 시청자층별로 개별적으로 수익을 창출하고 있음을 보여줍니다. 이러한 접근 방식은 권리 판매자에게 총 가치를 높여주지만, 과거 방송 사업자들이 대규모 독점 입찰을 정당화하기 위해 활용하던 ‘단순성’을 훼손하게 됩니다. 그 결과, 더 많은 계약이 체결되는 한편, 각 구매자는 자신이 구매하는 패키지 부분에 대한 정당성을 입증하기 위해 더 많은 노력을 기울여야 하는 스포츠 중계권 시장이 형성되고 있습니다.
‘코드 커팅’과 축소되는 유료 TV 번들
코드 커팅은 스포츠 중계권 시장에서 스트리밍이 주류를 이루기 전, 많은 프리미엄 계약의 자금원이 되었던 기존 방송 기반을 지속적으로 약화시키고 있습니다. 시청자가 단순하고 올인원(all-in-one)인 패키지를 잃게 되면 경기를 찾기가 어려워지며, 이로 인해 기존 방송사가 과거 리그에 제공하던 도달 범위상의 우위가 약화됩니다. NFL의 분열을 부각시킨 바로 그 FCC 조사는 단일 스포츠에 대한 완전한 접근을 원하는 소비자들에게 현재의 시청 환경이 얼마나 어려워졌는지도 보여주었습니다. 이러한 압박으로 인해 구매자들은 광범위한 독점권보다는 공유 창, 더 좁은 패키지, 그리고 선택적인 권리 확보를 추구하게 되었습니다. 또한, 특히 기존 유료 TV의 쇠퇴가 스트리밍의 규모 확대보다 빠른 속도로 진행되고 있는 지역에서는 스포츠 중계권 시장에서 시청자의 편의성과 상업적 회복 사이에 뿌리 깊은 격차가 남아 있습니다.
부문 분석
2025년, TV 중계권은 스포츠 중계권 시장의 37.52%를 차지했으며, 시청 습관의 변화가 지속되는 가운데에서도 리니어 방송은 여전히 가장 큰 단일 권리 카테고리로서의 지위를 유지했습니다. 이러한 위상은 대규모 공유형 라이브 경험의 지속력을 반영하며, 방송사는 여전히 광범위한 가구에 도달하고, 친숙한 컨텐츠 발견, 그리고 안정적인 광고주 수요를 제공합니다. 프리미어리그의 영국 내 생중계권 및 무료 방송 하이라이트 영상 판매 과정을 통해, 광범위한 생중계와 세컨더리 윈도우는 종합적인 단일 패키지를 통해서가 아니라 병행하여 수익화할 수 있음이 입증되었습니다. 스포츠 중계권 시장에서 텔레비전은 여전히 대규모 이벤트의 기본 전달 수단으로 자리 잡고 있습니다. 이는 일반 시청자의 접근을 용이하게 하고, 주요 경기에서 광고주를 위한 프리미엄 광고 시간을 확보할 수 있기 때문입니다. 라디오 중계권이나 하이라이트 클립 권리는 규모는 작지만, 시청자와의 접점을 확대하고, 무료 접근성을 유지하며, 생중계 경기 그 자체를 넘어서는 가치를 확산하는 데 여전히 유용한 역할을 하고 있습니다.
디지털 및 라이브 스트리밍 중계권은 2031년까지 연평균 성장률(CAGR) 12.78%로 확대될 것으로 예측되며, 스포츠 중계권 시장에서 가장 빠르게 성장하는 권리 유형입니다. NBA의 현재 권리 구조가 그 이유를 잘 보여줍니다. 전국으로 방송되는 모든 경기가 널리 보급된 스트리밍 서비스를 통해 시청 가능해지는 한편, TV 방송을 통한 노출도 확대되고 있습니다. 이는 스트리밍이 더 이상 프리미엄 리그의 ‘추가 방송 채널’로 취급되지 않고, 여러 플랫폼을 아우르는 국내 및 국제 방송의 핵심 경로로 자리매김하고 있음을 의미합니다. 스포츠 중계권 업계에서 TV 중계권과 디지털 스트리밍 권의 격차가 줄어들고 있는 것은 양자가 이제 하나의 상업 시스템에 통합된 관련 부분으로서 판매되고 있기 때문입니다. 실제로 향후 협상에서는 단독 독점 계약 확보에 초점을 맞추기보다는 패키지 전체의 가치를 훼손하지 않으면서 몇 개의 방송 채널, 기기, 지역에서 수익을 창출할 수 있는지에 중점이 두어질 것입니다.
2025년, 전 세계 주요 스포츠 리그는 스포츠 중계권 시장의 53.46%를 차지하고 있으며, 소수의 주요 대회가 여전히 가장 큰 가치 풀을 지배하고 있음을 뒷받침하고 있습니다. NFL, NBA, 프리미어리그는 그 계약 내용이 더 광범위한 스포츠 중계권 시장 전체에서 구매자가 규모, 일정 안정성, 재시청자 행동을 어떻게 평가하는지를 형성하고 있기 때문에 가격 형성에 계속해서 영향력을 행사하고 있습니다. 또한, 프리미엄 리그는 방송사, 일반 엔터테인먼트 스트리밍 서비스, 통신 플랫폼, 광고 파트너 등 가장 폭넓은 계층을 끌어들이고 있어, 계약 금액이 급등하는 상황에서도 경쟁력을 유지하는 데 도움이 되고 있습니다. 상위층으로의 집중이 시장이 폐쇄적임을 의미하는 것은 아니지만, 벤치마크가 되는 가격 책정은 여전히 제한된 수의 세계 스포츠 리그에 의해 결정되고 있음을 보여줍니다. 이러한 벤치마크 계약은 단순한 이벤트 일정이 아니라, 대규모 미디어 자산으로서 가격을 책정하고자 하는 다른 국내 및 지역 스포츠 대회의 기대치를 형성하는 요인이 됩니다.
지역 및 대륙 규모의 스포츠 리그는 2031년까지 연평균 성장률(CAGR) 13.27%를 나타낼 것으로 예측되며, 스포츠 중계권 시장에서 가장 빠르게 성장하는 리그 카테고리가 될 것입니다. 2025-26 시즌 CAF 챔피언스리그 결승전은 beIN Sports, Canal+, DAZN, SuperSport, Channel 4 등의 방송사를 통해 60개 이상의 지역에서 중계되며, 대륙 규모의 축구가 자국 시청자층을 훨씬 넘어 확산될 수 있음을 입증했습니다. 이 부문의 성장은 지금까지 방송이 미흡했던 종목에 기인하며, 특히 최대 규모의 리그에 따르는 가격 부담 없이 새로운 시장에 중계권을 판매할 수 있는 경우에 두드러집니다. 이를 통해 구매자는 차별화된 포트폴리오를 구축할 여지가 생기고, 한편 리그 측은 세계 최고 수준의 경기와 동등한 비용 구조를 감당하지 않고도 더 광범위한 수익 창출의 길을 열 수 있습니다. 더욱 중요한 점은 현재 리그의 가치가 국내 팬들의 열광도뿐만 아니라, 해당 컨텐츠가 새로운 언어, 플랫폼, 스폰서십 환경으로 얼마나 쉽게 확장될 수 있는지에 의해서도 좌우된다는 것입니다.
지역별 분석
2025년, 북미는 스포츠 중계권 시장 점유율의 48.54%를 차지하며 최대 지역 수익원이 되었습니다. 이 지역의 우위는 다른 지역에서는 아직 유례를 찾아볼 수 없는 계약 금액에 기인하며, 특히 NFL과 NBA의 경우 연간 지급액이 북미 이외의 대부분의 리그를 훨씬 상회하고 있습니다. NBA의 11년간 770억 달러에 달하는 계약은 미국 내 프리미엄 중계권이 방송 규모와 대규모 스트리밍 계약을 양립시킬 수 있으며, 둘 중 하나를 선택해야만 하는 상황이 아니라는 점을 보여줍니다. 이 모델은 북미에서 특히 중요한데, 그 이유는 주요 리그들이 여전히 광범위한 도달 범위, 다수의 생중계 시청자, 그리고 강력한 광고 지원을 동시에 기대하고 있기 때문입니다. 또한, 이는 전 세계 스포츠 중계권 시장 전체에서 가격 책정, 패키징 및 플랫폼 간 경쟁에 관한 가장 명확한 기준점이 여전히 이 지역임을 의미합니다.
아시아태평양은 2031년까지 연평균 성장률(CAGR) 12.83%로 확대될 것으로 예측되며, 스포츠 중계권 시장에서 가장 빠르게 성장하고 있는 지역입니다. 이러한 성장은 모바일 우선 시청 경향, 스트리밍 보급률 상승, 그리고 인도 및 인근 시장에서 크리켓을 중심으로 한 참여 규모에 의해 뒷받침되고 있습니다. 또한 아시아태평양이 중요한 이유는 이 지역의 구매자들이 스포츠를 광범위한 엔터테인먼트 번들의 핵심으로 활용하는 경우가 많아, 단기적인 투자 회수가 어려운 경우에도 해당 권리가 전략적으로 중요한 위치를 계속 차지하기 때문입니다. 국제 축구와 크리켓, 그리고 다양한 지역 스포츠 포트폴리오가 지역 전체로 더욱 확대됨에 따라, 스포츠 중계권 시장에서는 언어, 접근성, 스포츠의 조합을 통해 차별화를 꾀해야 하는 구매자가 더욱 늘어나고 있습니다. 이로 인해 플랫폼 통합으로 인해 적극적인 입찰자 수가 감소하더라도 가격 책정 규율은 여전히 중요할 것이며, 아시아태평양은 향후 중계권 확대에 있어 주요 성장 지역으로서의 지위를 유지하게 될 것입니다.
유럽은 축구가 계속해서 해당 지역의 수익 구조를 좌우하고 있기 때문에 스포츠 중계권 시장에서 가장 큰 수익 기반 중 하나로 남아 있습니다. 프리미어리그는 2025-29 시즌 국내 중계권 계약을 67억 파운드(85억 1,000만 달러)에 체결했으며, 한편,라 리가는 2027/28-2031/32 시즌 국내 영상 스트리밍 권리가 61억 3,500만 유로(66억 9,000만 달러)에 달했다고 발표했습니다. Canal+는 벨기에, 폴란드, 오스트리아, 스위스에서 UEFA 남자 클럽 대회 중계권을 2030-31 시즌까지 연장했으며, DAZN은 프랑스 내 세리에 A 독점 중계권을 2028-29 시즌까지 갱신했습니다. 남미, 중동 및 아프리카는 여전히 비교적 소규모 시장이지만, CAF 챔피언스리그 결승전이 국제적으로 광범위하게 보도된 것을 통해 아프리카 클럽 축구가 이전보다 국경을 초월한 미디어의 주목을 받고 있음이 드러났습니다.
기타 혜택:
- 엑셀 형식 시장 예측(ME) 시트
- 3개월간의 애널리스트 지원
자주 묻는 질문
목차
제1장 서론
제2장 조사 방법
제3장 개요
제4장 시장 구도
제5장 시장 규모와 성장 예측
제6장 경쟁 구도
제7장 시장 기회와 향후 전망
JHS 26.09.01According to Mordor Intelligence, the sports broadcasting rights market size was valued at USD 57.88 billion in 2025 and estimated to grow from USD 66.88 billion in 2026 to reach USD 119.67 billion by 2031, at a CAGR of 12.34% during the forecast period (2026-2031).
This report is Segmented by Rights Type (Television Broadcasting Rights, Digital and Live Streaming Rights, Radio Broadcasting Rights, Highlight and Clip Rights, and More), Sports League (Global Premium Sports Leagues, and More), Device Type (Smartphones and Tablets, and More), Sport Type (Football, Basketball, and More), and Geography. The Market Forecasts are Provided in Terms of Value (USD).
Global Sports Broadcasting Rights Market Trends and Insights
Rising Value of Live Sports as a Subscription Anchor
Live sports remain one of the few content categories that still pull viewers to specific platforms at specific times, giving the sports broadcasting rights market unusual pricing power. The NBA's 11-year agreement with Disney, NBCUniversal, and Amazon begins in the 2025-26 season and places national games across widely distributed streaming services and broadcast television. The Amazon portion of that package also adds broad international distribution rights, indicating that rights are now judged by how well they support platform scale and recurring engagement. This has changed the negotiation logic in the sports broadcasting rights market, because leagues can now press buyers on audience growth rather than only on programming budgets. That shift keeps renewal floors high, narrows the field to companies with stronger balance sheets, and makes live sports more central to long-cycle platform planning.
Rights Fragmentation Across Packages and Windows
Leagues are splitting rights into more packages because separate windows often attract more bidders than a single large national bundle would in the sports broadcasting rights market. The US Federal Communications Commission said NFL games were aired across 10 services in the United States in 2025, and noted that a fan trying to watch every game could spend more than USD 1,500. The Premier League's domestic live rights and free-to-air highlights were also sold through separate structures, which shows how top properties now monetize each viewing layer separately. This approach increases total value for rights sellers, but it also reduces the simplicity broadcasters once used to defend large, exclusive bids. The result is a sports broadcasting rights market where more contracts can be sold, but where each buyer must work harder to justify its own slice of the package.
Cord-Cutting and Shrinking Pay TV Bundles
Cord-cutting continues to weaken the old distribution base that funded many premium contracts before streaming became central to the sports broadcasting rights market. When viewers lose a simple, all-in-one bundle, they face a harder path to finding games, which weakens the reach advantage that traditional broadcasters once offered leagues. The same FCC review that highlighted NFL fragmentation also showed how difficult the current viewing environment has become for consumers seeking full access to a single sport. This pressure pushes buyers toward shared windows, narrower packages, and selective rights bets instead of broad exclusivity. It also leaves the sports broadcasting rights market with a persistent gap between audience convenience and commercial recovery, especially where legacy pay-TV erosion is moving faster than streaming scale.
Other drivers and restraints analyzed in the detailed report include:
- Shift Toward Ad-Supported Streaming Sports Bundles
- Globalization of Premier Leagues and Flagship Events
- Escalating Rights Fees Versus Slower Monetization Payback
For complete list of drivers and restraints, kindly check the Table Of Contents.
Segment Analysis
Television broadcasting rights accounted for 37.52% of the sports broadcasting rights market in 2025, which kept linear distribution as the largest single rights category even as viewing habits continued to change. That position reflects the staying power of large shared live experiences, where broadcasters still offer wide household reach, familiar discovery, and stable advertiser demand. The Premier League's sales process for UK live rights and free-to-air highlights showed that broad live coverage and secondary windows can still be monetized side by side rather than through one all-encompassing package. In the sports broadcasting rights market, television remains the default layer for mass events because it simplifies access for casual viewers and preserves premium inventory for advertisers during major fixtures. Radio broadcasting rights and highlight and clip rights are smaller, but they still play a useful role in expanding audience touchpoints, preserving free access, and extending value beyond the live match itself.
Digital and live streaming rights are projected to expand at a 12.78% CAGR through 2031, which makes them the fastest-growing rights type in the sports broadcasting rights market. The NBA's current rights structure shows why: every national game will be available on widely distributed streaming services while broadcast exposure also expands. This means streaming is no longer treated as an add-on window for premium leagues, but as a core path for national and international distribution across several platforms at once. In the sports broadcasting rights industry, that reduces the gap between television and digital rights because both are now being sold as linked parts of one commercial system. The practical effect is that future negotiations will focus less on one exclusive winner and more on how many windows, devices, and territories can be monetized without weakening the overall package.
Global premium sports leagues held 53.46% of the sports broadcasting rights market in 2025, which confirms that a small group of marquee competitions still controls the largest value pools. The NFL, NBA, and Premier League continue to influence pricing because their contracts shape how buyers assess scale, scheduling consistency, and repeat-viewer behavior across the broader sports broadcasting rights market. Premium leagues also attract the broadest mix of broadcasters, general entertainment streamers, telecom-linked platforms, and advertising partners, helping sustain competition even as deal values rise sharply. That concentration at the top does not mean the field is closed, but it does mean that benchmark pricing is still set by a limited number of global properties. Those benchmark deals then shape expectations for other national and regional competitions that want to price themselves as scaled media assets rather than simple event schedules.
Regional and continental sports leagues are projected to grow at a 13.27% CAGR through 2031, making them the fastest-growing sports league category in the sports broadcasting rights market. The 2025-26 CAF Champions League final reached broadcasters including beIN Sports, Canal+, DAZN, SuperSport, and Channel 4 across more than 60 territories, demonstrating that continental football can travel well beyond its home audience. Growth in this layer comes from properties that were previously underdistributed, especially when rights can be sold into new markets without the price burden attached to the largest leagues. That gives buyers room to build differentiated portfolios, while leagues gain a route to wider monetization without matching the cost structure of top-tier global properties. The deeper point is that league value now depends not only on domestic fan intensity, but also on how easily a property can be exported into new language, platform, and sponsorship environments.
Complete Report Scope:
- By Rights Type
- Television Broadcasting Rights
- Digital and Live Streaming Rights
- Radio Broadcasting Rights
- Highlight and Clip Rights
- Other Rights Types
- By Sports League
- Global Premium Sports Leagues
- Regional/Continental Sports Leagues
- Domestic Sports Leagues
- Other Sports Leagues
- By Device Type
- Smartphones and Tablets
- Smart TVs
- Laptops and Desktops
- Other Device Types
- By Sport Type
- Football
- Cricket
- Basketball
- Tennis
- Motorsports
- Other Sport Types
- By Geography
- North America
- United States
- Canada
- Mexico
- South America
- Brazil
- Argentina
- Chile
- Rest of South America
- Europe
- Germany
- United Kingdom
- France
- Italy
- Spain
- Rest of Europe
- Asia-Pacific
- China
- Japan
- India
- South Korea
- Australia
- Rest of Asia-Pacific
- Middle East
- Saudi Arabia
- United Arab Emirates
- Qatar
- Rest of Middle East
- Africa
- South Africa
- Egypt
- Nigeria
- Rest of Africa
- North America
Geography Analysis
North America held 48.54% of the sports broadcasting rights market share in 2025, making it the largest regional revenue center. The region's lead stems from contract values that remain unmatched elsewhere, especially in the NFL and NBA, where annual obligations sit far above those of most non-North American leagues. The NBA's 11-year, USD 77 billion agreement shows how premium US rights combine broadcast scale with large streaming commitments rather than forcing a choice between them. That model is especially important in North America because major leagues still expect broad reach, heavy live viewing, and strong advertising support simultaneously. It also means that the region remains the clearest reference point for pricing, packaging, and platform competition across the global sports broadcasting rights market.
Asia-Pacific is projected to expand at a 12.83% CAGR through 2031, which makes it the fastest-growing geography in the sports broadcasting rights market. Growth is being supported by mobile-first viewing, rising streaming penetration, and the scale of cricket-led engagement across India and nearby markets. Asia-Pacific also matters because buyers in the region often use sport to anchor broader entertainment bundles, which keeps rights strategically important even when short-term payback is tight. As international football, cricket, and mixed local portfolios spread further across the region, the sports broadcasting rights market gains more buyers that need differentiation through language, access, and sport mix. This leaves Asia-Pacific as the key growth region for future rights expansion, even though pricing discipline will still matter when platform consolidation reduces the number of active bidders.
Europe remained one of the largest revenue bases in the sports broadcasting rights market because football continued to define the region's monetization structure. The Premier League completed a domestic deal worth GBP 6.7 billion (USD 8.51 billion) for 2025-29, while LaLiga said its 2027/28-2031/32 domestic audiovisual rights reached EUR 6.135 billion (USD 6.69 billion). Canal+ extended its UEFA men's club competition rights across Belgium, Poland, Austria, and Switzerland through the 2030-31 season, while DAZN renewed exclusive Serie A rights in France through 2028-29. South America, the Middle East, and Africa still represent smaller pools, but broader international coverage of the CAF Champions League final showed that African club football is drawing more cross-border media attention than before.
- The Walt Disney Company
- Comcast Corporation
- Fox Corporation
- Paramount Global
- Warner Bros. Discovery, Inc.
- Amazon.com, Inc.
- Alphabet Inc.
- Netflix, Inc.
- Apple Inc.
- DAZN Group Limited
- Viacom18 Media Private Limited
- Sky Group Limited
- Canal+ Group
- European Broadcasting Union
- TelevisaUnivision, Inc.
- Tencent Holdings Limited
Additional Benefits:
- The market estimate (ME) sheet in Excel format
- 3 months of analyst support
TABLE OF CONTENTS
1 INTRODUCTION
- 1.1 Study Assumptions and Market Definition
- 1.2 Scope of The Study
2 RESEARCH METHODOLOGY
3 EXECUTIVE SUMMARY
4 MARKET LANDSCAPE
- 4.1 Market Overview
- 4.2 Market Drivers
- 4.2.1 Rising Value of Live Sports as a Subscription Anchor
- 4.2.2 Rights Fragmentation across Packages and Windows
- 4.2.3 Shift Toward Ad-Supported Streaming Sports Bundles
- 4.2.4 Globalization of Premier Leagues and Flagship Events
- 4.2.5 Rising Competition from Tech Platforms for Premium Rights
- 4.2.6 Direct-To-Consumer Monetization by Leagues and Federations
- 4.3 Market Restraints
- 4.3.1 Cord-Cutting and Shrinking Pay TV Bundles
- 4.3.2 Escalating Rights Fees Versus Slower Monetization Payback
- 4.3.3 Fragmentation Fatigue for Consumers and Advertisers
- 4.3.4 Weak Growth for Mid-Tier and Regional Properties
- 4.4 Industry Value Chain Analysis
- 4.5 Regulatory Landscape
- 4.6 Technological Outlook
- 4.7 Porter's Five Forces Analysis
- 4.7.1 Bargaining Power of Buyers
- 4.7.2 Bargaining Power of Suppliers
- 4.7.3 Threat of New Entrants
- 4.7.4 Threat of Substitutes
- 4.7.5 Intensity of Competitive Rivalry
- 4.8 Impact of Macroeconomic Factors on the Market
5 MARKET SIZE AND GROWTH FORECASTS (VALUE)
- 5.1 By Rights Type
- 5.1.1 Television Broadcasting Rights
- 5.1.2 Digital and Live Streaming Rights
- 5.1.3 Radio Broadcasting Rights
- 5.1.4 Highlight and Clip Rights
- 5.1.5 Other Rights Types
- 5.2 By Sports League
- 5.2.1 Global Premium Sports Leagues
- 5.2.2 Regional/Continental Sports Leagues
- 5.2.3 Domestic Sports Leagues
- 5.2.4 Other Sports Leagues
- 5.3 By Device Type
- 5.3.1 Smartphones and Tablets
- 5.3.2 Smart TVs
- 5.3.3 Laptops and Desktops
- 5.3.4 Other Device Types
- 5.4 By Sport Type
- 5.4.1 Football
- 5.4.2 Cricket
- 5.4.3 Basketball
- 5.4.4 Tennis
- 5.4.5 Motorsports
- 5.4.6 Other Sport Types
- 5.5 By Geography
- 5.5.1 North America
- 5.5.1.1 United States
- 5.5.1.2 Canada
- 5.5.1.3 Mexico
- 5.5.2 South America
- 5.5.2.1 Brazil
- 5.5.2.2 Argentina
- 5.5.2.3 Chile
- 5.5.2.4 Rest of South America
- 5.5.3 Europe
- 5.5.3.1 Germany
- 5.5.3.2 United Kingdom
- 5.5.3.3 France
- 5.5.3.4 Italy
- 5.5.3.5 Spain
- 5.5.3.6 Rest of Europe
- 5.5.4 Asia-Pacific
- 5.5.4.1 China
- 5.5.4.2 Japan
- 5.5.4.3 India
- 5.5.4.4 South Korea
- 5.5.4.5 Australia
- 5.5.4.6 Rest of Asia-Pacific
- 5.5.5 Middle East
- 5.5.5.1 Saudi Arabia
- 5.5.5.2 United Arab Emirates
- 5.5.5.3 Qatar
- 5.5.5.4 Rest of Middle East
- 5.5.6 Africa
- 5.5.6.1 South Africa
- 5.5.6.2 Egypt
- 5.5.6.3 Nigeria
- 5.5.6.4 Rest of Africa
- 5.5.1 North America
6 COMPETITIVE LANDSCAPE
- 6.1 Market Concentration
- 6.2 Strategic Moves
- 6.3 Vendor Positioning Analysis
- 6.4 Company Profiles (includes Global Level Overview, Market Level Overview, Core Segments, Financials as available, Strategic Information, Market Rank/Share, Products and Services, Recent Developments)
- 6.4.1 The Walt Disney Company
- 6.4.2 Comcast Corporation
- 6.4.3 Fox Corporation
- 6.4.4 Paramount Global
- 6.4.5 Warner Bros. Discovery, Inc.
- 6.4.6 Amazon.com, Inc.
- 6.4.7 Alphabet Inc.
- 6.4.8 Netflix, Inc.
- 6.4.9 Apple Inc.
- 6.4.10 DAZN Group Limited
- 6.4.11 Viacom18 Media Private Limited
- 6.4.12 Sky Group Limited
- 6.4.13 Canal+ Group
- 6.4.14 European Broadcasting Union
- 6.4.15 TelevisaUnivision, Inc.
- 6.4.16 Tencent Holdings Limited
7 MARKET OPPORTUNITIES AND FUTURE OUTLOOK
- 7.1 White-Space and Unmet-Need Assessment


