

|
시장보고서
상품코드
2118881
아시아태평양의 5G 인프라 시장 : 시장 점유율 분석, 업계 동향 및 통계, 성장 예측(2026-2031년)Asia-Pacific 5G Infrastructure - Market Share Analysis, Industry Trends & Statistics, Growth Forecasts (2026 - 2031) |
||||||
 Mordor Intelligence
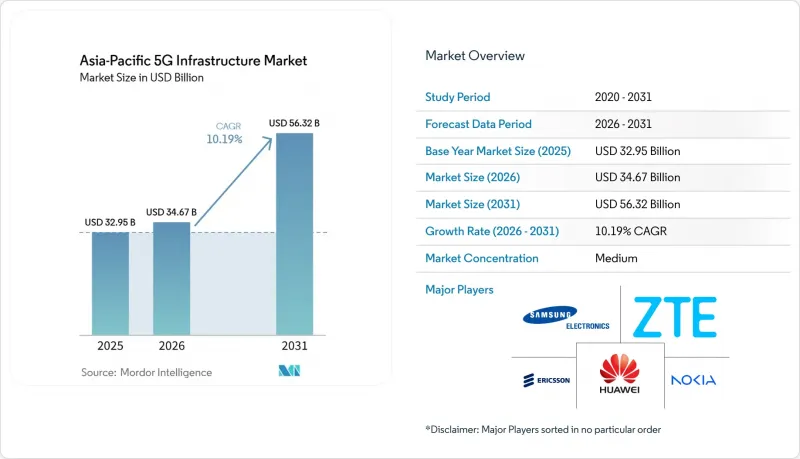
Mordor Intelligence에 의하면, 아시아태평양의 5G 인프라 시장 규모는 2025년 329억 5,000만 달러로 평가되었고, 2026년 346억 7,000만 달러에서 2031년까지 563억 2,000만 달러로 확대될 것으로 예측되며, 2026-2031년 CAGR 10.19%를 기록하는 전망입니다.
본 보고서는 통신 인프라별(5G 무선 액세스 네트워크(RAN) 등), 주파수 대역별(저대역 등), 네트워크 아키텍처별(비독립형(NSA) 및 독립형(SA)), 코어 네트워크 기술별(소프트웨어 정의 네트워크(SDN) 등), 최종 사용자 산업별(가전제품 등), 그리고 국가별로 분류되어 있습니다. 시장 전망은 금액(달러) 기준으로 제시되어 있습니다.
아시아태평양의 5G 인프라 시장 동향 및 인사이트
5G 트래픽 밀도 증가 및 저지연에 대한 수요
2025년 말 기준, 중국의 5G 가입자 수는 12억 400만 건 이상, 모바일 IoT 단말기 연결 수는 28억 8,800만 건에 달했습니다. 이러한 규모에 대응하기 위해 통신 사업자는 용량을 확충함과 동시에 독립형(SA) 코어 네트워크 업그레이드도 추진해야 합니다. 2026년 3월 기준, 중국의 5G-Advanced 서비스는 330개 도시를 커버하고 있으며, 대규모 빔포밍을 관리할 수 있는 능동형 안테나 시스템에 의해 뒷받침되고 있습니다. 고밀도 무선 기지국과 독립형 아키텍처의 병행 구축은 저지연 서비스로의 길을 단축하지만, 한편으로는 벤더와 기지국 전문가들에게 초기 자본 요건도 증가시킵니다. 5G 및 산업용 인터넷 프로그램을 활용하는 스마트 팩토리에서는 제품 품질이 20.5%, 생산 능력이 24.7% 향상되었습니다. 이러한 운영 실적은 아시아태평양의 5G 인프라 시장에서 용량 및 지연에 민감한 산업용 연결에 대한 수요가 더욱 확대될 것임을 뒷받침합니다.
정부 주도의 주파수 할당 및 구축 프로그램
인도 통신 규제 당국은 2026년 2월, 9개 주파수 대역에 걸친 11,789.15MHz의 주파수에 대한 경매 권고안을 발표했습니다. 이 제안에는 2.10 락 크로레(231억 달러)의 최저 입찰가가 설정되어 있었습니다. 또한, 통신 서비스 사각지대에 새로운 기지국을 설치하는 것을 조건으로 최저 입찰가를 10% 인하하는 조치를 취하여, 통신 사업자의 투자가 서비스가 부족한 지역으로 향하도록 유도했습니다. 베트남은 2만 기의 5G 기지국을 건설하는 통신 사업자에 대해 주파수 할당 할인과 장비 비용 지원을 결합하여, 정책을 통해 인프라 투자를 촉진했습니다. 한국은 2026년까지 독립형(SA) 방식으로의 업그레이드를 의무화하고, 실내 커버리지 목표를 달성한 통신 사업자를 지원하기 위해 LTE 주파수 재할당 수수료를 인하했습니다. 현재, 정부의 조치는 주파수 할당 범위를 넘어 아시아태평양의 전체 5G 인프라 시장에서 네트워크 투자의 속도, 장소 및 아키텍처를 형성하고 있습니다.
고밀도화 및 광섬유 백홀에 대한 설비 투자
고밀도 스몰 셀 네트워크에서는 각 사이트에 광섬유 회선이 필요합니다. 특히 통신 사업자가 mm파 대역의 주파수 대역을 사용하거나 용량 계층을 추가하는 경우에는 더욱 그렇습니다. 중국의 광섬유 네트워크는 2025년 말까지 7,499만 km에 달하여 대규모 5G 구축을 위한 견고한 기반을 마련했습니다. 반면, 동남아시아와 남아시아의 많은 시장에서는 라스트 마일 광섬유가 부족하여 고밀도화 비용이 더 많이 들고 실현까지 걸리는 시간도 길어지고 있습니다. 이 광범위한 지역은 향후 10년 말까지 2,000억 달러 규모의 인프라 투자 부족에 직면해 있으며, 여기에는 백홀 자금 조달의 격차도 포함됩니다. 견고한 광섬유 네트워크를 갖추지 못한 통신 사업자는 고가의 무선 백홀과 용량 확장의 지연 중 하나를 선택할 수밖에 없습니다. 인도나 인도네시아와 같은 시장에서는 부지 확보, 전력 공급, 토지 소유주와의 협상으로 인해 스몰 셀 구축이 18-24개월 지연될 가능성이 있습니다.
부문 분석
2025년, 아시아태평양의 통신 인프라 시장에서 5G 무선 액세스 네트워크(RAN)는 5G 인프라 시장 점유율의 60.96%를 차지했습니다. 중국, 인도, 일본, 동남아시아 전역에서 통신 사업자들이 기지국 밀도를 높이고 있기 때문에 RAN은 여전히 자본 투자의 주요 대상입니다. 차이나타워는 2026년 중반까지 연간 90만 기 이상의 기지국을 구축하여, 누적 560만 곳 이상의 사이트 구축에 기여했습니다. 이러한 사업 규모야말로 무선 장비, 안테나, 사이트 인프라가 계속해서 지출의 대부분을 차지하는 이유를 보여줍니다. 트랜스포트/xHaul은 신규 매크로 사이트와 스몰 셀 모두에 프론트홀, 미드홀 또는 백홀 링크가 필요하기 때문에 두 번째로 큰 하위 부문이 되었습니다.
코어 네트워크는 2031년까지 연평균 성장률(CAGR) 14.80%로 확대될 것으로 예상되며, 통신 인프라 중 가장 빠르게 성장하는 하위 부문이 될 것입니다. 아시아태평양의 5G 인프라 시장에서 클라우드 네이티브 코어 시스템 시장 규모는 레거시 패킷 게이트웨이에서 클라우드 네이티브 코어로의 전환에 힘입어 성장하고 있습니다. NTT 도코모에 따르면, 이 회사의 상용 클라우드 네이티브 코어는 전력 소비를 70% 절감하여 다른 통신 사업자들에게 운영 비용의 벤치마크가 되고 있습니다. 노키아와 Tune Talk는 2026년 1월 아세안(ASEAN) 지역에서 클라우드 네이티브 코어 도입을 완료하며, 이 아키텍처를 개발도상국 통신 사업자 시장으로 확대했습니다. 클라우드 네이티브 코어 플랫폼은 통신 사업자가 용량을 확장하고, 네트워크 기능을 자동화하며, 엔터프라이즈 서비스를 지원하는 데 도움이 됩니다. 또한, ‘오픈 텔레콤 생태계’ 이니셔티브와 3GPP 릴리스 17 및 릴리스 18의 요구 사항도 이러한 도입에 있어 벤더 선정에 영향을 미치고 있습니다.
2025년, 미드밴드 주파수 대역은 전체 주파수 대역 부문의 69.21%를 차지했습니다. 각 지역의 규제 당국이 3.5GHz 대역 계획을 광범위하게 채택함에 따라, 이 대역은 매크로 5G 네트워크의 주요 커버리지 및 용량 계층으로 계속 자리 잡고 있습니다. 이 대역은 전파 거리와 네트워크 용량 사이에서 실용적인 균형을 제공합니다. 1GHz 미만의 저대역 주파수는 서비스가 충분히 제공되지 않는 지역이 광범위하게 분포된 국가에서 지방 커버리지 및 실내 서비스를 뒷받침하고 있습니다. 인도와 호주에서는 600 MHz 대역 및 700 MHz 대역이 주요 도시를 넘어 커버리지를 확대할 수 있다는 점에서 정책적 우선순위가 부여되고 있습니다.
고주파대역/mm파는 2031년까지 연평균 성장률(CAGR) 17.22%로 확대될 것으로 예측됩니다. 일본의 통신 사업자들은 28GHz 대역의 상용화를 진행 중이며, 한국에서는 28GHz 대역 이용에 관한 기업용 라이선스가 발급되었습니다. 또한 인도 역시 향후 주파수 경매 체계에 26GHz를 포함시키고 있습니다. 아시아태평양의 5G 인프라 시장에서는 광범위한 소비자 대상 커버리지보다는 공장, 경기장, 교통 기관 등 밀집된 장소에서 먼저 mm파가 도입될 가능성이 높을 것으로 보입니다. 삼성이 KDDI와 공동으로 실시한 실증 실험에서는 AI를 활용한 ‘RAN Speed Optimizer’를 사용함으로써 3.7GHz 대역의 처리량이 52% 향상된 것으로 나타났습니다. 일본과 한국에서 운영 경험이 축적됨에 따라 장비 비용이 절감될 가능성이 있으며, 이에 따라 2027년 이후 다른 지역 시장에서의 활용이 촉진될 수 있습니다.
기타 혜택 :
- 엑셀 형식 시장 예측(ME) 시트
- 3개월간의 애널리스트 지원
자주 묻는 질문
목차
제1장 서론
제2장 조사 방법
제3장 개요
제4장 시장 구도
제5장 시장 규모 및 성장 예측
제6장 경쟁 구도
제7장 시장 기회 및 향후 전망
AJY 26.09.01According to Mordor Intelligence, the Asia-Pacific 5G infrastructure market size is projected to expand from USD 32.95 billion in 2025 and USD 34.67 billion in 2026 to USD 56.32 billion by 2031, registering a CAGR of 10.19% from 2026 to 2031.
This report is Segmented by Communication Infrastructure (5G Radio Access Network (RAN), and More), Spectrum Band (Low-Band and More), Network Architecture (Non-Standalone (NSA), and Standalone (SA)), Core Network Technology (Software-Defined Networking (SDN), and More), End-User Vertical (Consumer Electronics and More), and Country. The Market Forecasts are Provided in Terms of Value (USD).
Asia-Pacific 5G Infrastructure Market Trends and Insights
Rising 5G Traffic Density and Low-Latency Demand
China had more than 1.204 billion 5G subscriptions and 2.888 billion mobile IoT terminal connections by the end of 2025. This scale requires operators to add capacity while also upgrading their standalone core networks. China's 5G-Advanced service covered 330 cities in March 2026, supported by active antenna systems that can manage beamforming at scale. The parallel buildout of dense radio sites and standalone architecture shortens the path to low-latency services, but it also increases early capital requirements for vendors and site specialists. Smart factories using 5G and industrial internet programs recorded 20.5% gains in product quality and 24.7% gains in production capacity. These operating results support wider demand for capacity and latency-sensitive industrial connectivity in the Asia-Pacific 5G infrastructure market.
Government-Led Spectrum Allocation and Rollout Programs
India's Telecom Regulatory Authority released auction recommendations in February 2026 for 11,789.15MHz across 9 frequency bands. The proposal carried a reserve value of INR 2.10 lakh crore (USD 23.1 billion). It also linked a 10% reduction in the reserve price to new base stations in coverage gaps, directing operator spending toward underserved areas. Vietnam paired spectrum discounts with equipment-cost support for operators that build 20,000 5G base stations, using policy to encourage infrastructure investment. South Korea required standalone upgrades by 2026 and used lower LTE reallocation fees to support operators that meet indoor coverage goals. Government measures now extend beyond spectrum allocation and shape the pace, location, and architecture of network investment across the Asia-Pacific 5G infrastructure market.
High Densification and Fiber Backhaul CAPEX
Dense small-cell networks require fiber links to each site, especially where operators use mmWave spectrum or add capacity layers. China's optical fiber network reached 74.99 million km by the end of 2025, providing a strong foundation for its large 5G rollout. Many Southeast Asian and South Asian markets have less last-mile fiber, which makes densification more expensive and slower to deliver. The wider region faced a USD 200 billion infrastructure investment shortfall through the end of the decade, including gaps in backhaul financing. Operators without strong fiber networks must choose between expensive wireless backhaul and delayed capacity expansion. Site acquisition, power access, and landlord negotiations can add 18-24 months to small-cell rollouts in markets such as India and Indonesia.
Other drivers and restraints analyzed in the detailed report include:
- Expansion of Private 5G for Industrial Automation
- Accelerating Open RAN and Cloud-Native Network Adoption
- Spectrum Cost Pressure and Uneven Mid-Band Availability
For complete list of drivers and restraints, kindly check the Table Of Contents.
Segment Analysis
5G Radio Access Network held 60.96% of the Asia-Pacific 5G infrastructure market share within communication infrastructure in 2025. RAN remains the main destination for capital spending as operators densify base stations across China, India, Japan, and Southeast Asia. China Tower deployed more than 900,000 base stations per year by mid-2026 and had helped build more than 5.6 million sites in total. This operating scale shows why radio equipment, antennas, and site infrastructure continue to account for a large part of spending. Transport/xHaul is the second-largest sub-segment because every new macro site and small cell requires fronthaul, midhaul, or backhaul links.
Core Network is projected to expand at a 14.80% CAGR through 2031, making it the fastest-growing sub-segment of communication infrastructure. The Asia-Pacific 5G infrastructure market size for cloud-native core systems is supported by the shift away from legacy packet gateways. NTT DOCOMO's commercial cloud-native core reduced power consumption by 70%, according to the company, offering an operating-cost benchmark for other operators. Nokia and Tune Talk completed an ASEAN cloud-native core deployment in January 2026, extending this architecture to a developing operator market. Cloud-native core platforms can help operators scale capacity, automate network functions, and support enterprise services. Open Telecom Ecosystem practices and 3GPP Release 17 and Release 18 requirements are also affecting vendor selection for these deployments.
Mid-band spectrum held 69.21% share of the spectrum band segment in 2025. It remains the primary coverage and capacity layer for macro 5G networks because regional regulators have broadly adopted plans for the 3.5 GHz band. The band offers a practical balance between propagation range and network capacity. Low-band spectrum below 1 GHz supports rural coverage and indoor service in countries with extensive underserved areas. India and Australia give policy priority to the 600 MHz and 700 MHz bands because those frequencies can extend coverage beyond major cities.
High-band/mmWave is projected to expand at a 17.22% CAGR through 2031. Japan's operators have commercial 28GHz deployments, while South Korea has enterprise licensing for 28GHz use. India also included 26GHz in its forthcoming spectrum auction framework. The Asia-Pacific 5G infrastructure market is likely to use mmWave first in factories, stadiums, transit facilities, and similar concentrated locations rather than broad consumer coverage. Samsung's live trial with KDDI showed a 52% increase in throughput on the 3.7GHz band using its AI-powered RAN Speed Optimizer. Equipment costs can improve as Japan and South Korea build more operational experience, which could support use in other regional markets after 2027.
Complete Report Scope:
- By Communication Infrastructure
- 5G Radio Access Network (RAN)
- Transport/xHaul (Front-Haul, Mid-Haul, Back-Haul)
- Core Network (Cloud-Native 5G Core)
- By Spectrum Band
- Low-Band (Less Than 1 GHz)
- Mid-Band (1-6 GHz)
- High-Band / mmWave (Above 24 GHz)
- By Network Architecture
- Non-Standalone (NSA)
- Standalone (SA)
- By Core Network Technology
- Software-Defined Networking (SDN)
- Network Function Virtualization (NFV)
- Multi-Access Edge Computing (MEC)
- Network Slicing
- By End-User Vertical
- Consumer Electronics
- Automotive and Mobility
- Industrial Manufacturing
- Healthcare and Life Sciences
- Energy and Utilities
- Public Safety and Defense
- Smart Cities and Infrastructure
- Other End-User Verticals (Retail, Media, Agriculture)
- By Country
- China
- Japan
- South Korea
- India
- Australia
- Rest of Asia-Pacific
List of Companies Covered in this Report:
- Huawei Technologies Co., Ltd.
- Telefonaktiebolaget LM Ericsson
- Nokia Corporation
- ZTE Corporation
- Samsung Electronics Co., Ltd.
- NEC Corporation
- Fujitsu Limited
- Cisco Systems, Inc.
- Hewlett Packard Enterprise Development LP
- Qualcomm Incorporated
- Intel Corporation
- Juniper Networks, Inc.
- Ciena Corporation
- Mavenir Systems, Inc.
- Rakuten Symphony, Inc.
- CommScope Holding Company, Inc.
- NVIDIA Corporation
- Oracle Corporation
- Broadcom Inc.
- Airspan Networks Inc.
Additional Benefits:
- The market estimate (ME) sheet in Excel format
- 3 months of analyst support
TABLE OF CONTENTS
1 INTRODUCTION
- 1.1 Study Assumptions and Market Definition
- 1.2 Scope of the Study
2 RESEARCH METHODOLOGY
3 EXECUTIVE SUMMARY
4 MARKET LANDSCAPE
- 4.1 Market Overview
- 4.2 Market Drivers
- 4.2.1 Rising 5G Traffic Density and Low-Latency Demand
- 4.2.2 Government-Led Spectrum Allocation and Rollout Programs
- 4.2.3 Expansion of Private 5G for Industrial Automation
- 4.2.4 Accelerating Open RAN and Cloud-Native Network Adoption
- 4.2.5 Cross-Border Semiconductor Supply Chain Diversification in Asia-Pacific
- 4.2.6 Edge-Driven Monetization for Ports, Mining, and Logistics Nodes
- 4.3 Market Restraints
- 4.3.1 High Densification and Fiber Backhaul CAPEX
- 4.3.2 Spectrum Cost Pressure and Uneven Mid-Band Availability
- 4.3.3 Multi-Vendor Interoperability and Integration Complexity
- 4.3.4 Power Availability and Site Acquisition Constraints in Dense Urban Markets
- 4.4 Industry Value Chain Analysis
- 4.5 Regulatory Landscape
- 4.6 Technological Outlook
- 4.7 Investment and Funding Trends
- 4.8 Porter's Five Forces Analysis
- 4.8.1 Bargaining Power of Suppliers
- 4.8.2 Bargaining Power of Buyers
- 4.8.3 Threat of New Entrants
- 4.8.4 Intensity of Competitive Rivalry
- 4.8.5 Threat of Substitute Products
5 MARKET SIZE AND GROWTH FORECASTS (VALUE)
- 5.1 By Communication Infrastructure
- 5.1.1 5G Radio Access Network (RAN)
- 5.1.2 Transport/xHaul (Front-Haul, Mid-Haul, Back-Haul)
- 5.1.3 Core Network (Cloud-Native 5G Core)
- 5.2 By Spectrum Band
- 5.2.1 Low-Band (Less Than 1 GHz)
- 5.2.2 Mid-Band (1-6 GHz)
- 5.2.3 High-Band / mmWave (Above 24 GHz)
- 5.3 By Network Architecture
- 5.3.1 Non-Standalone (NSA)
- 5.3.2 Standalone (SA)
- 5.4 By Core Network Technology
- 5.4.1 Software-Defined Networking (SDN)
- 5.4.2 Network Function Virtualization (NFV)
- 5.4.3 Multi-Access Edge Computing (MEC)
- 5.4.4 Network Slicing
- 5.5 By End-User Vertical
- 5.5.1 Consumer Electronics
- 5.5.2 Automotive and Mobility
- 5.5.3 Industrial Manufacturing
- 5.5.4 Healthcare and Life Sciences
- 5.5.5 Energy and Utilities
- 5.5.6 Public Safety and Defense
- 5.5.7 Smart Cities and Infrastructure
- 5.5.8 Other End-User Verticals (Retail, Media, Agriculture)
- 5.6 By Country
- 5.6.1 China
- 5.6.2 Japan
- 5.6.3 South Korea
- 5.6.4 India
- 5.6.5 Australia
- 5.6.6 Rest of Asia-Pacific
6 COMPETITIVE LANDSCAPE
- 6.1 Market Concentration
- 6.2 Strategic Moves
- 6.3 Market Share Analysis
- 6.4 Company Profiles (includes Global Level Overview, Market Level Overview, Core Segments, Financials as available, Strategic Information, Market Rank/Share, Products and Services, Recent Developments)
- 6.4.1 Huawei Technologies Co., Ltd.
- 6.4.2 Telefonaktiebolaget LM Ericsson
- 6.4.3 Nokia Corporation
- 6.4.4 ZTE Corporation
- 6.4.5 Samsung Electronics Co., Ltd.
- 6.4.6 NEC Corporation
- 6.4.7 Fujitsu Limited
- 6.4.8 Cisco Systems, Inc.
- 6.4.9 Hewlett Packard Enterprise Development LP
- 6.4.10 Qualcomm Incorporated
- 6.4.11 Intel Corporation
- 6.4.12 Juniper Networks, Inc.
- 6.4.13 Ciena Corporation
- 6.4.14 Mavenir Systems, Inc.
- 6.4.15 Rakuten Symphony, Inc.
- 6.4.16 CommScope Holding Company, Inc.
- 6.4.17 NVIDIA Corporation
- 6.4.18 Oracle Corporation
- 6.4.19 Broadcom Inc.
- 6.4.20 Airspan Networks Inc.
7 MARKET OPPORTUNITIES AND FUTURE OUTLOOK
- 7.1 White-Space and Unmet-Need Assessment


