
|
시장보고서
상품코드
2118938
가상 이벤트 마케팅 서비스 시장 : 시장 점유율 분석, 업계 동향 및 통계, 성장 예측(2026-2031년)Virtual Event Marketing Services - Market Share Analysis, Industry Trends & Statistics, Growth Forecasts (2026 - 2031) |
||||||
 Mordor Intelligence
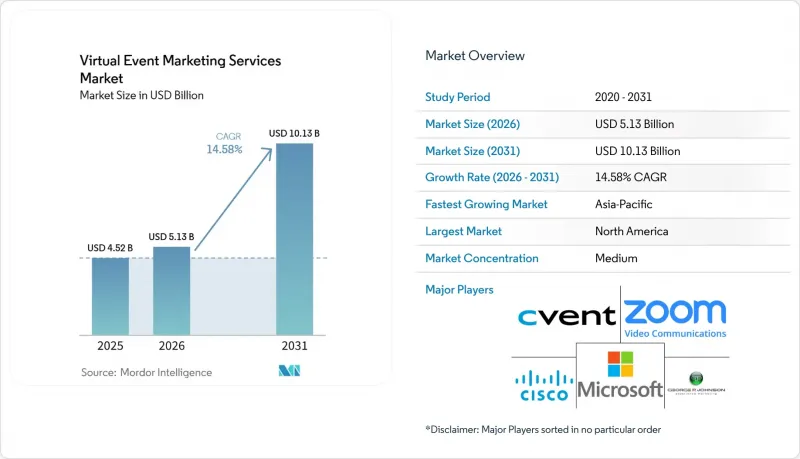
Mordor Intelligence에 의하면, 가상 이벤트 마케팅 서비스 시장 규모는 2025년 45억 2,000만 달러로 평가되었고, 2026년 51억 3,000만 달러에서 2031년까지 101억 3,000만 달러로 확대될 전망이며, 2026-2031년 CAGR 14.58%를 나타낼 것으로 예측됩니다.
본 보고서는 서비스 유형별(전략 및 캠페인 기획, 참가자 유치 및 등록 관리 등), 이벤트 형식별(라이브 스트리밍을 통한 기업 이벤트 등), 조직 규모별(대기업, 중소기업), 최종 사용자 산업별(IT 및 통신, BFSI 등), 그리고 지역별로 분류되어 있습니다. 시장 예측은 금액(달러) 기준으로 제시되어 있습니다.
세계의 가상 이벤트 마케팅 서비스 시장 동향 및 인사이트
원격 및 하이브리드 근무의 확산으로 디지털 이벤트 예산 확대
하이브리드 근무의 확산으로 인해 대면 프로그램만으로는 충분히 포괄할 수 없는 분산된 참가자들이 생겨나고 있습니다. 기업이 장소에 구애받지 않고 직원, 구매자, 파트너를 참여시킬 수 있는 일관된 방법을 필요로 할 때, 특히 참가자의 참여가 이동 일정이나 행사장 수용 인원에 의해 제한되지 않는 경우에는 가상 이벤트 마케팅 서비스 시장이 혜택을 받게 됩니다. 인용된 2026년 포레스터(Forrester)의 분석에 따르면, 제조업, 전문 서비스업, 기술 산업에서 이벤트는 프로그램 예산의 최대 30%를 차지했습니다. 같은 분석에 따르면, 이벤트 예산을 10% 이상 증액하는 조직의 비율은 전년 대비 2배로 증가했습니다. Bizzabo의 보고서에 따르면, 포춘 1000대 기업의 마케팅 담당자 중 74%가 2026년에 이벤트 예산을 증액할 계획이며, 모든 주최자의 40%가 예산 증가를 예상하고 있습니다. WCAG 2.2 및 유럽 접근성 법규와 같은 접근성 요건 또한 자막 및 다국어 방송을 표준 기능으로 제공하는 서비스를 뒷받침하고 있습니다.
AI를 활용한 개인화 및 컨텐츠 재사용이 전환율을 끌어올리고 있습니다.
AI는 서비스 제공업체가 가상 프로그램을 준비, 전달 및 확장하는 방식을 혁신하고 있습니다. ON24의 보고서에 따르면, 생명과학 분야의 벤치마크에서 개인화된 가상 이벤트 랜딩 페이지를 통해 데모 요청이 3배 증가했고, 예약된 회의 건수도 2배 증가했습니다. 또한 이 회사는 팀이 AI로 생성된 파생 자산을 활용했을 때, 단일 웨비나 녹화물에서 얻을 수 있는 컨텐츠 양이 전년 대비 6배 증가했다고 보고했습니다. Cvent사는 자사의 CventIQ 엔진이 연간 127억 건의 참가자 상호작용을 처리하며, 이 데이터를 참석 모델, 네트워킹 제안, 컨텐츠 추천에 활용하고 있다고 밝혔습니다. Goldcast의 AI 컨텐츠 랩은 세션 녹화본에서 짧은 하이라이트 영상이나 관련 자산을 생성할 수 있습니다. 이러한 기능을 통해 가상 이벤트 마케팅 서비스 시장은 수작업 제작량을 크게 늘리지 않고도 라이브 세션 종료 후에도 지속되는 캠페인을 지원할 수 있게 됩니다.
웨비나 피로감이 라이브 참여율과 네트워킹을 저하시킨다.
웨비나 일정이 과밀해지면 라이브 참여율이 떨어지고 네트워킹 성과도 약화될 가능성이 있습니다. 앞서 언급한 포레스터(Forrester)사의 조사에 따르면, 이벤트 담당자의 70% 가까이가 각 프로그램의 품질을 유지하면서 이벤트 총 수를 줄이고 있는 것으로 나타났습니다. Bizzabo사의 보고서에 따르면, 좋은 성과를 거두고 있는 조직은 평균 412건의 등록과 52%의 이벤트 참여율을 기록하고 있습니다. 이러한 수치는 구매자들이 관련성, 제작 품질, 그리고 개별적으로 맞춤화된 상호작용을 더욱 중요하게 여기고 있음을 보여줍니다. 따라서 가상 이벤트 마케팅 서비스 시장은 저비용으로 대량 개최하는 것이 아니라, 참여의 명확한 이유나 가이드가 제공되는 상호작용을 위한 더 유익한 기회 등, 더 강력한 성과를 제공해야 할 필요가 있습니다. 측정 가능한 성과를 보여줄 수 있는 제공업체는 그렇지 않았다면 기본적인 웨비나 도구에 분산되었을 예산을 확보할 가능성이 있습니다.
부문 분석
2025년, 가상 이벤트 마케팅 서비스 시장에서 잠재 고객 확보 및 등록 관리는 24.37%의 점유율을 차지했습니다. 이는 모든 프로그램에서 이벤트 방송 시작 전에 자격을 갖추고 참가 허가를 받은 잠재 고객이 필요하며, 이후의 후속 조치가 정확한 등록 기록에 의존하기 때문에 기본적인 요구 사항을 충족시키는 것입니다. 기업 팀은 리드의 품질, 데이터의 무결성, 캠페인 후속 조치 준비 상황, 그리고 이러한 기록을 기존 고객 시스템과 연동하는 능력을 바탕으로 등록을 평가하는 경향이 강해지고 있습니다. 또한, 등록 워크플로는 이벤트 종료 후 참여 데이터를 책임감 있게 활용하기 위해 필요한 동의 기록도 확립합니다. 이를 통해 이 서비스는 보다 광범위한 디지털 이벤트 캠페인을 관리하는 제공업체에게 실용적인 진입점이 되고 있습니다.
가상 제품 발표회 및 라이브 스트리밍을 통한 프로모션은 2026-2031년 연평균 성장률(CAGR) 16.69%로 확대될 것으로 예측됩니다. 마케팅 팀은 이러한 형식을 활용하여 물리적 프로그램을 재현하지 않고도 지역을 초월한 제품 발표를 조정하고 있습니다. 라이브 형식의 디지털 활성화는 더 폭넓은 청중에게 제품을 소개하는 동시에 퍼스트파티 인텐트 데이터를 생성할 수 있습니다. 플랫폼의 설정과 운영은 팀이 복잡한 시스템 간에 신뢰할 수 있는 통합을 필요로 하는 상황에서 여전히 중요합니다. 웨비나, 컨퍼런스, 참여 유도, 네트워킹 서비스는 개인화된 의제나 적절한 소개가 ‘선택 사항’이 아닌 ‘필수’로 여겨지는 상황에서 그 중요성이 더욱 커지고 있습니다.
2025년, 웨비나는 가상 이벤트 마케팅 서비스 시장 점유율의 46.17%를 차지했습니다. 이러한 선도적인 위상은 B2B 수요 창출에서의 폭넓은 활용과 캠페인 간에 반복적으로 활용할 수 있는 배포 모델을 반영합니다. Bizzabo사의 보고서에 따르면, 참가자의 53%가 2026년에 더 많은 웨비나에 참여할 계획이라고 응답했습니다. 또한, 이 회사는 주최사의 61%에서 전년 대비 참가자 수가 증가했다고 보고했습니다. 이러한 결과는 참가자들이 더 관련성 높은 컨텐츠와 더 높은 제작 품질을 기대하고 있음에도 불구하고, 웨비나 이용이 지속될 것임을 뒷받침합니다.
가상 박람회 및 전시회는 참가 기업이 라이브 이벤트 종료 후에도 디지털을 통해 리드 확보 기간을 연장하고 잠재 고객과의 접점을 유지할 수 있기 때문에 2026-2031년 연평균 성장률(CAGR) 15.81%로 확대될 것으로 예측됩니다. 출품사들은 라이브 이벤트 종료 후에도 지속될 수 있는 리드 확보 기간을 높이 평가했습니다. 가상 컨퍼런스 및 서밋은 더 많은 주목을 받는 브랜드와 경영진의 커뮤니케이션 프로그램을 지원합니다. 라이브로 중계되는 기업 이벤트는 인증, 녹화 및 여러 지역으로의 중계가 필요한 IR(투자자 관계) 및 사내 커뮤니케이션 요구를 충족시키고 있습니다. 교육 및 워크숍 형식은 분산된 직원들이 대면 자격 취득에 따른 출장 비용을 절감하는 데 도움이 되며, 이는 가상 이벤트 마케팅 서비스 시장이 다양한 형식에 걸친 다채로운 요구 사항을 충족하고 있음을 보여줍니다.
지역별 분석
2025년, 북미는 가상 이벤트 마케팅 서비스 시장의 39.86% 점유율을 차지했습니다. 이 지역은 성숙한 비즈니스 환경 속에서 기업 소프트웨어 벤더, 마케팅 기술 플랫폼, 이벤트 기술 제공업체를 한데 모아, 경험 많은 구매자와 전문 서비스 제공업체로 구성된 광범위한 기반을 뒷받침하고 있습니다. 미국은 IT, BFSI(은행 및 금융 및 보험), 헬스케어 분야에서 수요를 주도하고 있으며, 이 분야의 고객들은 통합된 디지털 참여를 원하고 있습니다. Cvent와 Bizzabo는 이러한 요구를 충족시키는 지역 플랫폼 제공업체의 한 예입니다. 캐나다는 금융 서비스 및 정부 프로그램을 지원하고 있는 반면, 멕시코는 미국에 기반을 둔 다국적 기업들의 이중 언어 서비스 수요로 인해 혜택을 보고 있습니다.
유럽에는 독일, 영국, 프랑스를 필두로 규정 준수를 중시하는 구매자층이 존재합니다. 유럽연합(EU)의 2025년 GDPR(EU 개인정보보호규정) 시행 협정 및 2026년 EU AI법의 완전한 시행은 플랫폼 평가에 영향을 미치고 있습니다. 데이터 상주지 설정, 동의 관리, AI 관련 문서화를 갖춘 공급업체는 조달 심사 과정에서 우위를 점할 수 있습니다. 이러한 관리 조치는 마케팅 팀이 캠페인 설계만으로는 충족할 수 없는 요건을 충족시키기 때문입니다. 이탈리아와 스페인은 제조업 및 전문 서비스 분야의 2차 시장으로 자리 잡고 있으나, 영국의 UK GDPR(EU 개인정보보호규정)은 유럽 규정과 충분히 유사하기 때문에 지역 프로그램에서 발생하는 마찰을 최소화할 수 있습니다.
아시아태평양은 2026-2031년 연평균 성장률(CAGR) 17.24%로 확대될 것으로 예상되며, 이는 가상 이벤트 마케팅 서비스 시장에서 가장 높은 지역별 성장률입니다. 인도, 중국, 일본, 한국이 주요 수요 거점이며, 각각 대규모 기술, 금융 서비스 또는 B2B 커뮤니케이션 활동에 의해 뒷받침되고 있습니다. 인도의 IT 서비스 종사자층은 해당 국가의 BFSI(은행 및 금융 및 보험) 및 기술 관련 프로그램과 맞물려 빈번한 가상 참여를 뒷받침하고 있습니다. 2025년 IT 커뮤니케이션 기업이 실시한 조사에 따르면, 온라인 세미나가 일본 기업의 마케팅 활동 상위 3위에 올랐으며, 미디어가 주최한 온라인 세미나 참가자의 51.9%가 그 높은 효과를 보고했습니다. 중국에서는 기업의 디지털화가 진행되면서 웨비나 및 컨퍼런스 이용을 촉진하고 있는 반면, 한국과 호주에서는 기술 및 금융 서비스 분야 수요가 더해지고 있습니다.
기타 혜택 :
- 엑셀 형식 시장 예측(ME) 시트
- 3개월간의 애널리스트 지원
자주 묻는 질문
목차
제1장 서론
제2장 조사 방법
제3장 개요
제4장 시장 구도
제5장 시장 규모 및 성장 예측
제6장 경쟁 구도
제7장 시장 기회 및 향후 전망
AJY 26.09.01According to Mordor Intelligence, the virtual event marketing services market size is projected to expand from USD 4.52 billion in 2025 and USD 5.13 billion in 2026 to USD 10.13 billion by 2031, registering a CAGR of 14.58% between 2026 and 2031.
This report is Segmented by Service Type (Strategy and Campaign Planning, Audience Acquisition and Registration Management, and More), Event Format (Live-Streamed Corporate Events, and More), Organization Size (Large Enterprises, and Small and Medium-Sized Enterprises), End-User Industry (IT and Telecom, BFSI, and More), and Geography. The Market Forecasts are Provided in Terms of Value (USD).
Global Virtual Event Marketing Services Market Trends and Insights
Remote and Hybrid Work Programs Expand Digital Event Budgets
Hybrid work has created a dispersed audience that physical-only programs cannot fully serve. The Virtual Event Marketing Services Market benefits when businesses need a consistent way to involve employees, buyers, and partners across locations, especially when audience participation is not limited by travel schedules or venue capacity. Events accounted for up to 30% of program budgets in manufacturing, professional services, and technology, according to the referenced 2026 Forrester analysis. The same analysis reported that the share of organizations increasing event budgets by more than 10% doubled year over year. Bizzabo reported that 74% of Fortune 1000 marketers planned to increase event budgets in 2026, while 40% of all organizers expected budget growth. Accessibility requirements, including WCAG 2.2 and the European Accessibility Act, also favor services that provide captioning and multilingual delivery as standard capabilities.
Artificial Intelligence-Driven Personalization and Content Repurposing Lift Conversion
AI is changing how service providers prepare, deliver, and extend virtual programs. ON24 reported that personalized virtual event landing pages delivered a 3X increase in demo requests and a 2X rise in meetings booked in its life sciences benchmarks. The company also reported a 6X year-over-year increase in content output from a single webinar recording when teams used AI-generated derivative assets. Cvent stated that its CventIQ engine processes 12.7 billion attendee interactions annually and uses this data for attendance models, networking suggestions, and content recommendations. Goldcast's AI Content Lab can produce short video highlights and related assets from session recordings. These capabilities enable the Virtual Event Marketing Services Market to support campaigns that continue after the live session without requiring a corresponding increase in manual production work.
Webinar Fatigue Weakens Live Engagement and Networking
Heavy webinar calendars can reduce live participation and weaken networking results. The referenced Forrester survey found that nearly 70% of event leaders were reducing their total event count while protecting the quality of each program. Bizzabo reported that organizations with strong results averaged 412 registrations and a 52% event attendance rate. These figures indicate that buyers are placing more weight on relevance, production quality, and tailored interaction. The Virtual Event Marketing Services Market, therefore, faces pressure to deliver stronger outcomes rather than low-cost volume, including clear reasons for attendance and more useful opportunities for guided interaction. Providers that can show measurable results may gain funding from programs that would otherwise have been spread across basic webinar tools.
Other drivers and restraints analyzed in the detailed report include:
- First-Party Engagement Data Improves Revenue Attribution
- Always-On On-Demand Content Hubs Extend Campaign Life
- Data Privacy and Cross-Border Compliance Complexity Raises Delivery Risk
For complete list of drivers and restraints, kindly check the Table Of Contents.
Segment Analysis
Audience acquisition and registration management held 24.37% of the Virtual Event Marketing Services Market share in 2025. It meets a basic need because every program requires a qualified, permissioned audience before event delivery begins, and because downstream follow-up depends on accurate registration records. Enterprise teams increasingly judge registrations by lead quality, data completeness, readiness for campaign follow-up, and the ability to connect those records to existing customer systems. Registration workflows also establish the consent record needed to use engagement data responsibly after the event. This makes the service a practical entry point for providers that manage broader digital event campaigns.
Virtual product launch and live-stream promotion are projected to expand at a 16.69% CAGR from 2026 to 2031. Marketing teams use these formats to coordinate launches across regions without replicating physical programs. A live digital activation can generate first-party intent data while it introduces a product to a wider audience. Platform setup and operations remain important where teams need dependable integration across complex systems. Webinar, conference, engagement, and networking services gain relevance when personalized agendas and matched introductions are expected rather than optional.
Webinars accounted for 46.17% of the Virtual Event Marketing Services Market share in 2025. Their leading position reflects broad use in B2B demand generation and a delivery model that can be repeated across campaigns. Bizzabo reported that 53% of attendees planned to attend more webinars in 2026. The company also reported year-over-year attendance increases for 61% of organizers. These results support continued webinar use, even as audiences expect more relevant content and better production quality.
Virtual trade shows and expos are projected to expand at a 15.81% CAGR from 2026 to 2031, as exhibitors use extended digital lead-capture periods after live event dates and maintain contact with prospective buyers. Exhibitors value the lead-capture period that can remain open after the live event has ended. Virtual conferences and summits support higher-profile brand and executive communication programs. Live-streamed corporate events support investor relations and internal communication needs that require authentication, recording, and multiregion delivery. Training and workshop formats help distributed workforces avoid the cost of in-person certification travel, showing that the Virtual Event Marketing Services Market supports different requirements across formats.
Complete Report Scope:
- By Service Type
- Strategy and Campaign Planning
- Audience Acquisition and Registration Management
- Platform Setup and Event Operations
- Webinar and Virtual Conference Marketing
- Virtual Product Launch and Live-Stream Promotion
- Audience Engagement and Networking Services
- Other Service Types
- By Event Format
- Webinars
- Virtual Conferences and Summits
- Online Product Launches
- Virtual Trade Shows and Expos
- Live-Streamed Corporate Events
- Virtual Training and Workshops
- By Organization Size
- Large Enterprises
- Small and Medium-Sized Enterprises
- By End-User Industry
- Retail and E-commerce
- IT and Telecommunications
- BFSI
- Healthcare and Life Sciences
- Media and Entertainment
- Travel and Hospitality
- Manufacturing and Industrials
- Other End-User Industries (Automotive, Public Sector, amongst Others)
- By Geography
- North America
- United States
- Canada
- Mexico
- South America
- Brazil
- Argentina
- Chile
- Rest of South America
- Europe
- Germany
- United Kingdom
- France
- Italy
- Spain
- Rest of Europe
- Asia-Pacific
- China
- Japan
- India
- South Korea
- Australia
- Rest of Asia-Pacific
- Middle East
- United Arab Emirates
- Saudi Arabia
- Qatar
- Rest of Middle East
- Africa
- South Africa
- Egypt
- Nigeria
- Rest of Africa
- North America
Geography Analysis
North America held 39.86% of the Virtual Event Marketing Services Market share in 2025. The region brings together enterprise software vendors, marketing technology platforms, and event technology providers in a mature business environment, which supports a broad base of experienced buyers and specialist service providers. The United States drives demand across IT, BFSI, and healthcare, where customers seek integrated digital engagement. Cvent and Bizzabo are among the regional platform providers serving these needs. Canada supports financial services and government programs, while Mexico benefits from bilingual service demand from US-based multinationals.
Europe has a compliance-focused buyer base, led by Germany, the United Kingdom, and France. The European Union's 2025 GDPR enforcement agreement and the EU AI Act's full enforcement in 2026 are affecting platform evaluations. Providers with data residency settings, consent management, and AI documentation can gain an advantage in procurement reviews, as these controls address requirements that marketing teams cannot address through campaign design alone. Italy and Spain are secondary markets in manufacturing and professional services, while the United Kingdom's UK GDPR remains close enough to European rules to limit friction for regional programs.
Asia-Pacific is projected to expand at a 17.24% CAGR from 2026 to 2031, the fastest regional rate in the Virtual Event Marketing Services Market. India, China, Japan, and South Korea are the main demand centers, each supported by large technology, financial services, or business-to-business communications activity. India's IT services workforce, along with its BFSI and technology programs, supports frequent virtual engagement. A 2025 IT Communication Company survey ranked online seminars among the top 3 marketing activities for Japanese companies, and 51.9% of participants in media-hosted online seminars reported high effectiveness. China's enterprise digitalization supports webinar and conference use, while South Korea and Australia add demand from technology and financial services.
- Cvent Holding Corp.
- ON24, Inc.
- Bizzabo Ltd.
- 6Connex, Inc.
- vFairs LLC
- Airmeet Inc.
- BigMarker Holdings, Inc.
- Hubilo Technologies Inc.
- Zoom Communications, Inc.
- Cisco Systems, Inc.
- Microsoft Corporation
- Kaltura, Inc.
- RingCentral, Inc.
- EventMobi
- SpotMe SA
- Accelevents
- InEvent
- Goldcast Inc.
- Remo
- Whova Inc.
Additional Benefits:
- The market estimate (ME) sheet in Excel format
- 3 months of analyst support
TABLE OF CONTENTS
1 INTRODUCTION
- 1.1 Study Assumptions and Market Definition
- 1.2 Scope of the Study
2 RESEARCH METHODOLOGY
3 EXECUTIVE SUMMARY
4 MARKET LANDSCAPE
- 4.1 Market Overview
- 4.2 Market Drivers
- 4.2.1 Remote and Hybrid Work Programs Expand Digital Event Budgets
- 4.2.2 Cost-Efficient Global Reach Improves Virtual Event Economics
- 4.2.3 Artificial Intelligence-Driven Personalization and Content Repurposing Lift Conversion
- 4.2.4 First-Party Engagement Data Improves Revenue Attribution
- 4.2.5 Always-On On-Demand Content Hubs Extend Campaign Life
- 4.2.6 Sponsor Demand for Measurable Digital Activation Boosts Service Spend
- 4.3 Market Restraints
- 4.3.1 Webinar Fatigue Weakens Live Engagement and Networking
- 4.3.2 Data Privacy and Cross-Border Compliance Complexity Raises Delivery Risk
- 4.3.3 Fragmented Event Technology Stacks Create Data Silos and Friction
- 4.3.4 Return-on-Investment Proof Gaps Slow Budget Approval Cycles
- 4.4 Impact of Macroeconomic Factors on the Market
- 4.5 Industry Value-Chain Analysis
- 4.6 Technology Outlook
- 4.7 Regulatory Landscape
- 4.8 Porter's Five Forces Analysis
- 4.8.1 Threat of New Entrants
- 4.8.2 Bargaining Power of Suppliers
- 4.8.3 Bargaining Power of Buyers
- 4.8.4 Threat of Substitutes
- 4.8.5 Intensity of Competitive Rivalry
5 MARKET SIZE AND GROWTH FORECASTS (VALUE)
- 5.1 By Service Type
- 5.1.1 Strategy and Campaign Planning
- 5.1.2 Audience Acquisition and Registration Management
- 5.1.3 Platform Setup and Event Operations
- 5.1.4 Webinar and Virtual Conference Marketing
- 5.1.5 Virtual Product Launch and Live-Stream Promotion
- 5.1.6 Audience Engagement and Networking Services
- 5.1.7 Other Service Types
- 5.2 By Event Format
- 5.2.1 Webinars
- 5.2.2 Virtual Conferences and Summits
- 5.2.3 Online Product Launches
- 5.2.4 Virtual Trade Shows and Expos
- 5.2.5 Live-Streamed Corporate Events
- 5.2.6 Virtual Training and Workshops
- 5.3 By Organization Size
- 5.3.1 Large Enterprises
- 5.3.2 Small and Medium-Sized Enterprises
- 5.4 By End-User Industry
- 5.4.1 Retail and E-commerce
- 5.4.2 IT and Telecommunications
- 5.4.3 BFSI
- 5.4.4 Healthcare and Life Sciences
- 5.4.5 Media and Entertainment
- 5.4.6 Travel and Hospitality
- 5.4.7 Manufacturing and Industrials
- 5.4.8 Other End-User Industries (Automotive, Public Sector, amongst Others)
- 5.5 By Geography
- 5.5.1 North America
- 5.5.1.1 United States
- 5.5.1.2 Canada
- 5.5.1.3 Mexico
- 5.5.2 South America
- 5.5.2.1 Brazil
- 5.5.2.2 Argentina
- 5.5.2.3 Chile
- 5.5.2.4 Rest of South America
- 5.5.3 Europe
- 5.5.3.1 Germany
- 5.5.3.2 United Kingdom
- 5.5.3.3 France
- 5.5.3.4 Italy
- 5.5.3.5 Spain
- 5.5.3.6 Rest of Europe
- 5.5.4 Asia-Pacific
- 5.5.4.1 China
- 5.5.4.2 Japan
- 5.5.4.3 India
- 5.5.4.4 South Korea
- 5.5.4.5 Australia
- 5.5.4.6 Rest of Asia-Pacific
- 5.5.5 Middle East
- 5.5.5.1 United Arab Emirates
- 5.5.5.2 Saudi Arabia
- 5.5.5.3 Qatar
- 5.5.5.4 Rest of Middle East
- 5.5.6 Africa
- 5.5.6.1 South Africa
- 5.5.6.2 Egypt
- 5.5.6.3 Nigeria
- 5.5.6.4 Rest of Africa
- 5.5.1 North America
6 COMPETITIVE LANDSCAPE
- 6.1 Market Concentration
- 6.2 Strategic Moves
- 6.3 Market Share Analysis
- 6.4 Company Profiles (includes Global Level Overview, Market Level Overview, Core Segments, Financials as available, Strategic Information, Market Rank/Share, Products and Services, Recent Developments)
- 6.4.1 Cvent Holding Corp.
- 6.4.2 ON24, Inc.
- 6.4.3 Bizzabo Ltd.
- 6.4.4 6Connex, Inc.
- 6.4.5 vFairs LLC
- 6.4.6 Airmeet Inc.
- 6.4.7 BigMarker Holdings, Inc.
- 6.4.8 Hubilo Technologies Inc.
- 6.4.9 Zoom Communications, Inc.
- 6.4.10 Cisco Systems, Inc.
- 6.4.11 Microsoft Corporation
- 6.4.12 Kaltura, Inc.
- 6.4.13 RingCentral, Inc.
- 6.4.14 EventMobi
- 6.4.15 SpotMe SA
- 6.4.16 Accelevents
- 6.4.17 InEvent
- 6.4.18 Goldcast Inc.
- 6.4.19 Remo
- 6.4.20 Whova Inc.
7 MARKET OPPORTUNITIES AND FUTURE OUTLOOK
- 7.1 White-Space and Unmet-Need Assessment